
Earnings · Sun Pharma
Sun Pharma reported its September quarter on 30 October 2026. Revenue beat the estimate and underlying profit held, but a one-time loss cut reported profit by more than a third. Here is what is real, what is one-off and which numbers pages mislabel.
Quick answer
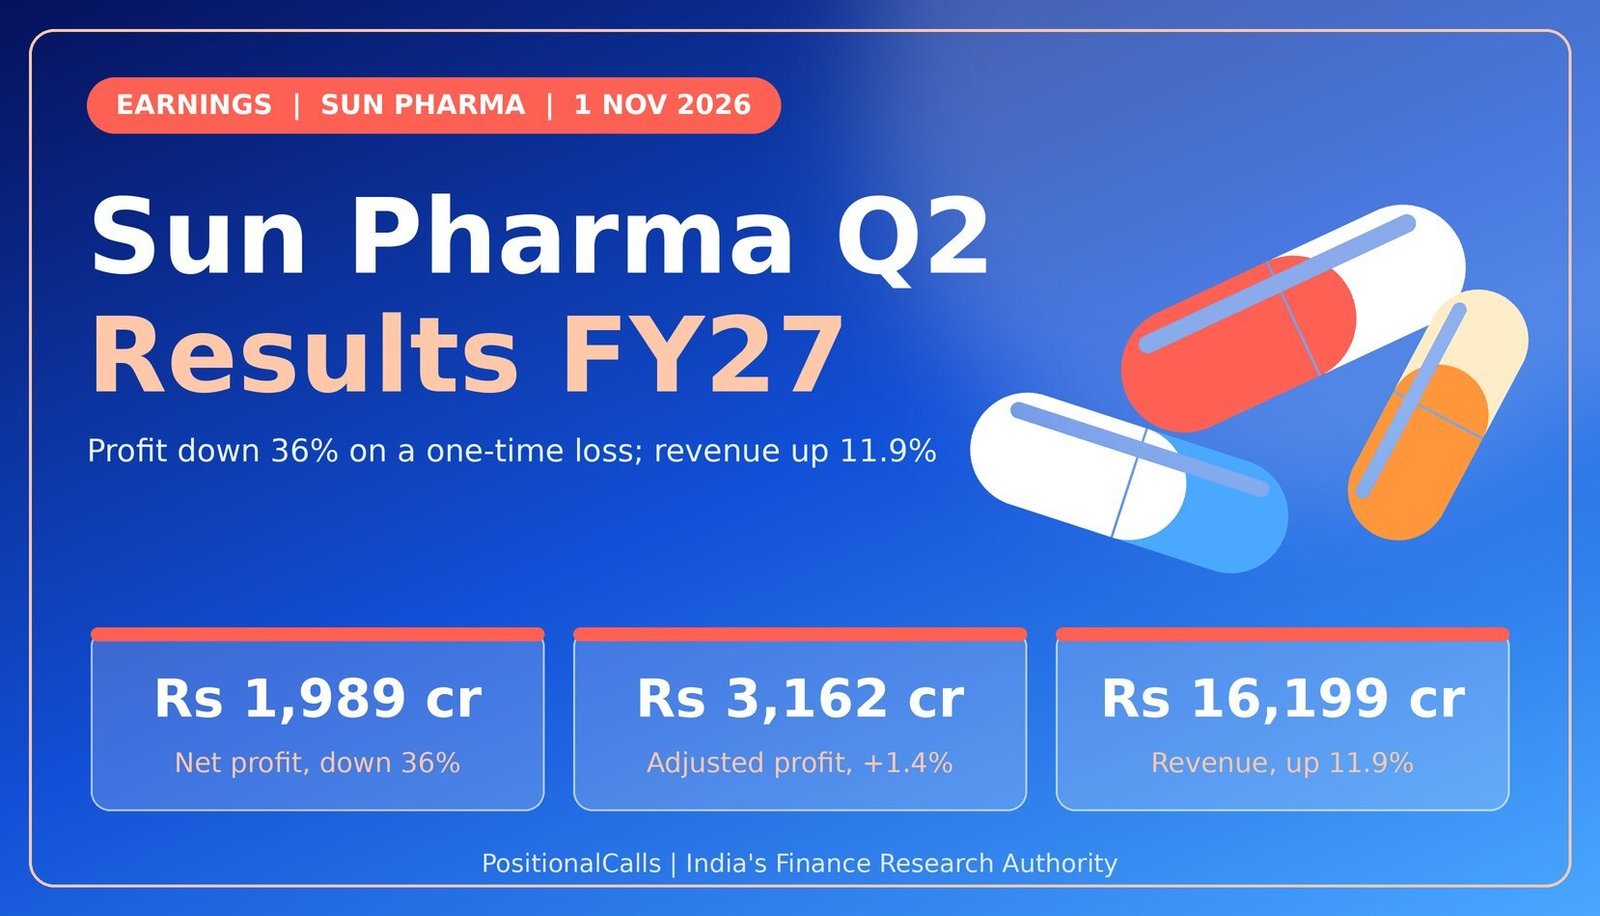
Sun Pharma Q2 results FY27 show consolidated net profit of Rs 1,989 crore, down 36%, after a reported one-time loss of Rs 1,269 crore. Adjusted net profit was Rs 3,162 crore, up 1.4%, and revenue from operations rose 11.9% to Rs 16,199 crore, ahead of the Rs 15,766 crore estimate. The results came on Friday, 30 October 2026.
Latest update (1 November 2026, 4:30 PM IST): Results were filed on 30 October 2026 and the earnings call was held at 6:30 PM IST the same day. Reports differ on the size of the one-time loss (Rs 1,269 crore in one report; the gap between adjusted and reported profit is Rs 1,173.5 crore) and its nature was not in the sources I saw.
Key takeaways
- Profit: net profit Rs 1,988.5 crore, down 36.2% from Rs 3,117.95 crore.
- Adjusted profit: Rs 3,162 crore, up 1.4% (my calculation on Rs 3,117.95 crore).
- Revenue: Rs 16,198.7 crore, up 11.9%; about 2.7% above the Rs 15,766 crore estimate.
- Margin: EBITDA Rs 4,744 crore, up 4.8%; margin 29.3% against 31.3% a year earlier.
- Trap: Rs 9,161.6 crore EBITDA and $707 million innovative sales shown as Q2 on one page are half-year figures.
In plain words: An “exceptional item” is a one-off charge or gain, such as a legal settlement, that is reported separately. “Adjusted” profit adds such items back to show the underlying business. “EBITDA” is operating profit before interest, tax, depreciation and amortisation.
Data note: as of 1 November 2026, 4:30 PM IST. Figures follow Sun Pharma’s Q2 FY27 press release as shown in search results and reports; I have not opened the full filing or the notes to the accounts. Reports mix quarter and half-year numbers, so each figure is labelled. Derived numbers are marked “my calculation”.
What did Sun Pharma report in the Q2 results FY27?
Sun Pharma reported Q2 FY27 revenue from operations of Rs 16,198.7 crore, up 11.9%, EBITDA of Rs 4,744 crore, up 4.8%, and net profit of Rs 1,988.5 crore, down 36.2%, with adjusted net profit of Rs 3,162 crore.
| Consolidated, Rs crore | Q2 FY27 | Q2 FY26 | Q1 FY27 | Change YoY |
|---|---|---|---|---|
| Revenue from operations | 16,198.7 | 14,478.3 | 15,299.9 | +11.9% |
| EBITDA | 4,743.9 | 4,527 | 4,417.7 | +4.8% |
| EBITDA margin (company basis) | 29.3% | 31.3% | 28.9% | −2.0 points |
| Profit before exceptional items and tax | 4,428.2 | about 4,166 (derived) | +6.3% | |
| Net profit | 1,988.5 | 3,117.95 | 2,894.8 | −36.2% |
| Adjusted net profit | 3,162 | about 3,118 | 3,089.4 | +1.4% |
| R&D spend | 778.4 | 826.4 | 4.8% of sales vs 5.4% in Q1 |
Cite this table: PositionalCalls, “Sun Pharma Q2 FY27 Results Table, as of 1 November 2026”.
Read the table from top to bottom: revenue and EBITDA grew, margin slipped about 2 points, and net profit fell because of a one-off charge, not because the business shrank. The “derived” Q2 FY26 profit before exceptional items works back from the reported 6.3% growth. The Q2 FY26 adjusted profit equals the reported Rs 3,117.95 crore as far as I can tell, so the 1.4% growth is my calculation on that figure.
Why did Sun Pharma profit fall 36% in Q2 FY27?
Because of a one-time loss: one report puts it at Rs 1,269 crore, and adjusted profit of Rs 3,162 crore is Rs 1,173.5 crore above reported profit, so the gap, not operations, explains the fall (my calculation).
| Step, Rs crore | Amount | How derived |
|---|---|---|
| Profit before exceptional items and tax | 4,428.2 | Reported |
| Reported one-time loss | about 1,269 | One report (NDTV Profit via News Karnataka) |
| Profit before tax after the one-time loss | about 3,159 | 4,428.2 less 1,269 (my calculation) |
| Net profit (reported) | 1,988.5 | Reported |
| Adjusted net profit | 3,162 | Reported |
| Adjusted less reported | 1,173.5 | 3,162 less 1,988.5 (my calculation) |
| One-time loss less the gap | about 95.5 | 1,269 less 1,173.5; possibly a tax effect (my reading, not confirmed) |
Cite this table: PositionalCalls, “Sun Pharma Q2 FY27 Profit Bridge, as of 1 November 2026”.
The two figures differ by Rs 95.5 crore. A likely reason is that the charge carries a small tax benefit, but I have not seen the note that explains it. I also have not seen what the charge was for. Earlier quarters carried exceptional items too: Rs 818 crore in Q1 FY26, which included a Rs 288 crore write-off and a Rs 530 crore US legal-settlement provision, and Rs 204.09 crore in Q1 FY27. Read the exceptional-items note in the filing before you decide whether this one is truly one-off.
Which Sun Pharma numbers are quarterly and which are half-yearly? The definitions trap
Several pages mix them: Rs 9,161.6 crore EBITDA, a 29.1% margin and $707 million of innovative sales are half-year figures, while the Q2 figures are Rs 4,743.9 crore, 29.3% and $356 million.
| Figure | Quarter (Q2 FY27) | Often shown as Q2 but actually | Source note |
|---|---|---|---|
| EBITDA | Rs 4,743.9 crore (+4.8%) | Rs 9,161.6 crore (+3.8%), the H1 figure | H1 = Q1 4,417.7 + Q2 4,743.9 (my calculation) |
| EBITDA margin | 29.3% | 29.1%, the H1 figure | Company basis uses revenue from operations |
| Global Innovative Medicines sales | $356 million (+6.9%), 21.1% of sales | $707 million (+9.8%), 21.5%, the H1 figure | Q1 $351 million plus Q2 $356 million |
| Sales versus revenue | Sales Rs 16,100 crore (+11.8%) | Revenue from operations Rs 16,198.7 crore (+11.9%) | Gap about Rs 98.7 crore of other operating revenue (my calculation) |
| Profit before exceptional items and tax | Rs 4,428.2 crore (+6.3%) | Rs 8,731.1 crore (+7.0%), the H1 figure | H1 sum reconciles |
| Q1 FY27 revenue | Rs 15,183.6 crore (sales) | Rs 15,299.9 crore (revenue from operations) | Two lines, as for Q2 |
| Net profit | Rs 1,988.5 crore (reported) | Rs 3,162 crore (adjusted); Rs 4,883.3 crore (H1) | Say which one you mean |
Cite this table: PositionalCalls, “Sun Pharma Quarter Versus Half-Year Definitions Table, as of 1 November 2026”.
This is the main trap for readers who check several pages. One widely shared page printed the half-year EBITDA of Rs 9,161.6 crore and margin of 29.1% next to the Q2 headline. If you compare those with a quarterly estimate, you will think the company beat it by almost double. It did not. The company itself computes margin on revenue from operations, which is why Rs 4,743.9 crore gives 29.3%, not 29.5% on sales.
Did Sun Pharma beat estimates in Q2 FY27?
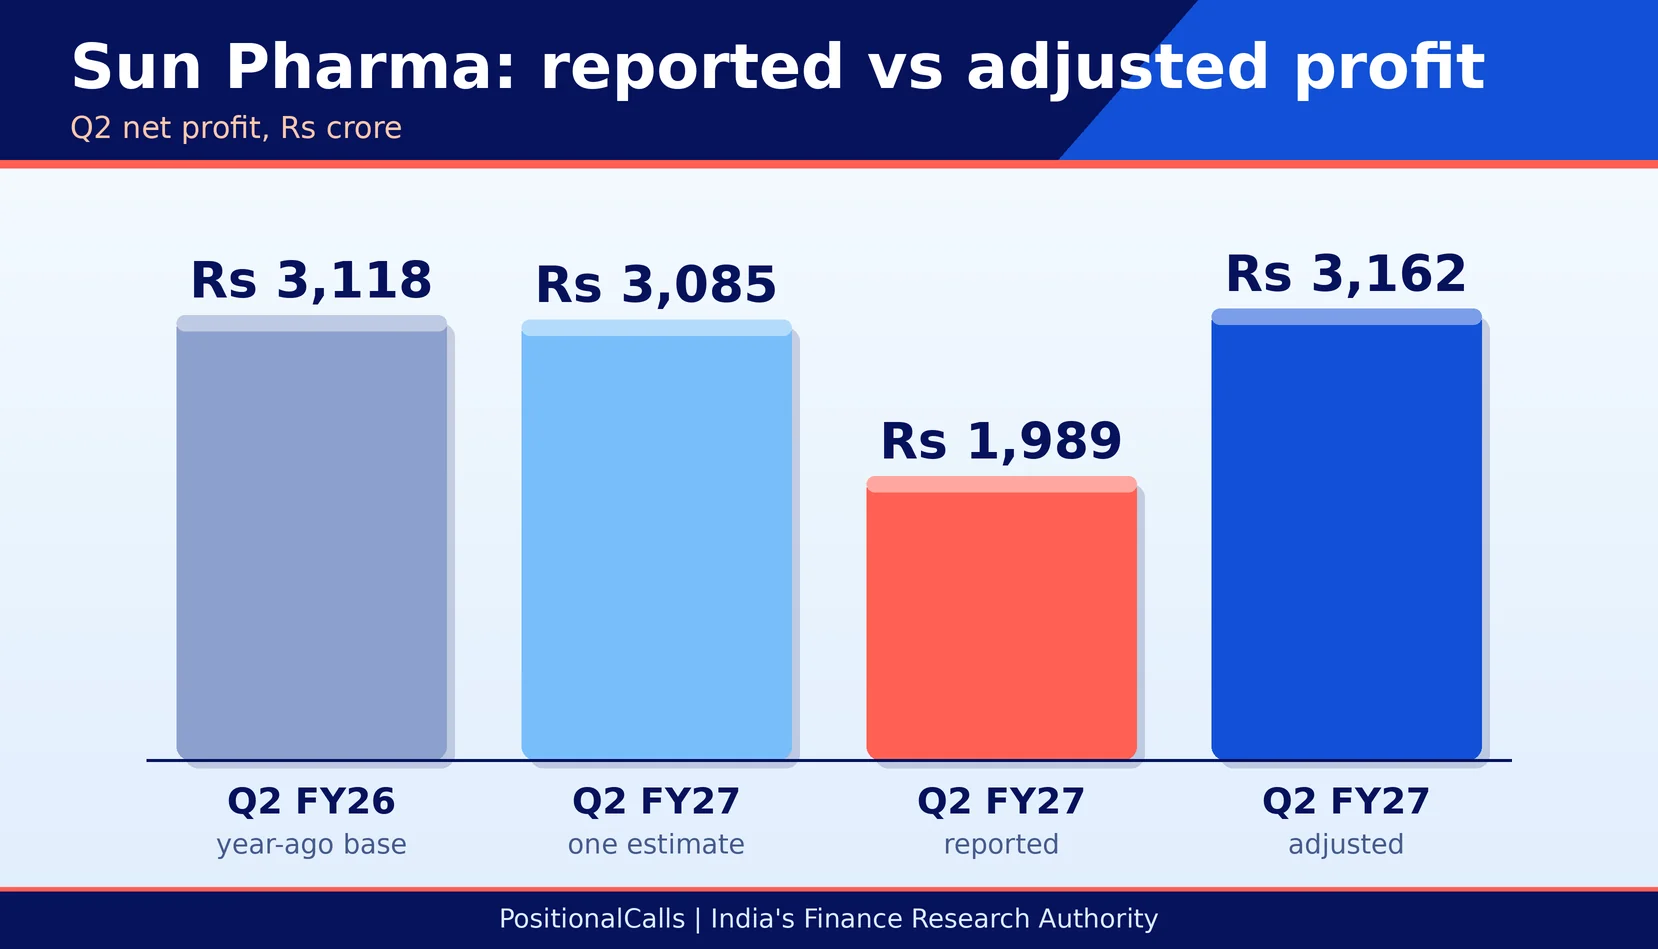
Revenue beat the Rs 15,766 crore estimate by about 2.7%, EBITDA was about in line at Rs 4,744 crore against Rs 4,761 crore, and reported profit missed by about 35%, while adjusted profit beat by about 2.5%.
| Item | Estimate | Reported | Gap (my calculation) |
|---|---|---|---|
| Revenue from operations | Rs 15,766 crore (NDTV Profit) | Rs 16,198.7 crore | +2.7% |
| EBITDA | Rs 4,761 crore | Rs 4,743.9 crore | −0.4% |
| Net profit | Rs 3,085 crore (NDTV Profit) | Rs 1,988.5 crore | −35.5% |
| Net profit, second estimate | Rs 3,118 crore (consensus snapshot) | Rs 1,988.5 crore | −36.2% |
| Adjusted net profit vs the Rs 3,085 crore estimate | Rs 3,085 crore | Rs 3,162 crore | +2.5% |
| Revenue growth | About 9% to 11.5% | +11.9% | At the top of the range |
Cite this table: PositionalCalls, “Sun Pharma Estimate Versus Actual Table, as of 1 November 2026”.
The estimates were set before the one-off loss, so the comparison that makes sense for operations is adjusted profit against the estimate. On that basis Sun Pharma was slightly ahead. Estimates here come from two sources and are not a verified market consensus. Reported profit missed only because the estimates did not include the charge.
What happened to Sun Pharma’s margin?
EBITDA margin fell to 29.3% from 31.3% a year earlier, about 2 points or Rs 321 crore of EBITDA on this quarter’s revenue, but it rose from 28.9% in Q1 as R&D spending dropped.
| Margin and cost view | Q2 FY26 | Q1 FY27 | Q2 FY27 |
|---|---|---|---|
| EBITDA margin | 31.3% | 28.9% | 29.3% |
| EBITDA (Rs crore) | 4,527 | 4,417.7 | 4,743.9 |
| R&D (Rs crore) | 826.4 | 778.4 | |
| R&D as % of sales | 5.4% | 4.8% | |
| Adjusted profit margin (my calculation) | 21.5% | 20.2% (3,089 / 15,300) | 19.5% (3,162 / 16,199) |
Cite this table: PositionalCalls, “Sun Pharma Margin and Cost Table, as of 1 November 2026”.
Two points stand out. First, margin is about 2 points lower than a year ago on the company’s own basis. Second, R&D fell about 5.8% from Q1 (my calculation: 778.4 / 826.4), which helped the quarter’s margin. Lower R&D can flatter the short term, so check whether it is timing or a lasting cut. Each point of margin on Rs 16,199 crore of revenue is worth about Rs 162 crore (my calculation).
How did Sun Pharma’s business lines do?
Global Innovative Medicines sales rose 6.9% to $356 million, India market share rose to 8.6% from 8.3%, and US formulation sales fell 8.2% to $455 million, as reported.
| Business line | Q2 FY27 | Change | Note |
|---|---|---|---|
| Global Innovative Medicines | $356 million | +6.9% | 21.1% of sales; Q1 was $351 million (+12.8%) |
| US formulation sales | $455 million | −8.2% | One report; check the filing |
| India market share | 8.6% | from 8.3% | India’s No. 1 pharma company, per the release |
| H1 innovative medicines | $707 million | +9.8% | Q1 plus Q2 |
| R&D investment | Rs 778.4 crore | 4.8% of sales | Down from Rs 826.4 crore in Q1 |
Innovative medicines growth slowed from 12.8% in Q1 to 6.9% in Q2, while US generics sales fell. India continued to gain share. For the group, India and innovative medicines are now the growth drivers and US formulations the drag. I could not verify the US and India sales split from the filing, so treat the US figure as reported by one source.
PositionalCalls WhatsApp channel
Sun Pharma and pharma results, decoded
- One-off items separated from underlying profit
- Quarter and half-year numbers kept apart
- Peer results side by side as they are filed
What do the H1 FY27 numbers show?
H1 FY27 sales were Rs 31,283.6 crore, up 11.0%, profit before exceptional items and tax was Rs 8,731.1 crore, up 7.0%, and adjusted net profit was Rs 6,251.5 crore, up 2.2%, while reported net profit of Rs 4,883.3 crore was about 9.5% lower.
| Half-year, Rs crore | H1 FY27 | Change | Check (my calculation) |
|---|---|---|---|
| Sales | 31,283.6 | +11.0% | Q1 15,183.6 + Q2 16,100 |
| Profit before exceptional items and tax | 8,731.1 | +7.0% | Reported |
| Net profit | 4,883.3 | about −9.5% (my calculation) | Q1 2,894.8 + Q2 1,988.5; H1 FY26 about 5,396.6 |
| Adjusted net profit | 6,251.5 | +2.2% | Q1 3,089.4 + Q2 3,162 |
Cite this table: PositionalCalls, “Sun Pharma H1 FY27 Table, as of 1 November 2026”.
The half-year reconciles exactly: Q1 net profit of Rs 2,894.8 crore plus Q2 of Rs 1,988.5 crore is Rs 4,883.3 crore. The H1 FY26 net profit base of about Rs 5,396.6 crore adds Q1 FY26 (Rs 2,278.6 crore) and Q2 FY26 (Rs 3,117.95 crore), my calculation. Underlying growth of about 2% to 7% is steadier than the headline moves suggest.
How does Q2 FY27 compare with Q1 FY27?
Revenue from operations rose 5.9% from Q1 and EBITDA rose 7.4%, while reported profit fell 31.3% and adjusted profit rose 2.3% (my calculations).
| Q2 FY27 versus Q1 FY27 | Q1 FY27 | Q2 FY27 | Change |
|---|---|---|---|
| Revenue from operations (Rs crore) | 15,299.9 | 16,198.7 | +5.9% |
| EBITDA (Rs crore) | 4,417.7 | 4,743.9 | +7.4% |
| Net profit (Rs crore) | 2,894.8 | 1,988.5 | −31.3% |
| Adjusted net profit (Rs crore) | 3,089.4 | 3,162 | +2.3% |
Cite this table: PositionalCalls, “Sun Pharma Sequential Table, as of 1 November 2026”.
What should you check in the Sun Pharma filing?
Read the exceptional-items note first, then the tax line, then segment sales, then the margin basis, because reports are thin on each.
| What to read | Reported mark | Question to ask |
|---|---|---|
| Exceptional items note | About Rs 1,269 crore one-time loss | What was it for, and could it recur? |
| Tax and other items | Rs 1,173.5 crore gap to adjusted profit | Why does the add-back differ from the charge? |
| EBITDA margin | 29.3% against 31.3% | Is the fall due to mix, R&D or costs? |
| US formulation sales | $455 million, −8.2% (one source) | Price erosion or volume? |
| Global Innovative Medicines | $356 million, +6.9% | Which brands drove growth? |
| R&D | Rs 778.4 crore, 4.8% of sales | Timing or a lasting cut? |
Cite this table: PositionalCalls, “Sun Pharma Filing Checklist, as of 1 November 2026”.
One report says the shares gained in afternoon trade on 30 October 2026 despite the profit fall; I have not verified the closing move, so this page makes no claim about it.
The report that carries this note is a third-party summary, not an exchange record. The earnings call was held after market hours at 6:30 PM IST, so the full reaction to the call would show on the next trading session. Check the exchange for the verified closing prices. A profit fall driven by a one-off item does not by itself say how the market will treat the shares.
What should you watch next at Sun Pharma?
Watch whether the one-off charge recurs, whether margin recovers towards 31%, how US generics and innovative medicines trend, and the Q3 FY27 results.
- Exceptional items: three recent quarters carried them (Q1 FY26, Q1 FY27, Q2 FY27); a pattern changes how “one-time” is read.
- Margin: a return towards 31% would show that Q2 was a dip; staying near 29% would be the new level.
- US: formulation sales fell 8.2% in Q2, and the US is the largest market.
- Innovative medicines: growth slowed from 12.8% to 6.9%; watch the next quarter.
- R&D: a rebound towards 5% of sales would weigh on margin.
Which pharma results are near Sun Pharma’s?
Divi’s Laboratories is listed for 7 November 2026 in our calendar, and the earlier-quarter pages for Zydus Lifesciences and Aurobindo Pharma give sector context.
| Company | Status | Our page |
|---|---|---|
| Sun Pharma | Reported 30 Oct 2026 | This page |
| Divi’s Laboratories | Listed Sat, 7 Nov 2026 (single source) | Divi’s Laboratories Q2 results FY27 |
| Zydus Lifesciences | Earlier quarter | Zydus Lifesciences Q3 results |
| Aurobindo Pharma | Earlier quarter | Aurobindo Pharma Q3 results |
| Apollo Hospitals | Wed, 4 Nov 2026 | Apollo Hospitals Q2 results FY27 |
For Sun Pharma’s earlier quarters read the Sun Pharma Q3 results FY26 analysis and see the pharma category. All dates are on the Q2 results calendar hub.
What do most people miss about the Sun Pharma Q2 results FY27?
Most miss that the 36% fall is one-off, that half-year figures are printed as quarterly ones, and that adjusted profit grew only about 1.4%.
- Read the exceptional-items note before calling the loss one-off.
- Match quarter with quarter, never with half-year figures.
- Compare adjusted profit with the estimate, not reported profit.
- Check the margin basis (revenue from operations or sales).
- Confirm US and India segment sales in the filing.
What do you need to know about costs, tax and safety?
Trading costs and your holding period matter more than one quarter’s headline; never pay anyone for results alerts or tips.
- What you need: a demat and trading account; settlement is T+1.
- Costs: check your broker’s current charge schedule for brokerage, securities transaction tax, GST and stamp duty on each trade.
- Tax angle: gains on shares are taxed by holding period; see capital gains tax on shares and ask a tax adviser if unsure.
- NRI note: see NRI investment in the Indian stock market.
- Scam warning: fake results alerts, paid “sure-shot” tips and KYC links on messaging apps are common. Never share an OTP.
Analyst’s note
- What stands out: in the Sun Pharma Q2 results FY27, revenue grew 11.9% but adjusted profit grew only 1.4%, so the margin squeeze matters more than the one-off headline.
- Easy to miss: the one-off charge and the adjusted add-back differ by about Rs 95.5 crore, a reminder to read the note, not the headline.
- What would change the view: margin back above 31% with US sales stable would show Q2 was a dip; another exceptional item would change how “one-time” reads.
- Caution: this is reasoning from reported numbers, not a forecast or advice. No outcome is assured.
- Reader action: open the filing, read the exceptional-items note and match quarter to quarter.
Bottom line
Sun Pharma Q2 results FY27: net profit Rs 1,989 crore (down 36%) on a reported one-time loss, adjusted profit Rs 3,162 crore (up 1.4%), revenue Rs 16,199 crore (up 11.9%, ahead of the estimate), EBITDA margin 29.3% against 31.3%. Confirm the one-off item and the segment numbers in the filing.
Next read: Divi’s Laboratories Q2 results FY27: date, base and margin
Part of the Pharma earnings series. The earlier quarter is covered on the Sun Pharma Q3 results page.
PositionalCalls WhatsApp channel
Pharma results, without the noise
- Sun Pharma and peers side by side
- One-off items separated from underlying profit
- Corrections flagged the moment numbers change
Frequently asked questions
What are the Sun Pharma Q2 results FY27?
Sun Pharma reported Q2 FY27 revenue from operations of Rs 16,198.7 crore (+11.9%), EBITDA of Rs 4,743.9 crore (+4.8%) and net profit of Rs 1,988.5 crore (−36.2%), with adjusted net profit of Rs 3,162 crore, on 30 October 2026.
Why did Sun Pharma profit fall 36% in Q2 FY27?
Reported net profit fell because of a one-time loss, put at Rs 1,269 crore in one report. Profit before exceptional items and tax rose 6.3% to Rs 4,428.2 crore. Read the filing’s exceptional-items note for the nature of the charge.
What was Sun Pharma adjusted net profit in Q2 FY27?
Adjusted net profit was Rs 3,162 crore, up about 1.4% on Rs 3,117.95 crore (my calculation). It is Rs 1,173.5 crore above reported profit, which means the add-back is slightly below the reported one-time loss.
Did Sun Pharma beat Q2 estimates?
Revenue beat the Rs 15,766 crore estimate by about 2.7% and EBITDA was about in line. Reported profit missed the Rs 3,085 crore estimate by about 35%, but the estimates excluded the one-time loss. Adjusted profit was about 2.5% ahead.
What was the Sun Pharma EBITDA margin in Q2 FY27?
EBITDA margin was 29.3%, against 31.3% in Q2 FY26 and 28.9% in Q1 FY27, on the company’s basis of revenue from operations. Pages that show 29.1% are quoting the half-year figure.
Are the Rs 9,161.6 crore EBITDA and $707 million figures for Q2?
No. Rs 9,161.6 crore EBITDA and $707 million of innovative medicines sales are H1 FY27 totals. The Q2 figures are Rs 4,743.9 crore and $356 million. Check whether a page mixes quarter and half-year numbers.
How did Sun Pharma’s innovative medicines business do in Q2 FY27?
Global Innovative Medicines sales were $356 million, up 6.9%, 21.1% of sales, against $351 million (+12.8%) in Q1. Growth slowed in Q2, so check which brands drove it in the filing.
What were Sun Pharma US sales in Q2 FY27?
One report puts US formulation sales at $455 million, down 8.2%. I could not verify it in the filing, so treat it as reported by a single source and check the segment note.
One third-party report says the shares gained in afternoon trade on 30 October 2026. I have not verified the closing move, so check the exchange for closing prices. The earnings call was held at 6:30 PM IST.
Where do I check the official Sun Pharma results?
Open the NSE or BSE announcements for SUNPHARMA or the press release on sunpharma.com. Reports mix quarter and half-year figures and reported and adjusted profit, so use the filing as the final source.
Sources
- Sun Pharma press release, Q2 FY27 results, 30 October 2026
- Sun Pharma press release, Q1 FY27 results
- Upstox, TradingView News (Moneycontrol), News Karnataka, InCred Money, Free Press Journal, NiftyTrader and Multibagg reports (secondary, not linked)
Editorial disclosure. PositionalCalls.com is not a SEBI-registered research analyst or investment adviser. Investments in securities markets are subject to market risks. Read all related documents carefully before investing. Returns are never guaranteed. This page is educational, is independent and was written by Shubham Chaudhary, founder of PositionalCalls. How I researched this: I compared the company press release as carried in search results with news reports, reconciled quarter and half-year figures, recomputed every derived number and labelled conflicting figures. Corrections are published in the Data note.

Shubham Chaudhary is the founder of PositionalCalls, an independent Indian stock market research website. He writes company fundamentals, quarterly results analysis, IPO analysis and sector research for NSE and BSE listed companies, with a focus on banking stocks, insurance and long-term value investing. Every article is built from primary sources such as RBI, SEBI, NSE and BSE filings and company annual reports, and states its risks plainly in simple language for retail investors.
Coverage areas Our research standards- Numbers checked against NSE, BSE and SEBI filings
- Risks and limits stated in every article
- No paid promotions or broker tie-ups
- Articles updated when new filings arrive