

PositionalCalls • Quarterly Results Preview • FY27
Reliance Q2 Results FY27: Date, Expectations and the Numbers That Will Decide the September Quarter
The Reliance Q2 results FY27 land in the middle of the biggest IPO India has seen. Jio Platforms is raising ₹30,213 crore, the oil business is still the profit anchor, and retail is fighting a quick-commerce era. Here is what to read first when the numbers arrive.
Editorial verification note: This is a pre-results research preview. Figures are drawn from news reports and broker or aggregator summaries and may differ from Reliance’s own filings in definition or rounding. Items marked “verify” rest on a single secondary source. Reconcile every number with the exchange filing before acting. Educational content only, not investment advice.
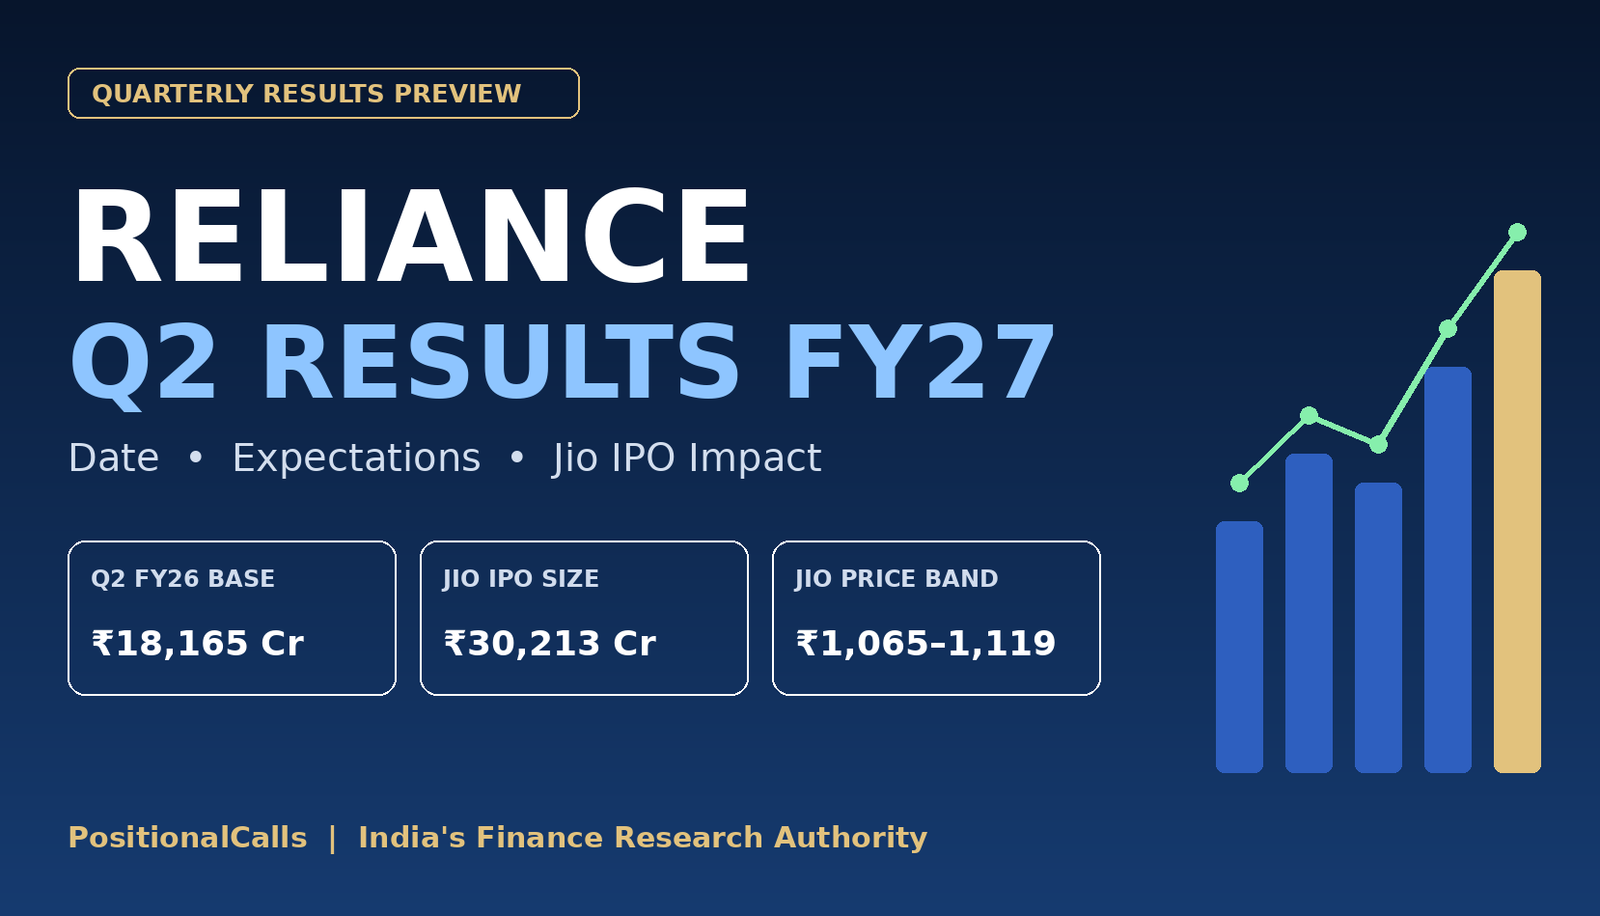
Reliance Q2 Results FY27 at a Glance
Reliance Industries is India’s most valuable listed company and one of its most complicated to read. A single quarterly print mixes a global refining and petrochemicals business, the country’s largest mobile network, the largest retailer and a young clean-energy build-out. That is why the Reliance Q2 results FY27 are rarely about one headline number. They are about which of the engines carried the quarter and whether the mix is improving.
This quarter has an extra layer. Jio Platforms, the digital arm, opened its ₹30,213 crore IPO on 21 October and the bidding closes today. Our separate note on the Jio Platforms IPO GMP today covers listing-day sentiment. This article focuses on the parent’s earnings and what they say about the business behind that listing.
| Reference point | Figure | Why it matters for the Reliance Q2 results FY27 |
|---|---|---|
| Q2 FY26 net profit | ₹18,165 crore | The year-ago base; the year-on-year headline will be measured against it |
| Q2 FY26 Reliance Retail net profit | ₹3,457 crore (+22%) | Shows the retail growth rate the new quarter must match |
| Q2 FY26 Jio net profit | ₹7,379 crore (+13%) | Baseline for telecom profit growth |
| Q1 FY27 Jio Platforms profit | ₹7,764 crore (+9.2%) | Latest quarter before the IPO documents were finalised |
| Q1 FY27 O2C EBITDA margin | 8.4% (verify) | The segment most sensitive to refining and petrochemical cycles |
| Q1 FY27 Jio ARPU | ₹215.6 (verify) | Pricing power and subscriber mix in one number |
| Q1 FY27 retail EBITDA margin | 7.9% (verify) | Tests whether scale is converting into margin |
| Q1 FY27 net debt | ₹1,22,914 crore (verify) | Balance-sheet health ahead of Jio’s debt prepayment |
Net profit, EBITDA, revenue and profit after tax including associates are different measures. Outlets reported Q2 FY26 EBITDA growth and margin with different definitions, so use Reliance’s own press release and analyst presentation as the final reference.
1. When Will the Reliance Q2 Results FY27 Be Announced?
Reliance reports consolidated and standalone unaudited results after a board meeting, followed by an analyst call. Under stock-exchange rules it intimates the meeting date in advance through a filing on NSE and BSE. In the sources reviewed on 23 October 2026, a confirmed date for the Q2 FY27 board meeting was not available, so readers should treat any date quoted on social media as unverified until the filing appears.
The historical pattern gives a rough guide to timing. The Q2 FY26 results came on Friday, 17 October 2025. The Q1 FY26 results were announced on 18 July 2025. The Q3 FY26 results followed on Friday, 16 January 2026, and the full-year FY26 results on Friday, 24 April 2026. Reliance has a long habit of reporting on Fridays after market hours, which means the market reaction usually shows up on the following Monday session.
Two practical points follow. First, the trading window for designated persons stays closed until 48 hours after the results, a standard insider-trading control. Second, the company normally publishes the press release, the financial statements and an investor presentation together, so the primary documents are available within hours of the board meeting. Always check the filing under the symbol RELIANCE on NSE and scrip code 500325 on BSE.
2. The Q2 FY26 Base: What the New Quarter Must Beat
Every year-on-year comparison in the Reliance Q2 results FY27 will use the September 2025 quarter as its base. That quarter was solid rather than spectacular. Consolidated net profit attributable to owners was reported at ₹18,165 crore, about 10% higher than ₹16,563 crore a year earlier. Revenue from operations was reported close to ₹2.59 lakh crore, also up roughly 10%. One outlet put consolidated EBITDA near ₹45,885 crore with a margin around 18%, while another reported a margin of 17.8%, an 80 basis point improvement. The gap reflects definitions and rounding, which is why filings beat summaries.
Within that quarter, Reliance Jio reported net profit of ₹7,379 crore, up 13%, and Reliance Retail Ventures reported net profit of ₹3,457 crore, up 22% from ₹2,836 crore. Those two consumer businesses supplied a large share of the earnings quality, and they are the lines to compare first. If Jio and Retail grow at or above those rates while oil-to-chemicals stays stable, the quarter will read as healthy even if the headline profit moves modestly.
A subtle point about the base: reported profit and profit including the share of associates and joint ventures differ. For Q2 FY26, one source cites profit after tax including associates and JVs at ₹22,092 crore, up 14.3%. When you compare Q2 FY27 numbers, make sure both periods use the same definition, otherwise a clean-looking growth rate can be an apples-to-oranges artefact. The same caution applied when we analysed the profit and revenue definitions in our Eternal Q2 results FY27 analysis.
3. Where Q1 FY27 Left the Story
A preview published ahead of the quarter cites Reliance’s Q1 FY27 consolidated net profit at ₹20,946 crore. That figure, together with the segment markers in the table above, forms the sequential reference: Q2 is compared with Q1 as well as with the year-ago quarter. Treat those Q1 FY27 markers as “verify” items, since they come from one secondary source, but they are useful anchors. They include an oil-to-chemicals EBITDA margin of 8.4%, a Jio ARPU of ₹215.6, a retail EBITDA margin of 7.9% and net debt of about ₹1,22,914 crore.
For the digital arm, the Q1 FY27 consolidated profit of Jio Platforms was reported at ₹7,764 crore, up 9.2% year on year. That growth rate is slower than the 13% Jio posted a year earlier, which is the context for the market debate: Jio has scale and cash generation, but its profit growth is maturing. Investors in the IPO are therefore paying for the next leg, which is broadband, enterprise, cloud and AI-linked services, rather than for the pace of past mobile growth.
The sequential comparison also matters for seasonality. Refining margins, festive-season retail demand and telecom subscriber additions all move through the year. The right habit is to look at three comparisons together: against the year-ago quarter, against Q1 FY27 and against the trailing four-quarter average. A quarter that beats on only one of the three deserves a more cautious reading.
4. Oil-to-Chemicals: The Swing Factor in the Reliance Q2 Results FY27
Oil-to-chemicals, or O2C, still generates a large share of Reliance’s operating profit, and it is the segment where outcomes can surprise either way. The business covers refining, petrochemicals and fuel retailing. Its profit depends on gross refining margins (GRM), which are the spread between crude cost and the value of refined products, and on petrochemical spreads for products such as polymers and polyester intermediates.
What to read in the filing: first, the segment EBITDA and the EBITDA margin compared with the 8.4% cited for Q1 FY27 (verify). A rising margin on stable throughput points to better spreads or a better product slate. A rising EBITDA on a falling margin can simply reflect higher prices rather than better economics. Second, the management commentary on crude sourcing, since Reliance buys from a wide mix of suppliers and the discount or premium on those barrels affects the margin. Third, planned or unplanned maintenance shutdowns, which can lower throughput in one quarter and lift it in the next.
Fuel retailing deserves a separate look. Reliance’s fuel marketing business, run with its retail petrol outlets, is exposed to pricing policy and marketing margins. Stable retail fuel prices when crude is volatile can squeeze or expand marketing margins. The segment disclosure usually explains this in a sentence or two, and that sentence often tells you more than the number.
Why does this matter more than the headline? Because O2C earnings are cyclical, while Jio and Retail are structural. If the quarter’s profit growth came mostly from O2C, the market tends to give it less weight than growth from consumer businesses. If growth came from Jio and Retail while O2C was flat, the quality of the earnings mix improves. Reliance’s long-term story depends on that mix continuing to tilt toward consumer and new-energy earnings.
5. Jio Platforms, ARPU and the IPO
What the IPO actually is
Jio Platforms filed its draft red herring prospectus with SEBI on 19 June 2026 and received the regulator’s observation letter on 28 August 2026. The issue opened for subscription on Wednesday, 21 October 2026 and closes on Friday, 23 October. Allotment is expected around 26 October and listing on NSE and BSE on 28 October, subject to completion of formalities. The final price band is ₹1,065 to ₹1,119 per share with a minimum lot of 12 shares. Earlier press reports mentioned a higher band of ₹1,150 to ₹1,220 and a ₹37,700 crore size; those were pre-announcement estimates and were superseded by the offer document.
The issue is a fresh issue of up to ₹30,213 crore, with no shares sold by existing shareholders. According to the offer details, a primary use of proceeds is the prepayment of borrowings of the material subsidiary Reliance Jio Infocomm. Reliance Industries held about 66.43% of Jio Platforms before the issue, and Meta’s affiliate held roughly 10%. At the top of the band, press reports estimate a market capitalisation of about ₹10.3 lakh crore, based on roughly 921 crore shares outstanding.
Demand signals so far
The anchor book of ₹8,110 crore, priced at the top of the band, reportedly drew institutional demand of more than ₹2.5 lakh crore, over 30 times the amount on offer. On day one, the issue was fully subscribed within about 100 minutes of opening and finished the day at roughly three times, with qualified institutional buyers bidding far above their quota and retail demand initially lagging. Final subscription numbers are only known after the close today, and different outlets rounded the day-one figures differently, so check the BSE and NSE subscription pages for the final tally.
Subscription is a demand indicator, not a quality certificate. Our existing explainer on the Jio Platforms IPO and its GMP discusses why the grey market premium is an unofficial sentiment gauge. For the parent company’s earnings, the more useful question is what a listed Jio changes.
What a listed Jio changes for Reliance earnings
Jio Platforms is already a consolidated subsidiary, so its profits are already inside the Reliance numbers. The IPO does not add revenue overnight. It changes three things. First, it gives the market a daily price for the digital business, which makes sum-of-the-parts valuation of Reliance more transparent. Second, if the proceeds repay debt, interest costs fall over time, which supports consolidated profit. Third, Reliance’s ownership falls from about 66% as new shares are issued, so the minority interest line in consolidated results may grow as a share of profit. Check the “profit attributable to owners” line against “profit for the period” for that effect.
ARPU and subscribers: the two numbers to track
Average revenue per user is the cleanest indicator of telecom pricing. A Q1 FY27 ARPU of ₹215.6 (verify) gives the reference. Brokerages tracking the sector had assumed ARPU growth in the low single digits per quarter in recent years, driven by subscriber migration to higher plans and tariff changes. Watch whether ARPU rises through mix improvement alone or whether a tariff action is feeding it. Watch the subscriber base too: press coverage around the IPO cites roughly 524 million customers at 31 March 2026 for Reliance Jio Infocomm and about 533 million in later commentary. Net additions, 5G share of traffic and fixed wireless or fibre additions show whether growth is broadening.
Analysts at Motilal Oswal have noted Jio’s subscriber base as a strong foundation, while cautioning that newer digital services have yet to show they can make money at scale. That is the right framing for the quarter: the results will confirm the cash engine, but the IPO valuation depends on proof of the next engines.
6. Reliance Retail and the Quick-Commerce Question
Reliance Retail is the largest retailer in India by many measures, with a wide spread across grocery, fashion, consumer electronics and its digital commerce platform. In Q2 FY26 its net profit rose 22% to ₹3,457 crore. A Q1 FY27 EBITDA margin of 7.9% (verify) is the sequential marker. In the Reliance Q2 results FY27 the retail segment will be tested on three fronts.
First, festive demand. The September quarter includes the early build-up to the festive season, so inventory build, promotional intensity and mix between grocery, fashion and electronics can move margins. Second, store additions and productivity. A rising store count with falling revenue per square foot is a weaker signal than a modest store count with improving throughput. Third, the digital and quick-delivery layer, where competition has intensified.
That third point links this report to a wider industry story. In our analysis of Eternal’s Q2 FY27 results, Blinkit’s network had grown to roughly 2,751 stores, per the draft figures reviewed there, with expansion targets above 3,500. Quick-commerce players are building dense neighbourhood networks, which pressures traditional modern trade and organised grocery formats. Reliance has its own answer in its digital commerce and fast-delivery offerings, but the cost of competing is visible in margins and customer-acquisition spend. When reading the retail segment, look for management comments on delivery speed, dark-store counts, loss-making initiatives and the proportion of revenue from digital channels.
Finally, check the retail EBITDA margin trend against the base. Margin discipline matters more than headline revenue in a year when peers are subsidising growth. A stable or rising margin while revenue grows would suggest that scale is working; a falling margin with rising revenue would suggest that the competitive price of growth is rising.
7. New Energy, Oil and Gas
The new-energy business covers solar manufacturing, battery and storage plans, green hydrogen and related infrastructure at Reliance’s Jamnagar complex and other sites. In most quarters it contributes little to profit and a lot to capital expenditure, so the useful metrics are project progress and spending rather than earnings. Look for commissioning milestones for module and cell lines, battery-cell timelines and any partnership or offtake announcements. Delays or cost overruns here matter because they affect capex and the timing of future returns.
Oil and gas, which includes the KG-D6 basin and the coal-bed methane assets, is smaller but offers a clean read on production and realisations. Gas price policy and field decline rates drive the result. A year-on-year dip in this segment, such as the one analysts had assumed in the Q2 FY26 preview, can be absorbed when the consumer businesses grow. Note the production volumes and the realised price per unit of gas, since those two numbers explain nearly the entire change.
The key analytical point is allocation. Each rupee spent on new energy is a rupee not used to reduce debt or fund retail. Management usually explains this trade-off in the analyst call, so reading the call summary alongside the filing is worthwhile.
8. Net Debt, Cash Flow and Capital Expenditure
Reliance runs large capital programmes, so the balance sheet is a standing part of every quarter. The Q1 FY27 net debt of about ₹1,22,914 crore (verify) is the marker. Compare it with the quarter-end figure in the new release, but also read the composition: how much is gross debt, how much cash and equivalents, and how much of the borrowing sits in Reliance Jio Infocomm, where the IPO proceeds are earmarked.
The Jio fresh issue will show up in the next reporting period rather than in the quarter that ended on 30 September, because the money is raised in October. So the Reliance Q2 results FY27 will not yet show the deleveraging. What the quarter can show is management’s guidance on how the proceeds will be used, the interest cost trend and the expected effect on the debt profile. That makes forward commentary more informative than the debt figure itself this time.
Three cash-flow checks are worth the effort. Operating cash flow versus EBITDA tells you how much profit converts to cash. Capital expenditure versus depreciation shows whether the group is still in heavy build mode. Finally, working-capital movements in retail and O2C, such as inventory and payables, can swing quarterly cash even when profit is steady. A company can report rising profit and falling free cash flow in the same quarter, so look at both.
The finance-cost line also deserves attention. Interest expense and depreciation have been rising with large projects commissioned in telecom, retail and energy. A quarter in which EBITDA grows faster than depreciation and interest is a quarter in which operating leverage is working. A quarter where those lines grow faster than EBITDA can dilute profit even when operations look strong.
9. Three Ways the Reliance Q2 Results FY27 Could Read
Instead of guessing a number, a more reliable approach is to define in advance what each plausible outcome would mean. No verified consensus estimate for the quarter was available in the sources we reviewed, so these are qualitative frameworks rather than forecasts.
| Scenario | What the filing would show | How investors may interpret it |
|---|---|---|
| Consumer-led growth | Jio and Retail profit growth at or above the Q2 FY26 rates (13% and 22%); O2C flat or modestly higher; stable margins | Earnings mix improves; supports the view that Jio’s IPO valuation is backed by cash generation |
| O2C-led growth | Headline profit up mainly on refining and petrochemical spreads; Jio and Retail growth slower than a year ago | Profit is higher but more cyclical; market may treat the beat as lower quality |
| Margin squeeze | Revenue grows but retail margin falls, ARPU stalls or finance costs rise faster than EBITDA | Growth is costing more; focus shifts to management commentary on pricing and capex discipline |
Which scenario unfolds will also colour how the stock behaves around the Jio listing on 28 October. A strong consumer-led print could reinforce the narrative of a re-rating for the group, while a margin squeeze would put more weight on the argument that the IPO valuation already assumes a lot. Neither outcome is certain, and the market’s reaction can differ from the quality of the numbers, as we noted in discussing why Eternal’s profit growth met a muted response in our Eternal results review.
Valuation context without a price target
Valuing a conglomerate means valuing its parts. Analysts commonly use enterprise value to EBITDA for O2C and retail, a subscriber or ARPU-based multiple for telecom, and book or invested capital for new energy. The Jio IPO adds a market-derived marker for one part. At about ₹10.3 lakh crore market capitalisation at the top of the price band, per press reports, the digital business is being valued at a scale comparable to the largest listed companies in India. Whether the parent trades at a premium, discount or in line with the sum of its parts is a matter for current prices, which change daily. This article deliberately does not state a target price.
Compare the P/E ratio of Reliance with its own history and with other large diversified companies rather than with a fixed number. Remember that the denominator, earnings, includes one-off gains and losses in some quarters. A year earlier, the Q1 FY26 profit included a one-time gain from the sale of a stake in another company, which is why year-on-year comparisons for that quarter looked inflated. Always strip out exceptional items before judging trend.
10. Reliance Q2 Results FY27: Results-Day Checklist and Key Risks
Results-day checklist
- ☐ Confirm the board-meeting date and download the consolidated results from NSE or BSE.
- ☐ Compare consolidated net profit and revenue with ₹18,165 crore and about ₹2.59 lakh crore from Q2 FY26.
- ☐ Check EBITDA and EBITDA margin using Reliance’s own definition, and compare with Q1 FY27.
- ☐ Read O2C segment EBITDA, margin, throughput and any shutdown commentary.
- ☐ Check Jio ARPU against ₹215.6, subscriber additions, 5G share and fixed-broadband growth.
- ☐ Check retail EBITDA margin against 7.9% and read the store and digital commentary.
- ☐ Review net debt, finance costs, capex and operating cash flow.
- ☐ Separate profit attributable to owners from profit including minority interest.
- ☐ Note management commentary on the Jio listing, proceeds use and capital allocation.
- ☐ Reassess valuation using the current share price, not older headlines.
Key risks to monitor
Reliance Q2 Results FY27: Verdict
The Reliance Q2 results FY27 are less about a single beat or miss than about the shape of the quarter. The year-ago base of ₹18,165 crore was healthy, the consumer businesses grew at double-digit rates, and the group has spent the year preparing the largest IPO the country has seen. That makes the mix of earnings, the Jio ARPU trend, retail margin discipline and the balance-sheet narrative more informative than the top line.
What would strengthen the bullish reading? Jio and Retail growth at or above last year’s pace, a stable O2C margin and credible guidance on how Jio’s proceeds will lower debt and finance costs. What would weaken it? A quarter in which profit growth depends on cyclical O2C spreads, retail margins fall as competition intensifies, or cash conversion lags profit. None of this is a prediction, and the filings will settle the facts.
Get research-led market updates on WhatsApp
Follow the Positional Calls WhatsApp Channel for company results, IPO developments and sector insights. Channel updates are informational; verify time-sensitive claims against official disclosures.
Frequently asked questions about the Reliance Q2 results FY27
When are the Reliance Q2 results FY27 expected?
As of 23 October 2026 the date was not confirmed in the sources reviewed. Reliance normally announces the board meeting through an exchange filing about a week ahead, so check NSE, BSE and its investor page.
What is the base the Reliance Q2 results FY27 will be compared with?
Q2 FY26 consolidated net profit attributable to owners of ₹18,165 crore, up about 10% from ₹16,563 crore, on revenue of roughly ₹2.59 lakh crore.
Which segments matter most in the Reliance Q2 results FY27?
Oil-to-chemicals margin, Jio ARPU and subscribers, Reliance Retail margin and store additions, new-energy progress and consolidated net debt.
How does the Jio Platforms IPO affect Reliance Industries?
Reliance held about 66.43% of Jio Platforms before the issue. The fresh issue of up to ₹30,213 crore is meant largely to prepay Reliance Jio Infocomm borrowings, which can reduce debt and give the market a listed valuation for Jio. The money arrives after the September quarter, so it will not appear in the Q2 numbers.
What is the Jio Platforms IPO price band and listing date?
The price band is ₹1,065 to ₹1,119 per share with a lot of 12 shares. Bidding closes on 23 October and listing is expected on 28 October 2026, subject to completion of formalities.
What was Jio’s ARPU in the latest quarter?
A Q1 FY27 preview cites ₹215.6 per user per month. Verify against Reliance Jio’s filing, since ARPU definitions and rounding differ across sources.
Is Reliance a buy before its Q2 results?
This article makes no buy or sell recommendation. Review the filing, current valuation, risks and your own circumstances, or consult a SEBI-registered adviser.
Where can I verify the numbers?
Use the unaudited consolidated results on NSE and BSE, Reliance’s press release and its analyst presentation on the investor relations page.
Sources and verification
Use Reliance’s own filings as the primary verification point. Secondary reports help with context but should not replace the exchange filing.
- Reliance Industries — investor relations and results
- Univest — Reliance Q2 results FY27 preview (Q1 FY27 markers, verify)
- Upstox — Reliance Q2 FY26 earnings coverage
- Torus Digital — Reliance Q2 FY26 results summary
- Inc42 — Jio Platforms IPO subscription and Q1 FY27 profit
- Groww — Jio Platforms IPO details and timeline
- Asianet Newsable — Jio IPO day-one subscription and anchor demand
- OneIndia — Jio IPO market capitalisation and shareholding
- Angel One — pre-announcement Jio IPO estimates
Editorial disclosure: This article is for informational and educational purposes only. It is not investment advice, a recommendation or a guarantee of returns. Investments are subject to market risks. Figures must be reconciled with official filings before publication or use.
Shubham tracks Indian equity markets with a focus on banking stocks, insurance companies, and long-term value investing. PositionalCalls was built to give independent investors the same quality of research that institutional desks produce, in plain language, with no brokerage bias and no paid promotions. All analysis is sourced from RBI, SEBI, NSE/BSE filings, and company annual reports.