
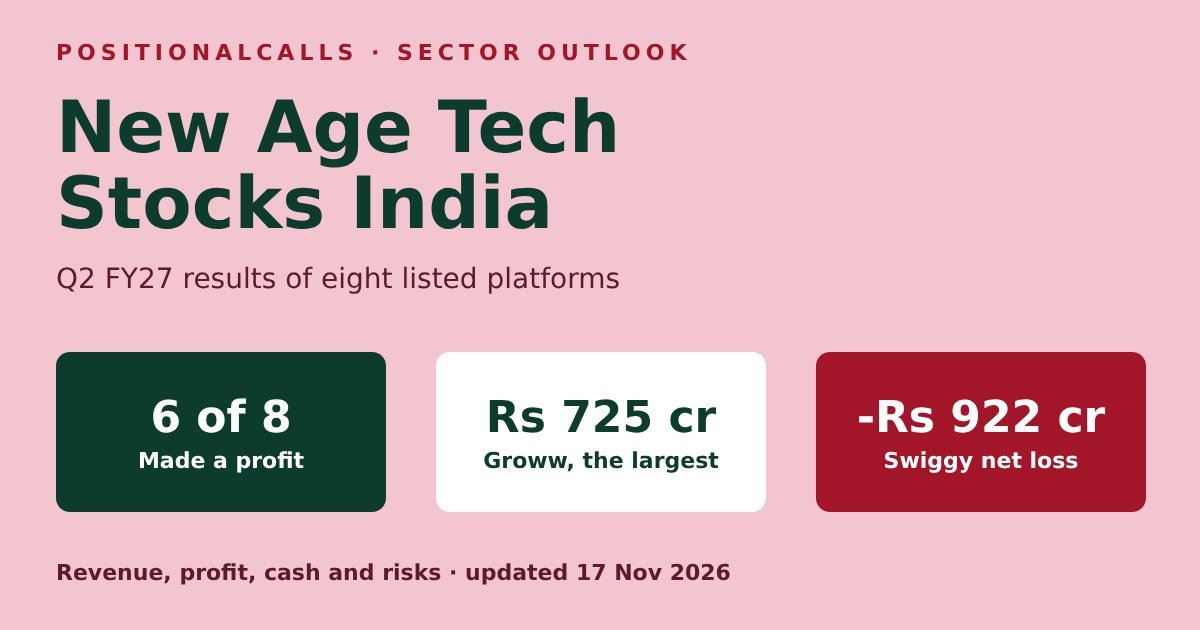
Sector outlook · Internet platforms
This guide to new age tech stocks puts eight listed internet platforms side by side on their Q2 FY27 results: revenue, profit or loss, quick commerce and food delivery economics, cash, dated share-price moves and the source conflicts, with no calls.
Quick answer
New age tech stocks gave a split result in Q2 FY27: six of eight platforms made a profit, led by Groww at Rs 725.65 crore, while Swiggy lost Rs 922 crore and Meesho lost Rs 132.45 crore. Quick commerce spending and festive inventory decided most of the gap.
New age tech stocks: key takeaways
- Profit split: six of eight were profitable, but the eight together earned only Rs 547.24 crore, and the seven without Groww lost Rs 178.41 crore (my calculation).
- Quick commerce: Blinkit earned Rs 184 crore adjusted EBITDA while Instamart lost Rs 895 crore, on a network less than half Blinkit’s size.
- Food delivery: Zomato earned Rs 627 crore and Swiggy a record Rs 341 crore, the steadiest profit pools in the group.
- Cash: Eternal held Rs 16,475 crore and Swiggy Rs 13,662 crore, and both fell in the quarter.
- Reactions: prices moved on expectations, not on growth rates; Swiggy fell as much as 17.23% and Lenskart rose as much as 11.1%.
- Scope: a data review as of 17 November 2026; it contains no subscribe, buy, sell, rating or target calls.
In plain words for new age tech stocks: these are listed companies built around an app or website. Adjusted EBITDA is operating profit after the company removes some costs it calls one-off. GOV is gross order value, the total bill before discounts, and NOV is net order value after discounts. A quick commerce dark store is a small warehouse that delivers groceries within minutes.
Data note: as of Tuesday, 17 November 2026, 1:50 PM IST. Results come from company releases and shareholder letters as reported by Inc42, Kotak Neo, StartupFeed, Investywise, YourStory, Multibagg, Lapaas Voice and JM Financial, all for the quarter ended 30 September 2026. Filings were not opened. Calculations are marked “my calculation”.
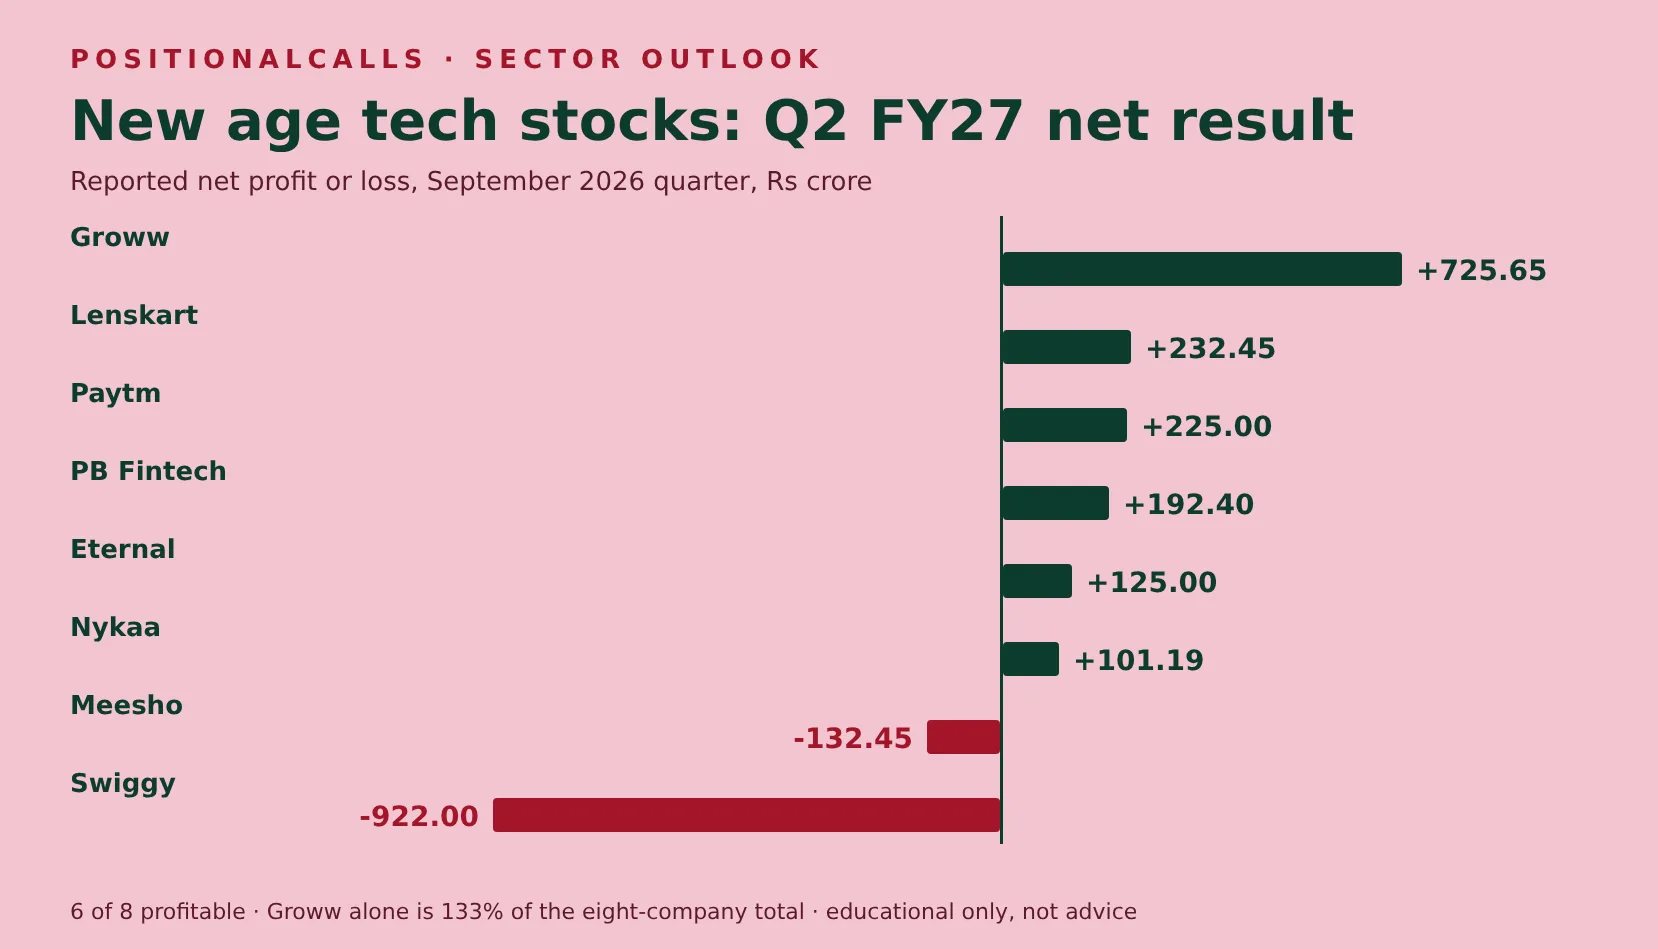 New age tech stocks in one picture: reported net profit or loss for the September 2026 quarter, in Rs crore.
What are the key numbers for new age tech stocks in Q2 FY27?
Six of the eight new age tech stocks in this review reported a profit for the September 2026 quarter, but the group is held up by one company: Groww earned Rs 725.65 crore of the combined Rs 547.24 crore. The table uses revenue from operations and consolidated net profit or loss as reported (my calculations for growth and margin).
| Company | Revenue (Rs crore) | Revenue growth | Net result (Rs crore) | Net margin |
|---|---|---|---|---|
| Eternal (Zomato, Blinkit) | 24,138 | +77.6% | +125 | 0.5% |
| Swiggy | 7,571 | +36.1% | -922 | -12.2% |
| Nykaa (FSN E-Commerce) | 3,006.04 | +28.1% | +101.19 | 3.4% |
| PB Fintech (Policybazaar) | 2,177.7 | +34.9% | +192.4 | 8.8% |
| Paytm (One97) | 2,648 | +28.5% | +225 | 8.5% |
| Lenskart | 2,845.03 | +35.7% | +232.45 | 8.2% |
| Meesho | 4,131.58 | +34.4% | -132.45 | -3.2% |
| Groww (Billionbrains) | 1,501.53 | +47.4% | +725.65 | 48.3% |
| Total of eight | 48,018.88 | not comparable | +547.24 | 1.1% |
Cite this table: PositionalCalls, “Internet Platform Q2 FY27 Results, as of 17 November 2026”; company results via Inc42, Kotak Neo, Lapaas Voice and Upstox.
Revenue is not like for like. Eternal’s Blinkit books product sales, Swiggy’s Instamart books mostly fees, and Groww and PB Fintech earn commissions, so a larger revenue figure does not mean a larger business. Net margin is the cleaner column: from 48.3% at Groww to a loss of 12.2% at Swiggy.
Which companies count as new age tech stocks here?
This page uses “new age tech stocks” for listed Indian internet platforms that came to market after 2020 or that rebuilt themselves as app businesses, and it covers eight of them. The group is a media label, not an index or an official sector, so any list is a choice.
The eight are Eternal, Swiggy, Nykaa, PB Fintech, Paytm, Lenskart, Meesho and Groww. They share a few traits: they grew revenue by 28% to 78% in the quarter, they spend on customer acquisition, and each has a different way of making money, from delivery fees to broking charges.
Others could sit in the same group. YourStory reported that PhysicsWallah posted a Rs 1,242 crore top line and doubled its profit in the same quarter, and I did not research it or other listed platforms for this version. Leaving a name out is a limit of my time and sources, not a view on the company.
The sector matters to consumers as much as investors. These platforms decide how groceries, meals, glasses, make-up and investment accounts are sold. For the demand side, see the consumption sector outlook. This page stays with company results.
How do these platforms make money?
The eight platforms earn in very different ways, which is why revenue and margin cannot be compared across the group without a caveat. The table lists the main revenue lines named in the Q2 FY27 coverage and the cost that most often explains the margin.
| Company | Main revenue lines | Cost that drives the margin |
|---|---|---|
| Eternal | Food delivery, Blinkit product sales, District tickets, Hyperpure supplies | Dark stores, inventory and riders |
| Swiggy | Food delivery, Instamart fees, Dineout | Instamart stores and discounts |
| Nykaa | Beauty and fashion retail, marketplace and own brands | Inventory and marketing |
| PB Fintech | Insurance commissions on Policybazaar, credit fees on Paisabazaar | Customer acquisition and renewals |
| Paytm | Merchant payments, financial-services distribution (Rs 912 crore, +49%) | Incentives and payment rules |
| Lenskart | Eyewear sold in stores and online, in-house manufacturing | Store rent and factory capacity |
| Meesho | Zero-commission marketplace; mix covered in the Meesho IPO review | Logistics and user growth |
| Groww | Broking, margin trading, commodity derivatives, wealth products | Derivatives volumes and lending capital |
Cite this table: PositionalCalls, “How the platforms earn, Q2 FY27”; StartupFeed, Swiggy corporate release, Multibagg, Lapaas Voice and Finology.
A platform that holds inventory carries stock risk, one that lends carries credit risk, and one that earns on trading carries volume risk. That is why a small profit at Nykaa and a large profit at Groww are different kinds of numbers.
How are the listed platforms doing in quick commerce?
Quick commerce is the biggest swing factor among new age tech stocks: Blinkit earned Rs 184 crore of adjusted EBITDA in Q2 FY27 while Instamart lost Rs 895 crore. Eternal reported that Blinkit added 308 net stores to reach 2,751, and Swiggy reported 69 net additions to reach 1,240 Instamart stores across 133 cities.
| Metric (Q2 FY27) | Blinkit (Eternal) | Instamart (Swiggy) |
|---|---|---|
| Dark stores | 2,751 (+308 in the quarter) | 1,240 (+69 in the quarter) |
| Order value | NOV Rs 20,940 crore, +79.3% YoY | GOV Rs 9,230 crore, +31% YoY; NOV Rs 6,594 crore |
| Adjusted revenue or operating revenue | Rs 19,152 crore | Rs 1,306 crore, +33% YoY |
| Adjusted EBITDA | +Rs 184 crore | -Rs 895 crore (-9.7% of GOV, my calculation) |
| Contribution margin | not stated in my sources | -1.0% of GOV |
| Store target | 3,500 by March 2027; about 5,000 by March 2028 | not stated in my sources |
Cite this table: PositionalCalls, “Blinkit and Instamart, Q2 FY27”; StartupFeed, Inc42, Kotak Neo, Yourstory, Investywise; company shareholder letters as reported.
What does the quick commerce gap show?
Blinkit’s network is 2.2 times Instamart’s (my calculation), and its order value is about 3.2 times larger using Inc42’s Instamart NOV (my calculation). Blinkit’s revenue looks huge because it books product sales, while Instamart’s Rs 1,306 crore reflects its fee model, so the revenue lines should not be compared.
Swiggy says Instamart’s adjusted EBITDA loss peaked in Q2 and guides to double-digit sequential NOV growth in Q3 with about 100 basis points of margin improvement, per Inc42. That is a company statement. Blinkit needs 749 more stores to reach 3,500 by March 2027, about 375 a quarter (my calculation), against 308 added in Q2.
How is food delivery doing at Zomato and Swiggy?
Food delivery is the steadiest profit pool among new age tech stocks: Zomato earned Rs 627 crore of adjusted EBITDA and Swiggy a record Rs 341 crore in Q2 FY27. Together that is Rs 968 crore (my calculation), against a combined quick commerce adjusted EBITDA of minus Rs 711 crore for Blinkit and Instamart (my calculation).
| Metric (Q2 FY27) | Zomato (Eternal) | Swiggy food delivery |
|---|---|---|
| Order value | NOV Rs 11,445 crore, +21.5% YoY | GOV Rs 10,054 crore, +17.7% YoY |
| Adjusted EBITDA | Rs 627 crore | Rs 341 crore, record |
| Margin | 5.5% of NOV (my calculation) | 3.4% of GOV, from 2.8% a year earlier |
| Change from Q1 FY27 | NOV +6.3%, EBITDA +3.5% (my calculation) | GOV +5.9%, EBITDA +16.8% (my calculation) |
| Customers | 28.0 million monthly transacting, +16% | not stated in my sources |
| Other Eternal segments | District: -Rs 64 crore; Hyperpure: Rs 10 crore | Dineout target: Rs 1,000 crore adjusted EBITDA by FY31 (company) |
Cite this table: PositionalCalls, “Food delivery, Q2 FY27”; StartupFeed, Kotak Neo, Inc42 and Investywise; Swiggy corporate release of August 2026.
The margins are not like for like because Eternal reports on net order value and Swiggy on gross order value. Even so, both delivery arms are profitable at the segment level, and Swiggy attributes its gain to advertising income, delivery efficiency and operating leverage, per Inc42.
For the two listed delivery leaders together, adjusted EBITDA was Eternal’s Rs 666 crore plus Swiggy’s minus Rs 760 crore, or minus Rs 94 crore (my calculation). The sum mixes two companies’ definitions, but it shows that the profit from meals is being spent on groceries. Eternal’s Q1 FY27 food delivery NOV was Rs 10,769 crore, which gives the sequential comparison above.
What do Meesho, Nykaa and Lenskart show about consumer platforms?
The three consumer platforms grew revenue 28% to 36% in Q2 FY27, but only Nykaa and Lenskart made a profit, with Meesho still losing Rs 132.45 crore. They sell physical goods, so margins depend on sourcing, returns and store or logistics costs.
| Metric (Q2 FY27) | Meesho | Nykaa | Lenskart |
|---|---|---|---|
| Revenue | Rs 4,131.58 crore, +34.4% | Rs 3,006.04 crore, +28.1% | Rs 2,845.03 crore, +35.7% |
| Net result | Loss Rs 132.45 crore, from Rs 411.36 crore | Profit Rs 101.19 crore, +206.8% | Profit Rs 232.45 crore, +124.7% |
| Operating profit measure | Contribution margin 6.0% of NMV | EBITDA Rs 262.56 crore, 8.7% of revenue | EBITDA Rs 624 crore, 21.9% (my calculation) |
| Volume measure | NMV growth 23% (Upstox headline) | GMV Rs 6,151 crore, +30% | India same-store sales +20.8% |
| Next growth lever | Orders and festive sales | Quick commerce in 15 cities, 25+ targeted by FY27 end | India revenue Rs 1,667.9 crore, +35.5% |
Cite this table: PositionalCalls, “Marketplace and retail, Q2 FY27”; Upstox, Kotak Neo, Inc42, Multibagg, Business Today and Investywise.
Meesho’s loss narrowed 67.8% (my calculation), but it is still the only one of the three below breakeven. Details are in the Meesho IPO review. Nykaa’s profit more than tripled on a small base, and its quarter is covered in Nykaa Q2 FY27.
Lenskart’s numbers carry a basis warning. Its pro forma revenue growth is 32.5% and pro forma profit growth 106.1%, while statutory growth is 35.7% and 124.7%. See Lenskart Q2 FY27 and the source conflicts below. Both bases are real, so state which one you use when comparing these new age tech stocks.
How are the fintech and wealth platforms doing?
Paytm, PB Fintech and Groww all made a profit in Q2 FY27, and Groww’s Rs 725.65 crore at a 48.3% net margin is the strongest in the group. These businesses earn fees and commissions, so they carry less inventory risk but more rule risk.
| Metric (Q2 FY27) | Paytm | PB Fintech | Groww |
|---|---|---|---|
| Revenue | Rs 2,648 crore, +28% | Rs 2,177.7 crore, +35% | Rs 1,501.53 crore, +47.4% |
| Net profit | Rs 225 crore (Rs 21 crore a year earlier) | Rs 192.4 crore, +42.5% | Rs 725.65 crore, +54.0% |
| Versus Q1 FY27 | Profit +2.3% from Rs 220 crore (my calculation) | Profit +18.1% from Rs 162.91 crore (my calculation) | Profit -1.3% from Rs 735.04 crore (my calculation) |
| Operating profit | EBITDA Rs 270 crore, margin 10% | Adjusted EBITDA Rs 216 crore, +39% | EBITDA about Rs 968 crore, 64.5% |
| Scale measure | 8.5 crore monthly transacting users | Premium Rs 9,385 crore, +38% | Revenue flat on Q1; derivatives under pressure |
| Cash | Rs 13,617 crore | not stated in my sources | not stated in my sources |
Cite this table: PositionalCalls, “Fintech and wealth platforms, Q2 FY27”; Inc42, Lapaas Voice, Trak, Multibagg, StartupFeed, JM Financial and Kotak Neo.
Paytm’s tenfold profit headline compares with a depressed Rs 21 crore base in Q2 FY26, and its profit rose only 2.3% from the previous quarter. Its half-year profit of Rs 445 crore compares with Rs 144 crore a year earlier. See Paytm Q2 FY27.
PB Fintech’s premium is about 4.3 times its revenue (my calculation), which shows how much of the money passes through to insurers. For the insurers on the other side, see insurance stocks in India. Groww’s revenue was flat on Q1 and CNBC-TV18 said equity derivatives remained under pressure, so even the most profitable of these platforms is sensitive to trading volumes. See the Groww IPO analysis.
How good is the profit of new age tech stocks?
The profit figures are not like for like, because adjusted EBITDA, reported EBITDA, contribution margin and net profit each leave out different costs. A reader who compares them directly can reach the wrong conclusion about new age tech stocks.
PositionalCalls WhatsApp channel
Get sector outlook updates on WhatsApp
- Quarterly results, dated
- Plain-English sector explainers
- Links to updated outlook pages
How profit differs across new age tech stocks
Eternal shows reported EBITDA of Rs 752 crore and adjusted EBITDA of Rs 666 crore, per Finology and Inc42, yet net profit of only Rs 125 crore after depreciation Rs 249 crore higher than a year earlier, per Craytheon’s profit bridge, and tax. Finology reports that the profit missed analyst expectations because delivery, employee and depreciation costs rose.
Swiggy’s adjusted EBITDA loss of Rs 760 crore compares with a net loss of Rs 922 crore, a gap of Rs 162 crore (my calculation). Paytm reports Rs 229 crore before exceptional items against Rs 225 crore after them. Nykaa, Lenskart and PB Fintech report PAT margins of about 3% to 9%, so small cost changes move their profit a lot.
A simple test applies to every company on this page: does net profit rise when revenue rises? Groww passes it with a 48.3% net margin. Eternal does not yet, at 0.5% of revenue.
What mistakes do readers make with these results?
Most errors come from comparing numbers that were built differently. These are the ones that the quarter’s coverage invites.
- Comparing revenue across models: Blinkit’s Rs 19,152 crore and Instamart’s Rs 1,306 crore reflect different accounting, not a 15-fold gap in size.
- Treating adjusted EBITDA as profit: Swiggy’s Rs 760 crore adjusted loss is smaller than its Rs 922 crore net loss.
- Quoting a multiple without its base: Paytm’s tenfold profit rise starts from Rs 21 crore, and its profit grew 2.3% on the previous quarter.
- Using an intraday high as the price: Lenskart’s Rs 767.4 was a peak, not a close.
- Repeating brokerage targets: they change within days and I do not reproduce them.
Reading the quarter in this order reduces the risk: net result, then cash, then the segment loss, then the company’s own next-quarter guidance.
How much cash do the big platforms hold?
Four of the eight report cash of at least Rs 7,000 crore in my sources, a combined Rs 50,802 crore, but the two largest balances both fell in Q2 FY27. Cash is the cushion that lets loss-making platforms keep spending.
| Company | Cash, end of September 2026 | Change in the quarter | Stated reason |
|---|---|---|---|
| Eternal | Rs 16,475 crore | -Rs 1,813 crore | Festive inventory at Blinkit; weekly restaurant settlement timing |
| Swiggy | Rs 13,662 crore | -Rs 705 crore | Losses and investment in Instamart |
| Paytm | Rs 13,617 crore | not stated in my sources | not stated |
| Meesho | Rs 7,048 crore | not stated in my sources | not stated |
Cite this table: PositionalCalls, “Cash balances, Q2 FY27”; Investywise, Inc42, Lapaas Voice, Upstox and Kotak Neo.
As arithmetic only, Swiggy’s Rs 13,662 crore equals about 18 quarters of its Rs 760 crore adjusted EBITDA loss (my calculation). It ignores capex, working capital and any change in the loss, so it is not a forecast. Eternal’s Rs 1,813 crore fall was largely seasonal, according to the company.
The cash balances are the reason that quick commerce competition can last. If one platform cuts spending, the others get room, and if all of them spend, losses continue. That is a structure, not a prediction.
How did new age tech stocks react to their Q2 FY27 results?
Share-price reactions to the same quarter ranged from a 17.23% intraday fall at Swiggy to an 11.1% intraday rise at Lenskart, so growth rates alone did not set the direction. The table lists only moves that a named source dated, and it leaves a cell blank where I found none.
| Company | Results date | Reported price move | Note |
|---|---|---|---|
| Groww | 14 Oct 2026 | -0.82% to Rs 192.22 on NSE, intraday (JM Financial) | Profit +54.0%; up 92.2% on the Rs 100 issue price (my calculation) |
| Eternal | 21 Oct 2026, after hours | Session before results: -2.45% to Rs 312.35 or -3.5% to Rs 308.80 | Profit missed estimates, per Finology; next-day close not found |
| Swiggy | 22 Oct 2026 | Down as much as 17.23% to Rs 174.90 on 23 Oct (Inc42) | Implied prior close about Rs 211.31 (my calculation); Ventura says nearly 14% |
| Paytm | 26 Oct 2026 | not found | Sixth or fifth profitable quarter, sources differ |
| Meesho | Q2 FY27 | Rs 227.84 close on 28 Oct 2026 (Kotak Neo) | Up 105% on the Rs 111 issue price (my calculation) |
| PB Fintech | 30 Oct 2026 | not found | Profit up for eight quarters in a row, per Sovrenn |
| Nykaa | 4 Nov 2026 | +0.31% to Rs 355.10 on 4 Nov, before results (Business Today) | Inc42 reports a 6% rise on a business update earlier in the quarter |
| Lenskart | 4 Nov 2026 | Up as much as 11.1% to Rs 767.4 on 5 Nov (Inc42) | DSIJ reports 8%; the high was an all-time high |
Cite this table: PositionalCalls, “Result-day price moves, Q2 FY27”; JM Financial, Outlook Business, Inc42, Kotak Neo, Business Today and DSIJ.
Intraday highs and lows are not closing prices, and the quarter’s reactions came on different days, so no ranking is fair. The point for readers of new age tech stocks is narrower: Swiggy’s loss narrowed year on year yet the shares hit a 52-week low, because the loss widened from the previous quarter and Instamart’s widened. Brokerage targets were cut at the time, per Inc42, and I do not reproduce them.
What does the valuation arithmetic show?
On dated market values, the three platforms where I found a market value traded at 5.3 to 8.4 times annualised Q2 revenue, but revenue multiples ignore profit and so cannot compare companies with different margins. Annualised here means Q2 revenue multiplied by four, which ignores seasonality and is only a yardstick.
| Company | Dated market value | Annualised Q2 revenue | Multiple (my calculation) | Net margin in Q2 |
|---|---|---|---|---|
| Nykaa | Rs 1.01 lakh crore (4 Nov 2026, Business Today) | Rs 12,024 crore | 8.4x | 3.4% |
| Meesho | Rs 105,456 crore (28 Oct 2026, NewsBytes) | Rs 16,526 crore | 6.4x | -3.2% |
| PB Fintech | Rs 46,300 crore (30 Oct 2026, Arthneeti tracker) | Rs 8,711 crore | 5.3x | 8.8% |
Cite this table: PositionalCalls, “Revenue multiples, Q2 FY27”; Business Today, NewsBytes, Arthneeti and company results.
A lower multiple does not make a business cheaper and a higher one does not make it dearer, because Meesho’s revenue converts to a loss while PB Fintech’s converts to a profit. Market values move daily, and the PB Fintech figure is from a third-party tracker I could not match to an exchange price.
For profitable companies, price against profit would be the usual yardstick, and the Arthneeti page shows a P/E of 61.9 for PB Fintech on 30 October. I do not use it as a conclusion. Whether any figure is high or low depends on growth, risk and what you believe about future profit, none of which this page forecasts.
What are the main risks for new age tech stocks?
The risks that recur across these platforms are cash burn in quick commerce, rule changes, competition for the same customer and supply of shares from early investors. Each has evidence in the quarter’s results.
- Cash burn: Instamart’s Rs 895 crore adjusted EBITDA loss and Swiggy’s Rs 705 crore fall in cash show the cost of chasing Blinkit.
- Rule risk: Business Standard reported in November 2025 that tighter derivatives rules cut Groww’s trading volumes and revenue, and CNBC-TV18 says equity derivatives remain under pressure in Q2 FY27.
- Tax and pricing: in Q2 FY26 Eternal’s finance chief said Zomato passed an extra tax burden to customers, with a slight negative effect on order growth, per Inc42.
- Competition: Blinkit’s network is 2.2 times Instamart’s, and both face new entrants that I did not research.
- Supply of shares: Meesho’s anchor and pre-IPO lock-ins have ended and promoter shares are locked until 9 June 2027, per a third-party summary of a BSE circular.
- Technology: Eternal’s Q4 FY26 shareholder letter devoted space to whether AI assistants could displace apps such as Zomato and Blinkit, per Sahi.
None of these has an outcome I can predict. They are the checks for the Q3 FY27 numbers. A shareholder in new age tech stocks should also read each company’s own risk section, which this page does not replace.
What should readers track in these companies next?
The next hard data point for new age tech stocks is the Q3 FY27 result for the December 2026 quarter, expected in January and February 2027, and each company has one number that tests its own story. The dates are not confirmed, so check each company’s board-meeting notice.
| Company | Number to track | Q2 FY27 reading | What a change would tell you |
|---|---|---|---|
| Eternal | Blinkit adjusted EBITDA as % of NOV | 0.9% | Whether quick commerce scale is turning into margin |
| Swiggy | Instamart adjusted EBITDA loss | Rs 895 crore | Whether the “peaked in Q2” statement holds |
| Nykaa | EBITDA margin | 8.7% | Whether the 196 basis point gain lasts |
| PB Fintech | Total premium growth | +38% to Rs 9,385 crore | Whether insurance demand keeps the margin above 8% |
| Paytm | Profit versus Q1 and exceptional items | Rs 225 crore vs Rs 220 crore | Whether profit grows without one-offs |
| Lenskart | India same-store sales growth | +20.8% | Whether store additions dilute productivity |
| Meesho | Contribution margin as % of NMV | 6.0% | Whether the loss keeps narrowing as users grow |
| Groww | Revenue versus Q1 and derivatives volumes | Rs 1,501.53 crore, flat | Whether diversification offsets derivatives pressure |
Cite this table: PositionalCalls, “Numbers to track, Q2 FY27”; company results as reported by Inc42, StartupFeed, Multibagg, Upstox and Kotak Neo.
Company dates and targets worth noting, all from management statements and not from PositionalCalls: Blinkit targets 3,500 stores by March 2027 and about 5,000 by March 2028, Nykaa targets more than 25 cities for its quick commerce service by the end of FY27, and Swiggy announced in August 2026 a goal of about Rs 10,000 crore adjusted EBITDA by FY31. Management targets are often missed or revised, so treat them as claims to test.
A conditional reading helps without forecasting. If Instamart’s loss falls below Rs 895 crore in Q3, Swiggy’s statement is supported, and if it rises again it is not. If Blinkit’s margin stays near 0.9% while its store count climbs, growth is still costing nearly all of its gross profit. New age tech stocks will keep surprising in both directions, which is why dated data beats stories.
Where do the sources disagree on new age tech stocks?
Several figures for these companies differ between outlets, and I list each so a reader can check the primary filing. In every case I used the figure that matches the company release or the other sources.
| Item | Version A | Version B | What I used |
|---|---|---|---|
| Lenskart growth basis | Statutory revenue +35.7%, profit +124.7% (Inc42) | Pro forma revenue +32.5%, profit +106.1% (company deck via DSIJ, Investywise) | Both, labelled |
| Lenskart half-year | H1 revenue Rs 5,559 crore, profit Rs 461 crore (company) | Rs 3,188 crore and Rs 319.3 crore (Inc42) | Company; the quarters sum to Rs 5,559.21 crore and Rs 460.88 crore (my calculation) |
| PB Fintech revenue and EBITDA | Rs 2,177.7 crore; adjusted EBITDA Rs 216 crore (company deck) | Rs 2,277.56 crore; EBITDA Rs 265.35 crore (Kotak Neo summary) | Company figures |
| PB Fintech profit | Rs 192.4 crore (Inc42) | Rs 192.45 crore (Univest), Rs 192.39 crore (Kotak Neo) | Rs 192.4 crore |
| Instamart NOV | Rs 6,594 crore (Inc42) | Rs 6,954 crore (Lapaas Voice) | Rs 6,594 crore, with the conflict stated |
| Paytm profitable quarters | Fourth in Q1 (Kotak Neo) | Sixth in Q2 (NewKerala) | Neither used as a count |
| Eternal result-day close | Rs 312.35 (Outlook Business) | Rs 308.80 (NiftyTrader) | Neither; both pre-date the results |
Cite this table: PositionalCalls, “Source conflicts, Q2 FY27”; sources named in the table.
Conflicts like these are common in same-day coverage, because outlets summarise and sometimes copy each other’s numbers. For any decision, open the exchange filing. That check matters more for new age tech stocks than for older industries, because their adjusted measures change from one company letter to the next.
PositionalCalls WhatsApp channel
Sector outlook updates in one channel
- Results and source conflicts, dated
- Data reviews without tips
- Links to new outlook pages
New age tech stocks: frequently asked questions
What are new age tech stocks in India?
New age tech stocks are listed internet platforms that earn from apps and marketplaces, such as Eternal, Swiggy, Nykaa, Paytm, PB Fintech, Lenskart, Meesho and Groww. The label is informal and is not an index. This page uses Q2 FY27 results for the quarter ended September 2026 and publishes no picks.
How many new age tech stocks made a profit in Q2 FY27?
Six of the eight covered here: Groww, Lenskart, Paytm, PB Fintech, Eternal and Nykaa. Swiggy lost Rs 922 crore and Meesho lost Rs 132.45 crore (company results as reported). Groww’s Rs 725.65 crore is more than the Rs 547.24 crore total of all eight (my calculation).
Why did Swiggy shares fall after Q2 FY27 results?
Inc42 reported a fall of as much as 17.23% to Rs 174.90 on 23 October 2026, a day after results. The loss widened 16.6% from the June quarter to Rs 922 crore (my calculation) and the Instamart adjusted EBITDA loss rose to Rs 895 crore, although Swiggy says that loss peaked in Q2.
Is Blinkit profitable?
Blinkit reported adjusted EBITDA of Rs 184 crore on net order value of Rs 20,940 crore in Q2 FY27, about 0.9% of order value (my calculation), per Eternal’s shareholder letter as reported by StartupFeed. Segment-level profit is positive but thin, and Eternal says mature cities are above 5%.
Is adjusted EBITDA the same as profit?
No. Adjusted EBITDA leaves out costs a company chooses to exclude, so it is not net profit. Swiggy’s adjusted EBITDA loss was Rs 760 crore against a net loss of Rs 922 crore, and Eternal’s adjusted EBITDA was Rs 666 crore against a Rs 125 crore net profit. Read net result and cash together.
How much cash do the large platforms hold?
Eternal reported Rs 16,475 crore at the end of September 2026, down Rs 1,813 crore in the quarter, Swiggy Rs 13,662 crore, Paytm Rs 13,617 crore and Meesho Rs 7,048 crore. Together that is Rs 50,802 crore (my calculation). Cash cushions losses but can fall quickly.
Do new age tech stocks react to profit growth?
Not consistently. Lenskart rose as much as 11.1% on 5 November after profit more than doubled, while Swiggy fell as much as 17.23% despite a narrower year-on-year loss, per Inc42. Groww slipped 0.82% on 14 October despite 54% profit growth. Prices trade on expectations, not growth alone.
What are the main risks for these platforms?
Quick commerce losses, cash use, rule changes such as the derivatives limits that cut Groww’s volumes in 2025, competition and share supply after lock-ins. Valuation matters too: Nykaa traded near 8.4 times annualised revenue on 4 November (my calculation). Dated prices change, so check live data.
What dates matter next for these companies?
Q3 FY27 results for the December 2026 quarter are expected in January and February 2027, dates not confirmed. Blinkit targets 3,500 stores by March 2027 and Swiggy expects double-digit sequential Instamart order growth in Q3. These are company statements, not forecasts by PositionalCalls.
Does this page recommend any stock?
No. PositionalCalls.com publishes no subscribe, buy, sell, rating or target calls and is not SEBI-registered. This page records reported results, dated price moves and source conflicts. Brokerage targets are not repeated. Check the filings and live prices, and speak to a SEBI-registered adviser before investing.
Sources for these new age tech stocks
- Kotak Neo: Eternal Q2 FY27 results, broker.
- StartupFeed: Eternal Q2 profit rises 92%, press.
- Investywise: Eternal shareholder letter Q2 FY27, summary.
- Inc42: Eternal Q2 profit surges 92%, press.
- Outlook Business: Eternal Q2 profit, press.
- NiftyTrader: Eternal Q2 results, tracker.
- Craytheon: Eternal quarterly results, tracker.
- Finology: Eternal Q2 FY27 results analysis, analysis.
- Inc42: Swiggy Q2 loss narrows 16%, press.
- Inc42: Swiggy shares plunge 17%, press.
- Kotak Neo: Swiggy Q2 results, broker.
- Investywise: Swiggy shareholder letter Q2 FY27, summary.
- Lapaas Voice: Swiggy Q2 FY27, press.
- Swiggy: FY31 adjusted EBITDA goal, company release.
- Kotak Neo: Nykaa Q2 FY27 results, broker.
- Inc42: Nykaa Q2 profit more than triples, press.
- Business Today: Nykaa Q2 earnings, press.
- Multibagg: Nykaa Q2 profit, tracker.
- Inc42: PB Fintech Q2 profit jumps 42%, press.
- Multibagg: PB Fintech Q2 FY27 PAT, tracker.
- StartupFeed: PB Fintech Q2 profit, press.
- Kotak Neo: PB Fintech quarterly results, broker.
- Arthneeti: PB Fintech Q2 FY27, tracker.
- Sovrenn: PB Fintech results, tracker.
- Inc42: Paytm Q2 profit skyrockets, press.
- Lapaas Voice: Paytm Q2 FY27, press.
- Trak: Paytm net profit surge, press.
- Inc42: Lenskart Q2 profit jumps 125%, press.
- Inc42: Lenskart shares jump 11%, press.
- Investywise: Lenskart Q2 FY27 presentation, summary.
- DSIJ: Lenskart share price jumps 8%, press.
- JM Financial: Groww parent Q2 profit rises 54%, broker.
- CNBC-TV18 via EdgeX: Groww Q2 FY27 results, press.
- Business Standard: Groww Q2 FY26, press.
- Upstox: Meesho Q2 FY27 results, broker.
- YourStory: PhysicsWallah, Lenskart, Nykaa profits, press.
- Not re-checked: Meesho lock-in dates and the Eternal Q4 FY26 AI comment (third-party summaries).
- PositionalCalls: Q2 results hub.
PositionalCalls.com is an independent research site founded by Shubham Chaudhary. PositionalCalls.com is not a SEBI-registered research analyst or investment adviser. Investments in securities markets are subject to market risks. Read all related documents carefully before investing. Returns are never guaranteed. This page is educational and publishes no subscribe, buy, sell, rating or target calls. How this page on new age tech stocks was researched: company results and shareholder letters as reported by named outlets, no company filings opened, no paid placement, and no position held by the author in any company named. Corrections are welcome through the contact page.

Shubham Chaudhary is the founder of PositionalCalls, an independent Indian stock market research website. He writes company fundamentals, quarterly results analysis, IPO analysis and sector research for NSE and BSE listed companies, with a focus on banking stocks, insurance and long-term value investing. Every article is built from primary sources such as RBI, SEBI, NSE and BSE filings and company annual reports, and states its risks plainly in simple language for retail investors.
Coverage areas Our research standards- Numbers checked against NSE, BSE and SEBI filings
- Risks and limits stated in every article
- No paid promotions or broker tie-ups
- Articles updated when new filings arrive