
Sector Outlook · Power
This power sector outlook 2026 page tests India’s electricity demand, coal stocks, capacity and Q2 FY27 results of listed power companies against dated sources, records where numbers disagree and gives no stock picks.
Quick answer
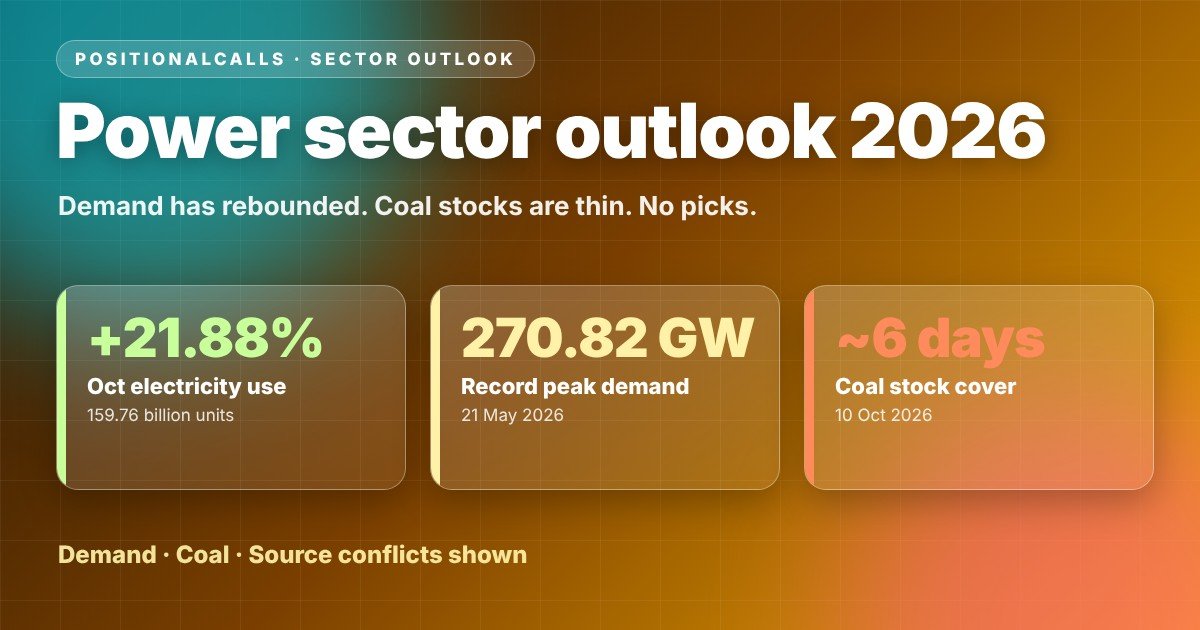
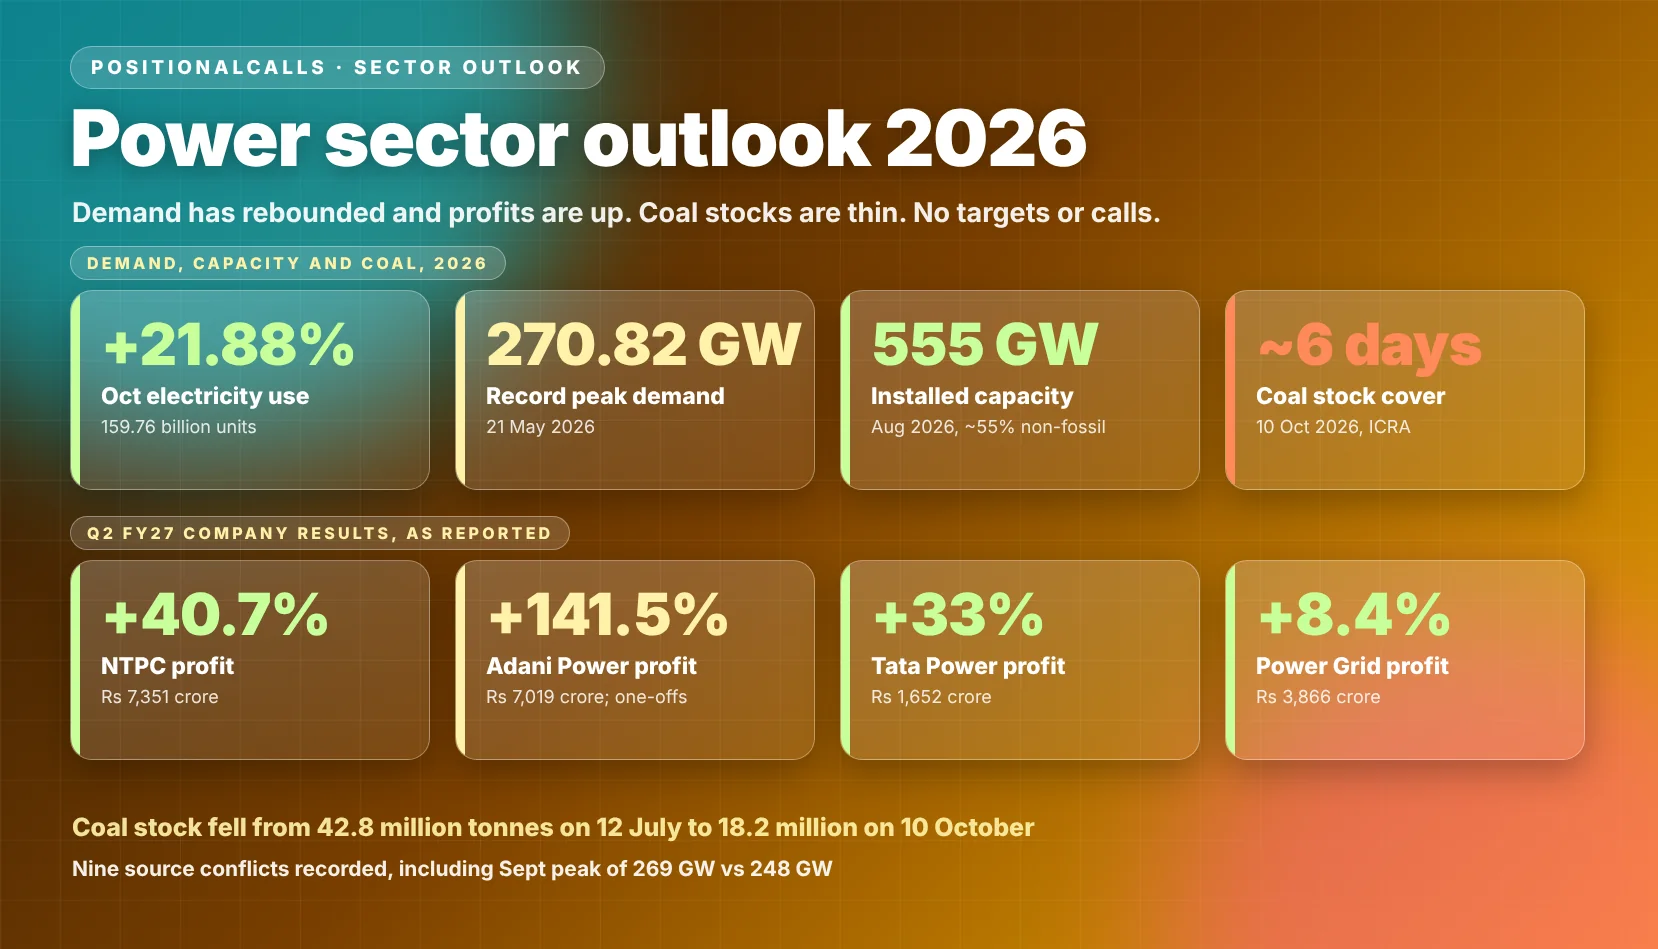
The power sector outlook 2026 is a demand rebound with a thin coal buffer. Electricity use rose 11.5% in the September quarter and 21.88% in October 2026, after about 1% in FY26. Listed generators reported strong Q2 FY27 profits, while coal stocks fell to roughly six days.
Key takeaways on the power sector outlook 2026
- Demand: the September quarter grew 11.5% and October 21.88%, against 0.8% to 1% growth in FY26.
- Supply: capacity reached 555 GW, and 7 GW of the September-quarter additions were renewable.
- Coal: stocks fell from 42.8 million tonnes in July to 18.2 million tonnes in October.
- Profit: NTPC, Adani Power, Tata Power, Power Grid and JSW Energy all reported higher Q2 FY27 profit.
- Doubt: nine source conflicts are recorded, including two September peak figures.
In plain words: India used much more electricity this year than last, mostly because of heat and a weak monsoon. Power companies earned more, but the coal sitting at power plants got low. Whether the extra demand lasts is the open question.
Data note: as of Saturday, 21 November 2026, 3:00 PM IST. Demand and capacity figures are from CEA, Grid-India, ICRA and CREA data, as relayed by the sources named. Company figures are from Q2 FY27 results for the quarter ended 30 September 2026, as relayed by the sources named. I did not open the exchange filings or the CEA releases, and lines marked as my calculation are my own arithmetic. Analysis only: no buy or sell calls, targets or price zones.
Latest update
- 21 November 2026, 3:00 PM IST: demand data run to the first 11 days of November (ICRA, 18 November), coal stock to 10 October, and company results to 11 November.
Power sector outlook 2026: where does the sector stand in November 2026?
The power sector outlook 2026 shows a sharp demand rebound, record capacity, strong generator profits and a thin coal buffer. FY26 was a flat year, and FY27 has reversed it. The table collects the latest dated figures this page uses.
| Measure | Latest figure | Period | Source named |
|---|---|---|---|
| Electricity use | 159.76 billion units, up 21.88% from 131.07 billion | October 2026 | Construction World |
| September-quarter demand | 502 billion units, up 11.5% | Q2 FY27 | Adani Power disclosure, via 5paisa and News24 |
| Record peak demand | 270.82 GW on 21 May 2026 | FY27 | Construction World, Angel One |
| Installed capacity | 555 GW, about 55% non-fossil | August 2026 | CREA, via Down To Earth |
| Coal stock at plants | 18.205 million tonnes on 10 October, about 6 days | October 2026 | Newkerala, ICRA via Investment Guru |
| Spot power price (IEX) | Rs 7.7 per unit on 10 October, against Rs 2.6 a year earlier | October 2026 | ICRA, via Investment Guru |
Cite this table: Power sector snapshot, PositionalCalls, Saturday, 21 November 2026, 3:00 PM IST, figures as reported by the sources named.
Two readings of this table are worth keeping apart. The first is demand: October’s 21.88% growth sits on a low base, since ICRA reported a 5.0% year-on-year decline in demand for the first 20 days of October 2025. The second is supply: capacity is growing, but the coal stock figure shows the fleet running harder than its inventory allows. This page treats demand growth as supported by data and the coal buffer as the open question.
Company results sit on top of these figures. NTPC, Adani Power, Tata Power, Power Grid and JSW Energy all reported higher profit for Q2 FY27, and the results section sets them side by side with the one-off items that complicate the comparison. Energy utilities and PSU names also appear in the energy and PSU sector outlook, which covers a different slice of the market.
How strong is electricity demand in the power sector outlook 2026?
Demand has grown at double-digit rates in the second half of 2026 after a year of near-zero growth. ICRA reported 0.8% growth for FY26, and the rebound began in April 2026 on heat and a delayed monsoon. The table shows the monthly path.
| Period | Growth or level | Source named |
|---|---|---|
| FY2026 | 0.8% growth, or about 1%, the slowest in five to six years | ICRA, Newsbytes |
| April to June 2026 | About 8% growth to nearly 485 billion units | 360 ONE Capital, via Newkerala |
| First four months of FY27 | 9.4% growth | ICRA |
| September 2026 | 162 billion units, up 11.3% | Down To Earth, from CEA and Grid-India data |
| October 2026 | 159.76 billion units, up 21.88% | Construction World |
| First 11 days of November 2026 | Up 12.9% | ICRA, 18 November 2026 |
Cite this table: India electricity demand path, PositionalCalls, Saturday, 21 November 2026, 3:00 PM IST, as reported by the sources named.
The sequence matters because the base year was weak. S&P Global Market Intelligence called FY26 the first annual contraction in electricity demand since the pandemic, while ICRA reported 0.8% growth, and the conflicts section records that gap. A weak monsoon, above-normal temperatures and festival-season commercial use explain much of the 2026 rebound in the sources. ICRA raised its FY27 growth estimate from about 5% in January and March to 6.5% in August 2026, and the actual first-half figure is already above both.
What do peak demand figures show in the power sector outlook 2026?
| Peak demand measure | Figure | Source named |
|---|---|---|
| All-time record | 270.82 GW on 21 May 2026 | Construction World, Angel One |
| Peak on 16 July | 270 GW | Angel One, citing CNBC-TV18 |
| September peak | 269 GW on 10 September, or 248 GW | Down To Earth, or Madhyamam citing the Grid Controller |
| October peak | 260.73 GW, against 210.82 GW a year earlier | Construction World |
| Late October | About 234 GW, down from about 260 GW on 5 October | IndianPSU |
| FY26 actual peak | About 245 GW, against a 270 GW projection | Powerline |
Cite this table: Peak power demand in 2026, PositionalCalls, Saturday, 21 November 2026, 3:00 PM IST, as reported; the two September figures conflict.
The peak record stands in May, but September also hit a near-summer peak, which Down To Earth called an unusual seasonal shift. State data show the unevenness: Grid-India reported Telangana’s maximum demand up 54.0% in October until the 22nd.
Peak forecasts differ and are listed in the conflicts section. Spot prices tell their own story: IEX spot averaged Rs 7.7 per unit on 10 October against Rs 7.3 in September and Rs 2.6 in October 2025, per ICRA, and ICRA’s 18 November update said spot tariffs had softened.
Why is India’s electricity demand rising in the power sector outlook 2026?
Demand is rising because heat, hotter nights and a weak monsoon added cooling and irrigation load on top of steady industrial use. The table lists each driver with the evidence in the sources.
| Driver | Evidence | Source named |
|---|---|---|
| Cooling | Slightly more than 10% of annual demand and about 20% of peak demand | IEA; bdnews24 |
| Hotter nights | Night peak of 251.964 GW at 22:45 on 21 May 2026; air conditioners add 60 to 70 GW to peak load in cities | Outlook Business |
| Industry | Nearly half of electricity consumption | CRISIL Intelligence, via Down To Earth |
| Weak monsoon | Higher irrigation and cooling load in September, with a near-summer peak | Down To Earth |
| Early heat | Record 256 GW on 25 April before the 270.82 GW peak on 21 May | Business Today, Business Standard |
| Warm winter | No cold day in February 2026 and the highest January demand on record | CRISIL Intelligence, via Down To Earth |
Cite this table: Drivers of India electricity demand in 2026, PositionalCalls, Saturday, 21 November 2026, 3:00 PM IST, as reported by the sources named.
The drivers are mostly weather and consumption patterns, not new industrial capacity, which is why the rebound is harder to project. Down To Earth also lists data centres among emerging loads, but none of the sources puts a figure on them. A low FY26 base adds to the headline growth rates, and the next section shows how far forecasters missed it.
Did forecasters get FY27 power demand right in the power sector outlook 2026?
Every FY27 forecast I found was below the demand growth reported so far. The table sets published forecasts beside the reported figures, with the dates of each.
| Forecaster | Date | Forecast for FY27 or 2026 | Source named |
|---|---|---|---|
| Bernstein | 7 January 2026 | Recovery to about 5% growth | Newkerala, Lokmat Times |
| ICRA | January and March 2026 | About 5% growth in FY27 | ICRA reports |
| S&P Global CERA | 30 April 2026 | 4.7% to 5.4% rebound for April to December 2026 | S&P Global |
| Fitch Ratings | 12 May 2026 | 4% to 5% growth in FY27 | Tribune, via ANI |
| ICRA | 31 August 2026 | 6.5% growth in FY27 | ICRA |
| IEA | Mid-year 2026 update | About 7% rebound in India in 2026 | Down To Earth |
| Reported so far | To 18 November 2026 | 9.4% in April to July, 11.5% in July to September, 12.9% in early November | ICRA, Adani Power disclosure |
Cite this table: FY27 electricity demand forecasts against reported growth, PositionalCalls, Saturday, 21 November 2026, 3:00 PM IST, as reported by the sources named.
On my calculation, Fitch’s 5% upper bound sits 4.4 percentage points below ICRA’s reported 9.4% for April to July. Indian Ratings and Research also kept a neutral FY27 outlook on long-term demand growth of 5.5% to 6.0%, per pv magazine. The pattern suggests the forecasts assumed normal weather, which 2026 did not deliver.
What was the FY26 demand base in the power sector outlook 2026?
| Source | FY26 demand growth | Note |
|---|---|---|
| S&P Global CERA | Down 0.3%, to about 1,690 TWh from 1,695 TWh | Published 30 April 2026 |
| ICRA | Up 0.8% | Also reported as about 1% by NewsBytes |
| Fitch Ratings | Up 0.9% | Published 12 May 2026 |
| Bernstein | Down about 0.7% in FY26 until December | Part-year figure |
Cite this table: FY26 India electricity demand growth by source, PositionalCalls, Saturday, 21 November 2026, 3:00 PM IST, as reported; the four versions conflict.
The spread of minus 0.3% to plus 0.9% is small in absolute terms, but it flips the sign of the headline, which is why S&P calls FY26 a contraction and ICRA calls it marginal growth. The difference may reflect data coverage or the period measured, though the sources do not say.
What do capacity, coal and plant load factors show in the power sector outlook 2026?
Capacity is growing fastest in renewables, while coal plants carry the extra demand and coal stocks have fallen. The table sets out capacity milestones.
| Date | Installed capacity | Detail | Source named |
|---|---|---|---|
| January 2026 | 520.51 GW | As of January 2026 | PIB |
| 31 March 2026 | 532.74 GW | Coal 41.7%, non-fossil 53.2% | Power ministry |
| August 2026 | 555 GW | Coal 224 GW, solar 168 GW, wind 59 GW, large hydro 52 GW | CREA, via Down To Earth |
| Q2 FY27 additions | 7 GW renewable, 0.8 GW thermal | 648 MW of thermal capacity retired | CREA |
Cite this table: India installed power capacity, PositionalCalls, Saturday, 21 November 2026, 3:00 PM IST, as reported by the sources named.
Renewable output crossed 100 billion units in a quarter for the first time, per CREA, and renewables supplied about one quarter of peak demand on 21 May, per IEA. Even so, thermal plants supplied 69.54% of electricity from April to June 2026, per the power ministry. CREA reported a coal plant load factor of 68% in Q2 FY27, against ICRA’s 65.2% for FY26 and its forecast of 66% to 68% for FY27. Adani Power reported its own plant load factor rose to 70.1% from 62.8%. On additions, ICRA reports gross capacity addition of 61.6 GW in FY26 with about 50 GW likely in FY27, and S&P reports 62.4 GW added in FY26, of which 51 GW was renewable.
How low are coal stocks in the power sector outlook 2026?
| Date | Coal stock or cover | Source named |
|---|---|---|
| 12 July 2026 | 42.8 million tonnes, 14 days at 85% load factor | Power ministry, via Daily Pioneer |
| 18 August 2026 | Down 34.5% from 51.97 million tonnes a year earlier, 55% of the normative level | S&P Global, from CEA data |
| August 2026 | 29 million tonnes, 9 days, against 50 million and 17 days a year earlier | Crisil Intelligence, via Business Today |
| 10 October 2026 | 18.205 million tonnes; about 6 days | Newkerala, ICRA via Investment Guru |
Cite this table: Coal stock at thermal power plants, PositionalCalls, Saturday, 21 November 2026, 3:00 PM IST, as reported; dates and measures differ.
The direction is clear even where the measures differ. Coal use ran at about 79 million tonnes a month from June to September, per CREA, while dispatch to plants fell from 74 million tonnes in May to 66 million in August. Stocks declined by about 7.28 million tonnes in September, per the coal ministry, and the pace slowed in early October. Crisil called the August drawdown a temporary logistics issue, not structural stress. Imports by power plants fell 22% to 12.28 million tonnes in Q1 FY27, per S&P. For the supplier side, see Coal India Q2 results.
The mix explains why both stories are true at once. Non-fossil capacity is above 53% to 55%, but coal and lignite still total 231 GW, or 42%, per CREA, and they carry the baseload. The sources also disagree on thermal capacity, recorded in the conflicts section.
What did power companies report for Q2 FY27 in the power sector outlook 2026?
Five listed power companies reported higher Q2 FY27 profit, but the one-off items differ. The table lists each result as reported. Figures are for the quarter ended 30 September 2026.
| Company | Q2 FY27 revenue | Q2 FY27 profit | Source named |
|---|---|---|---|
| NTPC | Consolidated revenue from operations Rs 54,270 crore, up 21.2% | Consolidated profit Rs 7,351 crore, up 40.7% | JM Financial, Lapaas Voice, IndianPSU |
| Adani Power | Revenue from operations Rs 19,439 crore, up 44.5% | Profit after tax Rs 7,019 crore, up 141.5% | PSU Connect, Newkerala, Multibagg |
| Tata Power | Revenue Rs 19,886 crore, up about 26% | Consolidated profit Rs 1,652 crore, up 33% | Multibagg, Tata Power release via TND India |
| Power Grid | Revenue from operations Rs 11,816 crore, up 3% | Consolidated profit Rs 3,866 crore, up 8.4% | Sovrenn, Ventura Securities |
| JSW Energy | Revenue from operations Rs 6,368 crore, up 23% | Consolidated profit Rs 1,141 crore, up 38% | PSU Connect, Ventura Securities |
Cite this table: Power company Q2 FY27 results, PositionalCalls, Saturday, 21 November 2026, 3:00 PM IST, as reported; this page does not rank the companies.
Each profit line needs a qualifier. NTPC’s standalone profit rose 14.3% to Rs 5,320 crore, far below the 40.7% consolidated rise, so subsidiaries drove much of the gain. Adani Power’s reported profit includes Rs 2,422 crore of prior-period revenue tied to revised Gujarat tariff terms and a Rs 231 crore net tax credit, per Multibagg, and its continuing EBITDA rose 18.5% to Rs 6,321 crore. Tata Power’s profit before exceptional items rose 22% to Rs 1,521 crore, against the headline 33%. See Adani Power Q2 results and Power Grid Q2 results on the site for single-company detail.
PositionalCalls WhatsApp channel
Follow sector pages in one place
- New sector outlooks as they are posted
- Results summaries without tips
- A message when a page is updated
How do operating details compare in the power sector outlook 2026?
| Company | Operating detail | Source named |
|---|---|---|
| NTPC | EBITDA Rs 15,627 crore, up 22%, margin 28.8%; H1 consolidated profit Rs 14,247 crore, up 25.7%; interim dividend Rs 3 | Lapaas Voice, Sovrenn |
| Adani Power | Sales 26.4 billion units against 23.7 billion; load factor 70.1% against 62.8% | Multibagg |
| Tata Power | EBITDA Rs 4,245 crore, up 5%; capex of about Rs 10,000 crore done against a plan near Rs 25,000 crore; renewable curtailment about 11% against 8.8% in Q1 | TND India, Multibagg |
| Power Grid | H1 capex Rs 16,864 crore; six transmission projects won through bidding; Rs 3 interim dividend | Ventura Securities, PSU Watch |
| JSW Energy | Net generation 17.5 billion units, up 17%; capacity 15,147 MW on 5 October, of which 9,189 MW renewable | Indmoney, Energetica India |
Cite this table: Power company operating details, Q2 FY27, PositionalCalls, Saturday, 21 November 2026, 3:00 PM IST, as reported.
The comparison shows a split. Thermal generators gained from higher volumes and load factors, while Tata Power’s 11% renewable curtailment and Power Grid’s regulatory offsets show where growth is harder. NTPC Green Energy reported profit up 59% to Rs 138 crore, per Sovrenn, and the hydro side is in NHPC Q2 results. For power equipment orders, see Thermax Q2 results.
What do the derived numbers show in the power sector outlook 2026?
Eight checks tie reported figures together and show where the headline overstates or understates. Every row in this table is my calculation from the sourced figures above.
| Check | My calculation | Reading |
|---|---|---|
| October demand growth | 159.76 / 131.07 less 1 = 21.9% | Ties to the reported 21.88% within rounding |
| Coal stock change, 12 July to 10 October | 18.205 / 42.8 less 1 = down 57.5% | Two different reporters; direction matters more than the exact figure |
| Record peak against FY26 actual peak | 270.82 / 245 less 1 = up 10.5% | Compares a May 2026 record with the FY26 actual peak of about 245 GW |
| Spot price multiple | Rs 7.7 / Rs 2.6 = 3.0 times | IEX spot on 10 October 2026 against October 2025 |
| Renewable share of Q2 additions | 7 / (7 + 0.8) = 89.7% | CREA figures; retirements of 648 MW excluded |
| NTPC subsidiary and other contribution | Rs 7,351 crore less Rs 5,320 crore = Rs 2,031 crore | Consolidated minus standalone profit; not a segment figure |
| Adani Power prior-period revenue share | Rs 2,422 crore / Rs 19,951 crore = 12.1% | Share of total reported revenue |
| Tata Power exceptional effect | Rs 1,652 crore less Rs 1,521 crore = Rs 131 crore; 33% less 22% = 11 points | Reported profit against profit before exceptional items |
Cite this table: Derived power sector numbers, PositionalCalls, Saturday, 21 November 2026, 3:00 PM IST, my calculation from the sourced figures.
NTPC’s 40.7% leans on subsidiaries, since standalone profit rose only 14.3%, and Adani Power’s 141.5% includes a prior-period item equal to about an eighth of reported revenue, so neither is comparable with Power Grid’s 8.4% without adjustment.
What do rating agencies and brokerages say about the power sector, as reported?
Reported sector views range from neutral to positive, and none of them is a stock call on this page. The table lists views on the sector as a whole, with dates and sources.
| Source | Date | Reported view of the sector | Source named |
|---|---|---|---|
| India Ratings and Research | 3 February 2026 | Neutral outlook for FY27; coal to stay about 70% of generation | pv magazine India |
| Jefferies | 3 January 2026 | Demand recovery to drive upside; valuation re-rating prospects dim until demand fully recovers | Newkerala, ANI |
| Bernstein | 7 January 2026 | Recovery without a sharp demand rebound | Lokmat Times, ANI |
| Fitch Ratings | 12 May 2026 | Utility credit profiles resilient as demand recovers | Tribune, ANI |
| HDFC Securities | 23 June 2026 | Sector outlook strong on demand, policy support and capex | Asianet News, ANI |
| 360 ONE Capital | 18 July 2026 | Growth outlook strong; higher costs and execution risks pose offsets | Newkerala |
| Citi Research | Date not shown in the result | 5% to 6% CAGR; calls the capex cycle multi-vector across thermal, renewables, transmission and storage | Asianet News |
Cite this table: Agency and broker views on the power sector, PositionalCalls, Saturday, 21 November 2026, 3:00 PM IST, as reported; each is a single-source item and none is a stock recommendation.
The earlier views predate the demand rebound. This page gives no call and does not repeat any broker’s stock picks or price targets.
Where do sources disagree on the power sector outlook 2026?
Nine conflicts appear in the data, and each changes how a number reads. The table shows both versions and the one this page uses.
| Item | Version A | Version B | How this page handles it |
|---|---|---|---|
| FY26 demand growth | Up 0.8% (ICRA) or 0.9% (Fitch) | Down 0.3% (S&P Global CERA); down 0.7% to December (Bernstein) | Shows all four; uses ICRA for comparison |
| NTPC Q2 consolidated profit | Rs 7,351 crore, up 40.7% (JM Financial, PowerPeakDigest, Lapaas Voice) | Rs 7,030 crore, up 38.7% (Newkerala headline) | Uses Rs 7,351 crore, the figure most sources give |
| NTPC Q2 FY26 base profit | Rs 5,225 crore (JM Financial, Lapaas Voice) | Rs 5,067 crore reported in October 2025 (Motilal Oswal) | Uses Rs 5,225 crore; the sources do not explain the gap |
| Adani Power Q2 profit | Rs 7,019 crore, up 141.5% (PSU Connect, Newkerala, Multibagg) | Rs 6,919 crore, up 134%, EBITDA Rs 8,231 crore (5paisa) | Uses Rs 7,019 crore; reported EBITDA was Rs 8,743 crore elsewhere |
| Tata Power Q2 revenue and profit | Revenue Rs 19,886 crore, profit Rs 1,652 crore (company release) | Revenue from operations Rs 19,636 crore, owners’ profit Rs 1,366 crore (Free Press Journal) | Different line items; uses the company figures and labels both |
| September peak demand | 269 GW on 10 September (Down To Earth) | 248 GW (Madhyamam, citing the Grid Controller) | Shows both; the reported record is 270.82 GW in May |
| FY27 peak demand projection | 289 GW (Powerline) | 278.8 GW (Angel One) and 270 GW for summer (Construction World) | Shows all three as projections |
| Thermal capacity | 230.8 GW (power ministry statement, July) | 251.48 GW, about 45% of the mix (Powerline, July) | Shows both; the definitions of thermal differ |
| Power Grid capex guidance | About Rs 37,000 crore annual guidance (Sovrenn) | Rs 35,000 crore for FY27 (Quartr, February 2026 summary) | Shows both; the later guidance may have been raised |
Cite this table: Source conflicts in power sector data, PositionalCalls, Saturday, 21 November 2026, 3:00 PM IST, as recorded from the sources named.
Which conflict matters most for comparing power companies?
Most of these are definition gaps: consolidated against standalone, reported against continuing, total income against revenue from operations. The two that change the reading are the FY26 demand base and the September peak, and the power sector outlook 2026 on this page does not rest on either.
What are the risks to the power sector outlook 2026?
Six risks could make the power sector outlook 2026 wrong, and two are visible in reported numbers. Red marks risks that already show in data, amber marks measures to watch, and blue marks risks that depend on future events.
The risks feed each other: strong demand draws down coal stocks, and low stocks raise fuel cost. Discom finances are a counterweight, since outstanding dues fell from Rs 1.4 lakh crore in June 2022 to Rs 4,109 crore in February 2026, per PIB.
Bottom line
The power sector outlook 2026 is strong on demand and profit, and tight on coal. Electricity use is rising at double-digit rates and listed generators reported higher profit, but stocks at plants are low and part of the profit growth is one-off.
What should you watch next in the power sector outlook 2026?
Watch ICRA’s December demand update, the next coal-stock figure and the Q3 FY27 results. The table gives each item and the figure to compare it against.
| Item to watch | Why it matters | Compare against |
|---|---|---|
| ICRA monthly demand update, December 2026 | Tests whether growth stays in double digits as winter starts | November first 11 days: 12.9% |
| Coal stock at power plants, weekly CEA data | Tests the six-day buffer | 10 October: 18.205 million tonnes |
| IEX spot price | Shows scarcity pricing | 10 October: Rs 7.7 per unit |
| Q3 FY27 results, January and February 2027 | Tests profit without the Q2 one-offs | NTPC Rs 7,351 crore; Adani Power continuing EBITDA Rs 6,321 crore |
| Capacity additions in Q3 FY27 | Tests the renewable-to-thermal ratio | Q2: 7 GW renewable, 0.8 GW thermal |
| Peak demand in winter | Tests the shift toward seasonal peaks | Record 270.82 GW; October 260.73 GW |
Cite this table: Power sector watch list, PositionalCalls, Saturday, 21 November 2026, 3:00 PM IST, dates as reported; later dates may move.
Monthly demand data say nothing about profit, so use the quarterly company results and check which profit line is quoted.
Power sector outlook 2026 in Hinglish: short summary
Is saal bijli ki demand tezi se badhi hai, lekin power plants par coal stock kam hai. September quarter mein demand 11.5% aur October mein 21.88% badhi. Installed capacity August 2026 tak 555 GW rahi. ICRA ke mutabik 10 October ko coal stock lagbhag 6 din ka tha.
NTPC, Adani Power, Tata Power, Power Grid aur JSW Energy ka Q2 FY27 profit badha. Adani Power ke profit mein Rs 2,422 crore ka one-off bhi shamil hai, isliye growth ki seedhi tulna na karein. Yeh sirf jaankari hai: koi target, rating ya buy-sell salaah nahi.
What pages sit beside this power page?
The company results pages and the other sector outlooks give the surrounding layer.
- Sector hub: sector outlook India, the sector pages
- Company results: Adani Power Q2 results, Power Grid Q2 results, NHPC Q2 results and Coal India Q2 results
- Related sector pages: energy and PSU sector outlook 2026, infrastructure sector outlook 2026 and metal sector outlook 2026
- Macro: India CPI inflation for October 2026 and RBI repo rate
- Dates: earnings calendar and Q2 FY27 results scorecard
This page is the sector view. It does not rank companies or give targets. The results pages show the company figures, so use them for that job.
Sources for this power page
Every figure comes from the sources below, read on 21 November 2026. I did not open exchange filings, CEA releases or company presentations for each figure, so use the links to reach the primary source.
- Down To Earth: India’s power
- Outlook Business: How extreme heat
- bdnews24: Extreme heat to strain
- Business Today: Why thermal power
- Down To Earth: Global power
- Tribune India: India’s power demand
- Lokmat Times: Power sector recovery
- pv magazine India: Thermal anchors
- Newkerala: Jefferies forecasts recovery in
- Asianet News: Indian power sector
- Asianet News: India’s power sector
- ICRA: Electricity demand growth to
- S&P Global: India’s power and
- S&P Global: India’s power plants
- PIB: India’s power sector, progress
- Ministry of Power: Power sector
- ICRA: Power sector quarterly update
- ICRA: Healthy electricity demand persists
- ICRA: Robust demand in October
- ICRA: Decline in all-India electricity
- Investment Guru India: ICRA monthly
- Down To Earth: Unusual peak
- Down To Earth: Renewable generation
- CREA: India Energy Snapshot Q2
- CREA: India Power Sector Review
- Construction World: India’s power consumption
- Angel One: India peak power
- Powerline: Demand uptick, key drivers
- Powerline: Coal remains key
- IndianPSU: India’s peak power demand
- Power Peak Digest: India’s power
- Madhyamam: India’s power shortage rises
- IEA: India’s electricity demand grows
- NewsBytes: India’s electricity use up
- Newkerala: Power sector growth outlook
- Business Today: Why India’s thermal
- Newkerala: Coal stocks at power
- Daily Pioneer: India has sufficient
- Newkerala: NTPC Q2 net profit
- JM Financial: NTPC Q2 PAT
- Sovrenn: NTPC Q2 FY27 results
- Lapaas Voice: NTPC Q2 FY27
- Motilal Oswal: NTPC Q2 FY26
- PSU Connect: Adani Power Q2
- Multibagg: Adani Power Q2 profit
- 5paisa: Adani Power Q2 FY27
- TND India: Tata Power delivers
- Multibagg: Tata Power Q2 FY27
- Free Press Journal: Tata Power
- Ventura Securities: Power Grid Q2
- Sovrenn: Power Grid Q2 FY27
- Quartr: Power Grid Q2 25/26
- Multibagg: POWERGRID Q2 profit rises
- PSU Connect: JSW Energy Q2
- Indmoney: JSW Energy Q2 FY27
- Energetica India: JSW Energy Q2
- Sovrenn: NTPC Green Energy Q2
Where a source is a news report on company or grid data, the report is named, not the company. If any figure differs from the primary release, the primary release governs.
PositionalCalls WhatsApp channel
Keep sector updates together
- Quarterly result summaries
- Budget and policy changes
- Links to new sector pages
power sector outlook 2026: frequently asked questions
What is the power sector outlook 2026 for India?
Demand has rebounded sharply after a flat FY26, and generators reported strong Q2 FY27 profits, but coal stocks fell to about six days by 10 October. Electricity use rose 21.88% in October 2026 and 11.5% in the September quarter. This page tests that picture against dated sources and gives no target, rating or stock call.
How much did India’s electricity demand grow in 2026?
The September quarter grew 11.5% to 502 billion units, per Adani Power’s disclosure, and October rose 21.88% to 159.76 billion units, per Construction World. ICRA reported 9.4% growth in the first four months of FY27 after 0.8% in FY26. The power sector outlook 2026 treats these as reported figures, with weather the main driver.
What is India’s peak power demand in 2026?
The record is 270.82 GW on 21 May 2026, per Construction World and Angel One. Sources disagree on September: Down To Earth reports 269 GW on 10 September, while Madhyamam, citing the Grid Controller, reports 248 GW. October’s peak was 260.73 GW, and late October eased to about 234 GW. The power sector outlook 2026 shows both September figures.
Are coal stocks a risk in the power sector outlook 2026?
They are the clearest supply risk on the evidence. Stocks were 42.8 million tonnes on 12 July, about 29 million in August per Crisil, and 18.2 million on 10 October per the coal ministry, which ICRA put near six days. Crisil called the August fall a logistics issue. Check the latest CEA data before relying on any single date.
What did NTPC, Adani Power and Tata Power report for Q2 FY27?
NTPC reported consolidated profit of Rs 7,351 crore, up 40.7%. Adani Power reported Rs 7,019 crore, up 141.5%, including Rs 2,422 crore of prior-period revenue. Tata Power reported a record Rs 1,652 crore, up 33%. Power Grid reported Rs 3,866 crore, up 8.4%, and JSW Energy Rs 1,141 crore, up 38%. All figures are as reported.
Why do sources disagree on power sector numbers?
They use different definitions and dates. NTPC’s consolidated profit appears as Rs 7,351 crore and Rs 7,030 crore, Adani Power’s as Rs 7,019 crore and Rs 6,919 crore, and thermal capacity as 230.8 GW and 251.48 GW. The power sector outlook 2026 conflicts table lists nine such pairs and the version this page uses.
How much power capacity does India have in 2026?
CREA reports 555 GW of installed capacity in August 2026, up 12% on a year, with non-fossil sources at about 55%. The power ministry listed 532.74 GW at 31 March 2026, with coal at 41.7%. In the September quarter, 7 GW of renewables were added against 0.8 GW of thermal. These are reported figures, not forecasts.
Does this power sector outlook 2026 page give stock picks?
No. This page gives no target, rating, entry or exit level and no buy or sell call, and it leaves out brokerage stock picks. It reports company, CEA, ICRA, CREA and agency figures with sources and dates, labels its own arithmetic as my calculation, and records where sources disagree. Analysis only. Open the filings before you decide anything.
What are the main risks in the power sector outlook 2026?
Six risks: thin coal stocks, weather-driven demand that swung from 0.8% growth to double digits, renewable curtailment and night-time supply, high spot prices, one-off items inside reported profit, and heavy capital spending. Each is sourced in the risks section, and the coal risk carries the widest spread of dated figures.
Why is India’s electricity demand rising in 2026?
Heat, hotter nights and a weak monsoon lifted cooling and irrigation load, and industry, which CRISIL puts at nearly half of consumption, also grew. The IEA puts cooling at about 20% of peak demand, and the night peak reached 251.964 GW on 21 May. The power sector outlook 2026 also notes a low FY26 base.

Shubham Chaudhary is the founder of PositionalCalls, an independent Indian stock market research website. He writes company fundamentals, quarterly results analysis, IPO analysis and sector research for NSE and BSE listed companies, with a focus on banking stocks, insurance and long-term value investing. Every article is built from primary sources such as RBI, SEBI, NSE and BSE filings and company annual reports, and states its risks plainly in simple language for retail investors.
Coverage areas Our research standards- Numbers checked against NSE, BSE and SEBI filings
- Risks and limits stated in every article
- No paid promotions or broker tie-ups
- Articles updated when new filings arrive