
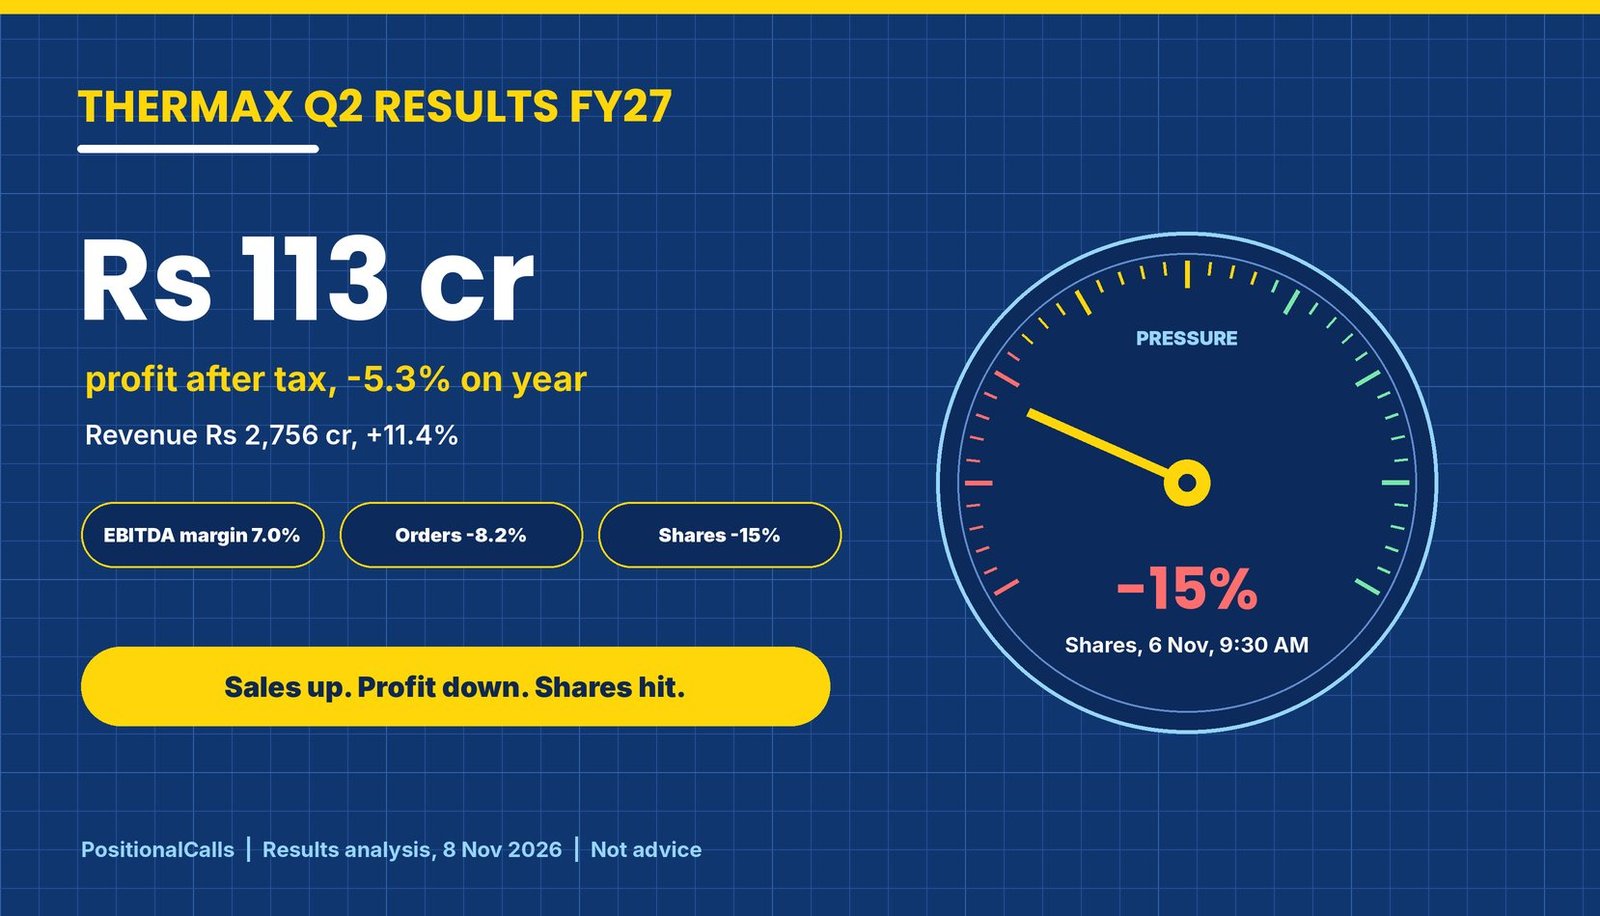
Earnings · Thermax Limited · Q2 FY27
Thermax grew sales 11% but profit slipped 5%, orders fell 8% and the shares dropped 15% or more on 6 November. Here are the profit bases, margin, segments, order book, brokerage views as reported and the price fall.
Quick answer
Thermax Q2 results FY27: consolidated profit after tax was Rs 113.11 crore, down 5.3% from Rs 119.40 crore, on revenue of Rs 2,756 crore, up 11.4%, announced on 5 November 2026. Order booking fell 8.2%. The shares fell as much as 15% on 6 November, to Rs 2,830, per Business Standard.
Latest update (Sunday, 8 November 2026, 7:00 AM IST): Thermax announced the Thermax Q2 results FY27 on Thursday, 5 November 2026; reports stamped 7:50 PM and 10:03 PM IST carry the numbers. On Friday, 6 November the shares fell as much as 15% to Rs 2,830 by about 9:30 AM (Business Standard) and were down 18.13% at 12:19 PM (Kotak Neo). I did not find an official 6 November close or a brokerage target after the results. The next regular session is Monday, 9 November.
Key takeaways
- Profit: Profit after tax Rs 113.11 crore (-5.3% on Rs 119.40 crore); one report shows Rs 114.54 crore, and it is +419% on Q1 FY27’s Rs 21.79 crore (my calculation).
- Revenue and EBITDA: Revenue Rs 2,755.9 crore (+11.4%); EBITDA Rs 194.1 crore (+12.9%) at a 7% margin, from one report, so I flag it.
- Segments: Industrial Infra PBIT swung to Rs 56 crore from a Rs 1 crore loss, while Industrial Products PBIT fell to Rs 78 crore from Rs 116 crore and Green Solutions lost Rs 25 crore.
- Orders: Booking Rs 3,259 crore (-8.2%) as major Industrial Products orders slipped to Q3; order balance Rs 14,250 crore (+15.9%).
- Price: Shares fell 15% to Rs 2,830 by about 9:30 AM on 6 November (Business Standard) and 18.13% by 12:19 PM (Kotak Neo); I found no official close.
- Preview: Revenue beat the preview’s top growth row; profit landed near the Rs 119 crore mark, so the Q1 project overrun did not show as another big loss.
Preview post, 1 November 2026Thermax Q2 results preview: date check, profit base and what to read first
- The 5 November date and the Rs 119 crore profit base
- The Q1 FY27 fall of 85% on one project overrun
- Scenario tables and a reading guide with stronger, in-line and weaker marks
Read the full preview post for the checklist made before the numbers arrived.
This results analysis, 8 November 2026What the numbers showed
- Profit, revenue, EBITDA and the segment split against the base
- Order booking, order balance and the sources that disagree
- The price fall on 6 November and brokerage views as reported
A table further down grades each preview mark against the actual figure.
How to read this page: it is results analysis, not a recommendation. Brokerage views are quoted as reported with source and date; none is mine. PositionalCalls.com is not a SEBI-registered research analyst or investment adviser.
In plain words: Thermax sells more but kept less. Revenue rose 11.4% to Rs 2,756 crore, yet profit after tax slipped 5.3% to Rs 113 crore because costs and product mix ate the gain, and new orders fell 8.2%. The order balance, the work already booked and still to be delivered, grew 15.9%, which supports future revenue but not the margin by itself.
Data note: as of Sunday, 8 November 2026, 7:00 AM IST. Figures come from press and data-platform summaries of the filing (Business Standard, Kotak Neo, Investywise, Whalesbook, Multibagg and Sahi); I did not open the BSE or NSE filing or the investor presentation. Profit is Rs 113.11 crore in four reports and Rs 114.54 crore in one; EBITDA appears only in two of them. Figures are consolidated unless marked standalone, and derived numbers are marked “my calculation”.
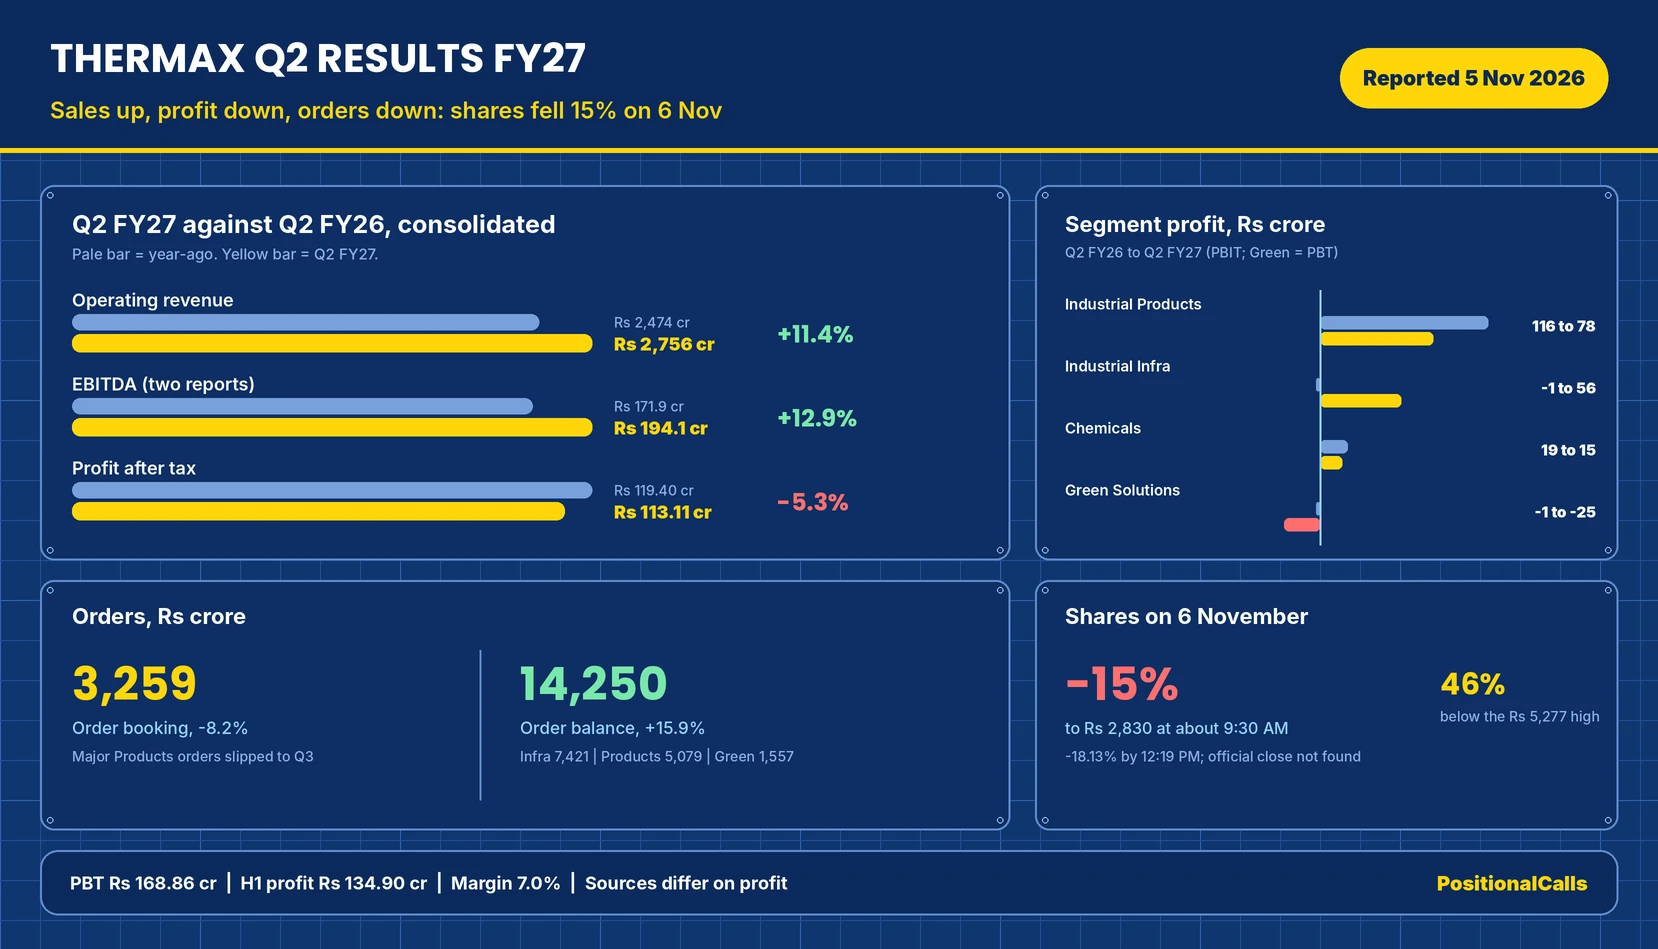
Thermax Q2 results FY27: what Thermax reported on 5 November
The Thermax Q2 results FY27 show consolidated operating revenue of Rs 2,756 crore (+11.4%), profit after tax of Rs 113.11 crore (-5.3%), EBITDA of Rs 194.1 crore (+12.9%, one report), order booking of Rs 3,259 crore (-8.2%) and an order balance of Rs 14,250 crore (+15.9%).
| Measure (consolidated) | Q2 FY27 | Q2 FY26 base | Q1 FY27 | Change on year |
|---|---|---|---|---|
| Operating revenue | Rs 2,755.9 crore | Rs 2,473.9 crore | Rs 2,303 crore | +11.4% (+19.7% on Q1) |
| EBITDA | Rs 194.1 crore | Rs 171.9 crore | Not found | +12.9%; margin 7.0% against 6.9% |
| Profit before tax (before exceptionals and associates) | Rs 168.86 crore | About Rs 174 crore | Rs 42.14 crore | -3.0% (my calculation) |
| Profit after tax | Rs 113.11 crore | Rs 119.40 crore | Rs 21.79 crore | -5.3% (+419% on Q1) |
| Order booking | Rs 3,259 crore | Rs 3,551 crore | Rs 2,809 crore | -8.2% (my calculation) |
| Order balance | Rs 14,250 crore | Rs 12,300 crore | Rs 14,045 or 14,018 crore | +15.9% (see order section) |
Cite this table: PositionalCalls, “Thermax Q2 FY27 Results Table, as of 8 November 2026”.
The Thermax Q2 results FY27 are a split quarter. Sales grew faster than the 3% to 10% “in line” band in the preview post, but profit fell and bookings shrank. The half-year ties exactly: Q1 profit of Rs 21.79 crore plus Q2 profit of Rs 113.11 crore is Rs 134.90 crore, the half-year figure in the Investywise summary, and Q1 profit before tax of Rs 42.14 crore plus Q2 of Rs 168.86 crore is Rs 211.00 crore (my calculation). That tie also settles the profit figure: Rs 113.11 crore is the one that adds up, so the Rs 114.54 crore in one report is not used. The rest of this page covers the profit bases, the margin, the four segments, the order book, the grading of the preview and the price fall.
Thermax Q2 FY27 profit: Rs 113.11 crore against Rs 119.40 crore
Consolidated profit after tax was Rs 113.11 crore, down 5.3% from Rs 119.40 crore; one report shows Rs 114.54 crore against Rs 119.66 crore, and standalone profit rose 16% to about Rs 263 crore, so always label the basis.
| Basis | Q2 FY27 | Q2 FY26 | Change | Source |
|---|---|---|---|---|
| Consolidated PAT (used here) | Rs 113.11 crore | Rs 119.40 crore | -5.3% | Business Standard, Kotak Neo, Investywise |
| Consolidated PAT (alternative) | Rs 114.54 crore | Rs 119.66 crore | -4.3% (my calculation) | Whalesbook |
| Rounded headline | Rs 1.15 billion | Rs 1.2 billion | -5% | Sahi; Rs 1.15 billion is Rs 115 crore, not 113 |
| Standalone PAT | Rs 263 crore | Rs 226 crore | +16% | Investywise; Whalesbook gives Rs 262.50 crore |
| Standalone revenue | Rs 1,712 crore | Rs 1,510 crore | +13% | Investywise; Whalesbook Rs 1,711.63 crore |
Cite this table: PositionalCalls, “Thermax Q2 FY27 Profit Bases, as of 8 November 2026”.
The Thermax Q2 results FY27 profit has two layers. Consolidated profit fell while standalone profit rose, because the group figure carries the subsidiaries and Green Solutions, where the quarter’s loss sits. I treat Rs 113.11 crore as correct for three reasons: four reports show it, its Q2 FY26 base of Rs 119.40 crore matches the preview, and it adds up to the half-year figure. The Whalesbook pair of Rs 114.54 crore and Rs 119.66 crore is internally consistent, but it does not match the half-year sum, so I cannot reconcile it.
The step from profit before tax to profit after tax is not shown. Total income of Rs 2,837.66 crore less total expenses of Rs 2,668.80 crore is Rs 168.86 crore, exactly the profit before tax (before exceptional items and associates) in the Investywise summary, but Rs 113.11 crore is Rs 55.75 crore lower (my calculation). That gap holds the Rs 15 crore impairment, tax and any share of associates, and the reports do not split it. Margins at the profit level moved down: profit before tax was 6.1% of revenue against 7.0%, and profit after tax was 4.1% against 4.8% (Multibagg; my division agrees).
Thermax EBITDA margin Q2 FY27: 7.0%, but from one report
Business Standard and Kotak Neo give EBITDA of Rs 194.1 crore, up 12.9%, at a 7% margin, 9 basis points higher; the other four reports do not give EBITDA, so I treat it as a two-source figure that I could not tie to the filing.
| Line | Q2 FY27 | Q2 FY26 | Check |
|---|---|---|---|
| EBITDA | Rs 194.1 crore | Rs 171.9 crore | +12.9%, matches the reports |
| EBITDA margin | 7.04% (my calculation) | 6.95% (my calculation) | Reported as 7%, +9 bps |
| Profit before tax margin | 6.1% | 7.0% | 168.86 over 2,755.87 is 6.13% |
| Profit after tax margin | 4.1% | 4.8% | 113.11 over 2,755.87 is 4.10% |
| Impairment provision | Rs 15 crore | None | Hybrid renewable energy project, Green Solutions |
Cite this table: PositionalCalls, “Thermax EBITDA Margin Q2 FY27 Table, as of 8 November 2026”.
In the Thermax Q2 results FY27, Thermax EBITDA margin Q2 FY27 is the line the preview post asked readers to check against 6.9%. At 7.04% it is just above that mark, and at the bottom edge of the preview’s 7% to 9% “in line” band, while EBITDA of Rs 194.1 crore is 3.2% above the Rs 188 crore of the preview’s scenario with 10% revenue growth and a 6.9% margin (my calculation). So the margin did not recover; it only held, on 11.4% more sales. Management attributed the lower profit to an adverse product mix and higher input costs in Industrial Products, according to Business Standard and Kotak Neo, and ICICI Securities noted higher raw material and employee costs.
On the impairment, the reports disagree on the label. Whalesbook calls the Rs 15 crore provision an exceptional item, while Multibagg, citing the presentation, says there were no exceptional items in either quarter and reports the impairment separately. I show both and size no adjusted profit, since the tax effect is not given.
Thermax segments in Q2 FY27: Infra turned profitable, Products and Green Solutions weakened
Industrial Infra profit before interest and tax swung to Rs 56 crore from a Rs 1 crore loss, but Industrial Products fell to Rs 78 crore from Rs 116 crore and Green Solutions lost Rs 25 crore against Rs 1 crore, per Multibagg’s reading of the presentation.
| Segment | Sales Q2 FY27 | Sales Q2 FY26 | Profit Q2 FY27 | Profit Q2 FY26 | Margin |
|---|---|---|---|---|---|
| Industrial Products | Rs 1,303 crore (+10.3%) | Rs 1,181 crore | PBIT Rs 78 crore | PBIT Rs 116 crore | 6.0% against 9.8% |
| Industrial Infra | Rs 1,006 crore (+13.5%) | Rs 886 crore | PBIT Rs 56 crore | PBIT loss Rs 1 crore | 5.6% against -0.1% |
| Chemicals | Rs 226 crore | Rs 191 crore | PBIT Rs 15 crore | PBIT Rs 19 crore | 6.5% against 9.8% |
| Green Solutions | Rs 288 crore | Rs 262 crore | PBT loss Rs 25 crore | PBT loss Rs 1 crore | -8.7% against -0.5% |
Cite this table: PositionalCalls, “Thermax Segment Table Q2 FY27, as of 8 November 2026”.
Segment margins tie to the profit and sales: 78 over 1,303 is 6.0%, 116 over 1,181 is 9.8%, 56 over 1,006 is 5.6% and 25 over 288 is 8.7% (my calculation). Chemicals gives 6.6% on my division against 6.5% reported, which is a rounding difference in the profit figure. The four segment sales add up to Rs 2,823 crore against operating revenue of Rs 2,756 crore, a Rs 67 crore difference that is probably inter-segment eliminations and other items (my reading; the reports do not say).
The pattern matters for the Thermax Q2 results FY27. Industrial Infra was the segment where one project cost the company Rs 91 crore in Q1; its Q2 profit of Rs 56 crore against a Rs 1 crore loss suggests that project did not hit again, although none of the reports I opened mention the project or its cost estimate, so I cannot confirm it. Half-year Industrial Infra PBIT is still a loss of Rs 12 crore against a profit of Rs 89 crore a year ago, and Green Solutions’ half-year loss widened to Rs 45 crore from Rs 13 crore (Multibagg). Industrial Products, the largest segment, saw margin fall by 3.8 points.
In the Thermax Q2 results FY27, the segment order books show where the backlog sits. Industrial Infra holds Rs 7,421 crore (up 26%), Industrial Products Rs 5,079 crore (up 4%) and Green Solutions Rs 1,557 crore (up 18%), and the Chemicals balance was not shown. Industrial Infra’s two captive power plant orders support its balance, while Industrial Products bookings fell 23% with major orders deferred to Q3, so the segment with the margin problem also has the slowest backlog growth (my reading).
PositionalCalls WhatsApp channel
Thermax and industrial results on WhatsApp
- Profit basis and one-offs stated for each result
- Conflicts between sources shown, not hidden
- The next company on the results calendar
Thermax order book Q2 FY27: Rs 14,250 crore, booking down 8.2%
The Thermax order book Q2 FY27 stands at Rs 14,250 crore, up 15.9% on year, while order booking was Rs 3,259 crore, down 8.2%, mainly because major Industrial Products orders were deferred to Q3 according to the company.
| Line | Q2 FY27 | Change | Note |
|---|---|---|---|
| Consolidated order booking | Rs 3,259 crore | -8.2% on Rs 3,551 crore | Base from the preview; reports say -8% |
| Consolidated order balance | Rs 14,250 crore | +15.9% on Rs 12,300 crore | Q1 balance Rs 14,045 or 14,018 crore |
| Industrial Infra | Booking Rs 1,523 crore; balance Rs 7,421 crore | +5% and +26% | Two captive power plant orders |
| Industrial Products | Booking Rs 1,237 crore; balance Rs 5,079 crore | -23% and +4% | Major orders deferred to Q3 |
| Green Solutions | Booking Rs 279 crore; balance Rs 1,557 crore | -9% and +18% | Reporting-method change affects the comparison |
Cite this table: PositionalCalls, “Thermax Order Book Q2 FY27 Table, as of 8 November 2026”.
In the Thermax Q2 results FY27, three of the order lines tie, and two do not. Booking down 8.2% and balance up 15.9% both agree with the reported rounded figures. The segment balances add up to Rs 14,057 crore (7,421 plus 5,079 plus 1,557), which is Rs 193 crore short of Rs 14,250 crore, and the Multibagg summary does not show a Chemicals balance, so the gap is plausibly Chemicals and other lines (my reading). Segment bookings add up to Rs 3,039 crore, Rs 220 crore short of Rs 3,259 crore, for the same reason. The Q1 balance does not tie across sources: the preview used Rs 14,045 crore, but Multibagg gives Rs 14,018 crore, a Rs 27 crore difference, so the rise on Q1 is 1.5% or 1.7% depending on which is right (my calculation).
The company said a reporting-method change lifted the Green Solutions book by Rs 197 (Business Standard; unit not stated) without affecting contracts, revenue recognition or results. As the preview warned about the earlier Rs 139 crore change, read balance growth with that in mind.
Thermax Q2 results FY27 against the preview marks
Against the preview’s marks, revenue growth read stronger, EBITDA, margin and profit read in line, order booking read weaker, and the profit sat near the Rs 119 crore mark that would show the project overrun did not repeat.
| Preview mark | What the preview said | What was reported | Reading |
|---|---|---|---|
| Board date | 5 November, from one weekly list | Results announced on 5 November | Confirmed |
| Revenue growth | Above 10% stronger; 3% to 10% in line | +11.4% | Stronger |
| EBITDA | Rs 170 to 230 crore in line | Rs 194.1 crore (two reports) | In line |
| EBITDA margin | 7% to 9% in line; below 6.9% weaker | 7.04% | In line, at the bottom edge |
| Net profit | Rs 80 to 150 crore in line | Rs 113.11 crore | In line |
| Profit against bases | Rs 119 crore base; Q1 Rs 21.79 crore | -5.3% on year; +419% on Q1 | Near the year-ago base |
| Order booking growth | Negative is weaker | -8.2% | Weaker |
| Order balance | Hold above Rs 14,000 crore | Rs 14,250 crore | Held |
| Project cost estimate | Watch for another revision | Infra PBIT Rs 56 crore; project not mentioned | No repeat visible; not confirmed |
| Consensus | None found | None found in the reports | No bar to compare with |
Cite this table: PositionalCalls, “Thermax Q2 FY27 Preview-to-Result Table, as of 8 November 2026”.
The preview’s guide graded almost every mark stronger or in line, yet the stock fell 15% or more on the next session. My reading, not stated in any report, is that the guide was built from a weak base, so an in-line grade is not the same as meeting what buyers had priced in. The preview also noted that Q1 profit explained by one project meant the Q2 notes on cost estimates mattered more than revenue growth. That held: revenue grew 11.4% yet profit fell, and the reports point to input costs and product mix, not the Q1 project.
Thermax fell as much as 15% to Rs 2,830 on the BSE by about 9:30 AM on 6 November and was down 18.13% at 12:19 PM, while ICICI Securities called the operating performance weak; no rating or target was given, and I found no official close.
| Item | Level or view | Source and note |
|---|---|---|
| 6 Nov, about 9:30 AM | Rs 2,830, -15% | Business Standard (BSE); Sensex +0.19% at 79,459 |
| 6 Nov, 12:19 PM | -18.13%; level not stated | Kotak Neo, published 1:39 PM |
| Previous close (derived) | About Rs 3,329 | Not reported; 2,830 over 0.85 is 3,329 (my calculation) |
| Level at -18.13% (derived) | About Rs 2,726 | My calculation; below the 52-week low of Rs 2,744.20 if the derived close is right |
| 52-week high and low | Rs 5,277 (29 Jun 2026); Rs 2,744.20 (8 Dec 2025) | Business Standard; the fall from the high is 46% |
| Official 6 Nov close | Not found | No source gave it |
| ICICI Securities | Weak operating performance; no rating or target given | Business Standard |
| After Q1 FY27 (31 Jul) | Rs 3,925.50, -7.67% at 11:26 AM | Angel One, as cited in the preview |
Cite this table: PositionalCalls, “Thermax Share Price Fall After Q2 FY27 Table, as of 8 November 2026”.
After the Thermax Q2 results FY27, the Thermax share price fall Q2 is large and still unsettled in the sources I found. Business Standard said the stock was near its 52-week low and called the operational performance weak. If the derived previous close of about Rs 3,329 is right, the 18.13% fall in Kotak Neo’s 12:19 PM note would put the stock near Rs 2,726, below the December 2025 low (my calculation, not a reported level). Over the Q1 and Q2 reactions the stock moved from about Rs 4,252 before Q1 (derived from the 7.67% fall to Rs 3,925.50) to about Rs 3,329 before Q2 and Rs 2,830 at 9:30 AM, which is a long slide before this result; the page cannot say why.
ICICI Securities listed key monitorables: operating margin recovery, Green Solutions profitability and fresh order inflows. It also said Industrial Infra turned profitable while Industrial Products and Chemicals profits declined. I found no other brokerage note, so there is no target to quote. See the Muhurat trading 2026 guide for the Sunday session and how the next regular session will be read.
Management commentary, new products and dividend
Management said revenue growth came from executing the order backlog in Industrial Products and Industrial Infra, that Industrial Products profit was hurt by mix and input costs, and that orders slipped because major Industrial Products orders were deferred to Q3.
- Operations: a compressed biogas plant ran above 21 tonnes a day in performance tests against a 20 tonne guarantee, and 17.1 MW of the FEPL Gujarat project (9.9 MW wind, 7.2 MW solar) is partly commissioned (Multibagg).
- Orders: a 14 tonne an hour biomass boiler order at Nanjangud, estimated to save about 26,000 tonnes of CO2 a year (Multibagg).
- Products: the Thermax-i series of intelligent boilers and heaters launched at Boiler India 2026; the first product, UltraPac-i, showed fuel savings of up to 10% in pilot installations, which is a company claim (Investywise).
- Cash: cash and investments of Rs 3,260 crore, up 20% (Multibagg).
- Dividend: none of the reports I opened mentions a dividend; confirm on the BSE or NSE announcement page.
The commentary supports the order-backlog story in the Thermax Q2 results FY27 but gives no margin or order guidance for Q3 in the reports I read. For how another industrial company reported the same quarter, see the Cummins India Q2 results FY27 and Exide Industries Q2 results FY27, and for steel, the Tata Steel Q2 results FY27 analysis. Different businesses, so only the method carries over.
What ties and what does not in the Thermax Q2 results FY27
Ten checks tie and four do not: the profit figure in one report, the Q1 order balance, the impairment label and the missing step from profit before tax to profit after tax.
Because of these gaps, any figure you quote from the Thermax Q2 results FY27 should carry its basis and source. The BSE and NSE filing and the investor presentation settle most of them and are free to read. Treat any message promising a sure-shot Thermax call as unreliable.
Risks to read with the Thermax Q2 results FY27
Analyst’s note on the Thermax Q2 results FY27
The Thermax Q2 results FY27 show sales and order balance growing while profit and bookings slip, which is exactly the gap the preview said to watch between revenue and margin.
- What stands out: revenue +11.4% and EBITDA +12.9%, yet profit after tax -5.3% and booking -8.2%.
- Easy to miss: Industrial Infra turned profitable while Industrial Products and Green Solutions weakened, so the group total hides opposite moves.
- What would change the view: a filing note that restates EBITDA, sizes the impairment’s tax effect or revises a project cost estimate.
- Caution: one quarter does not fix a long-term value, and no brokerage target after the results was found.
- Reader action: read segment margins and the order-booking note before the headline profit.
Bottom line
The Thermax Q2 results FY27 show profit after tax of Rs 113.11 crore (-5.3%) on revenue of Rs 2,756 crore (+11.4%), order booking down 8.2% and an order balance of Rs 14,250 crore. Industrial Infra turned profitable, Industrial Products and Green Solutions weakened, and the shares fell 15% to 18% on 6 November. No brokerage target after the results was found. Read the segment notes and the project cost notes in the filing and speak to a registered adviser before acting.
Next read: the preview post for the marks set before the results.
Part of the Earnings series.
PositionalCalls WhatsApp channel
Never miss a results update
- Same-day decoders with the numbers sourced
- Corrections posted openly when a number changes
- Plain-language risk notes
Thermax Q2 results FY27: frequently asked questions
What are the Thermax Q2 results FY27?
Thermax reported consolidated operating revenue of Rs 2,756 crore (+11.4%) and profit after tax of Rs 113.11 crore (-5.3%) for the quarter ended 30 September 2026, announced on 5 November 2026. Order booking was Rs 3,259 crore, down 8.2%.
What is Thermax’s Q2 FY27 profit, Rs 113 crore or Rs 114.54 crore?
Use Rs 113.11 crore. Four reports show it, and it adds up with Q1’s Rs 21.79 crore to the half-year Rs 134.90 crore. Whalesbook shows Rs 114.54 crore against a Rs 119.66 crore base, which I could not reconcile.
What were Thermax’s EBITDA and margin in Q2 FY27?
Business Standard and Kotak Neo give EBITDA of Rs 194.1 crore, up 12.9%, at a margin of about 7%, up 9 basis points. The other reports do not give EBITDA, so confirm it in the filing.
Business Standard called the operating performance weak, and ICICI Securities said revenue growth did not turn into earnings growth because of higher costs and adverse mix, with continuing Green Solutions losses. These are reported views, not mine.
The shares fell as much as 15% to Rs 2,830 by about 9:30 AM (Business Standard) and were down 18.13% at 12:19 PM (Kotak Neo). I did not find the official close, and the previous close of about Rs 3,329 is my derivation.
What is the Thermax order book after Q2 FY27?
The consolidated order balance is Rs 14,250 crore, up 15.9% on year. Order booking was Rs 3,259 crore, down 8.2%, as major Industrial Products orders were deferred to Q3, the company said.
How did Thermax’s segments perform in Q2 FY27?
Industrial Infra profit before interest and tax was Rs 56 crore against a Rs 1 crore loss. Industrial Products fell to Rs 78 crore from Rs 116 crore, Chemicals to Rs 15 crore from Rs 19 crore, and Green Solutions lost Rs 25 crore.
Did the Q1 project overrun repeat in Q2?
None of the reports I opened mentions the Industrial Infra project or its cost estimate. Infra profit improved to Rs 56 crore, which suggests no repeat, but this is not confirmed; check the filing notes.
Did Thermax declare a dividend with its Q2 FY27 results?
None of the reports I opened mentions a dividend. Confirm on the BSE or NSE announcement page, because an interim dividend would be stated in the board outcome.
Does this page give a Thermax buy or sell call?
No. This is research and education, not advice. PositionalCalls.com is not a SEBI-registered research analyst or investment adviser. Use the numbers to frame questions and speak to a registered adviser before investing.
Sources
- Business Standard, 6 November 2026 (price fall, EBITDA, margin, orders, ICICI Securities view)
- Kotak Neo, 6 November 2026, 1:39 PM (price at 12:19 PM, EBITDA, profit)
- Whalesbook (profit Rs 114.54 crore, standalone, impairment)
- Investywise, 5 November 2026 (income, expenses, half-year, standalone, orders)
- Multibagg, 5 November 2026, 7:50 PM (segments, order balances, margins)
- Sahi, 5 November 2026, 10:03 PM (profit and PBT headline)
- Free Press Journal (30 July 2026) and Angel One (31 July 2026) on Q1 FY27, as cited in the preview post.
- BSE and NSE announcement pages and the Thermax investor presentation: where the filing is published (I did not open them).
Disclosure: PositionalCalls.com is not a SEBI-registered research analyst or investment adviser. Investments in securities markets are subject to market risks. Read all related documents carefully before investing. Returns are never guaranteed. PositionalCalls is an independent Indian stock market research and education site founded by Shubham Chaudhary. This page is results analysis and not a recommendation, target or investment advice. How I researched this: I compared six press and data-platform reports of the filing, tied the half-year profit, income, expenses, segment margins and order lines, recomputed every derived number, and listed the conflicts openly. I did not open the filing.

Shubham Chaudhary is the founder of PositionalCalls, an independent Indian stock market research website. He writes company fundamentals, quarterly results analysis, IPO analysis and sector research for NSE and BSE listed companies, with a focus on banking stocks, insurance and long-term value investing. Every article is built from primary sources such as RBI, SEBI, NSE and BSE filings and company annual reports, and states its risks plainly in simple language for retail investors.
Coverage areas Our research standards- Numbers checked against NSE, BSE and SEBI filings
- Risks and limits stated in every article
- No paid promotions or broker tie-ups
- Articles updated when new filings arrive