
Earnings · Adani Power
Adani Power reported a 141% jump in profit for the September quarter. This page separates the one-offs from the underlying numbers, so you can see what actually grew, what the stock has done and what to watch next.
Quick answer
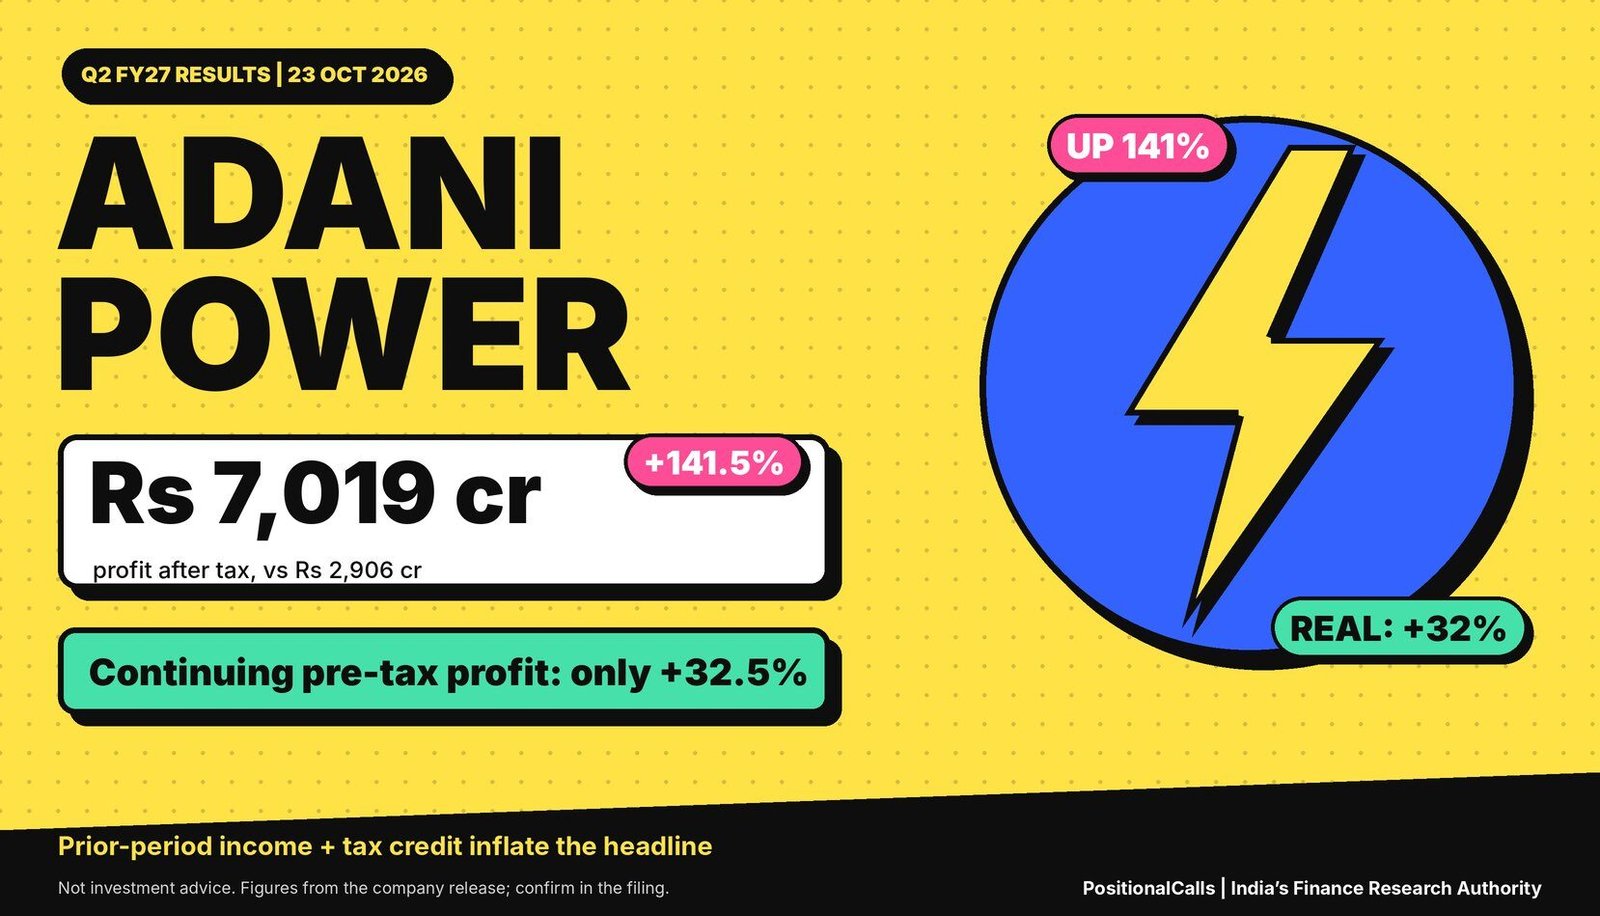
Adani Power Q2 results FY27: Adani Power reported profit of Rs 7,019 crore (+141.5%), but Rs 2,422 crore of prior-period revenue and a tax credit inflate it. Continuing pre-tax profit rose a more modest 32.5% to Rs 4,370 crore. Results came on 23 October 2026.
Latest update (Thursday, 5 November 2026, 4:45 PM IST): Adani Power reported on Friday, 23 October 2026 and held its analyst call on Monday, 26 October. The stock was near Rs 204 at the 5 November close, a gain of about 1.1% on the day by one page, and stood about 11.6% above its Rs 182.72 level on results day (my calculation). I could not find a clean, sourced price move for the first trading day after the results, so this page does not claim one. I will refresh the price and any new brokerage notes on Friday, 6 November.
Key takeaways
- Headline: Profit after tax was Rs 7,019.32 crore against Rs 2,906.46 crore, up 141.5%, on total income of Rs 19,950.60 crore (+39.4%).
- Underlying: Excluding prior-period items, continuing pre-tax profit was Rs 4,369.51 crore (+32.5%) and continuing EBITDA Rs 6,320.97 crore (+18.5%).
- One-offs: Prior-period revenue added Rs 2,422.25 crore, and the tax line swung to a Rs 230.60 crore credit from a Rs 1,059.74 crore charge.
- Margin: Continuing EBITDA margin fell to about 36.1% from 39.1% as fuel costs rose 41.8% on a 50% higher landed cost of imported coal (my calculation for the margin).
- Operations: Plant load factor rose to 70.1% from 62.8% and units sold to 26.4 billion from 23.7 billion; capacity stayed at 18,150 MW.
- Share price: The stock closed near Rs 204 on 5 November, about 11.6% above its Rs 182.72 level on results day, with a 52-week range of Rs 128.10 to Rs 254.20.
In plain words: Adani Power sells electricity, mostly from coal plants, to state utilities and on the open market. EBITDA is profit before interest, tax, depreciation and amortisation. “Prior-period” income is money booked now for earlier years, for example after a regulator revises a tariff. PLF (plant load factor) is how much of a plant’s capacity actually ran. “Continuing” is the company’s own label for results without prior-period items.
Data note: as of Thursday, 5 November 2026, 4:45 PM IST. The core figures come from the company’s own media release on adani.com, which I opened; I did not open the BSE filing or the investor presentation. Press reports use different revenue lines (Rs 17,528, 19,439 and 19,951 crore), a data platform shows profit as Rs 6,919 crore, and capacity is quoted as 18,110, 18,150 and 18,330 MW; each is named where it appears. Price figures come from third-party pages, some with conflicting timestamps. Derived numbers are marked “my calculation”.
Adani Power Q2 results FY27: key numbers at a glance
Adani Power Q2 net profit FY27 is Rs 7,019 crore, up 141.5%, but continuing pre-tax profit rose 32.5% to Rs 4,370 crore, so most of the headline jump comes from one-offs.
| Consolidated, Rs crore | Q2 FY27 | Q2 FY26 | Change | Basis |
|---|---|---|---|---|
| Total income (reported) | 19,950.60 | 14,307.79 | +39.4% | Includes prior-period revenue |
| Total continuing revenue | 17,528.35 | 13,639.26 | +28.5% | Excludes prior-period items |
| EBITDA (reported) | 8,743.22 | 6,001.24 | +45.7% | Includes prior-period items |
| EBITDA (continuing) | 6,320.97 | 5,332.71 | +18.5% | Cleaner trend line |
| PBT (reported) | 6,791.76 | 3,966.20 | +71.2% | Before tax |
| PBT (continuing) | 4,369.51 | 3,297.68 | +32.5% | Cleaner trend line |
| Profit after tax | 7,019.32 | 2,906.46 | +141.5% | Headline |
Cite this table: PositionalCalls, “Adani Power Q2 Results Key Numbers Table, as of 5 November 2026”.
These Adani Power Q2 results FY27 are for the quarter ended 30 September 2026, approved by the board on 23 October 2026. Confirm the filing on the BSE website. For other large companies in the same window, see the Q2 results calendar.
Is the 141% jump in the Adani Power Q2 results FY27 real? The profit bridge
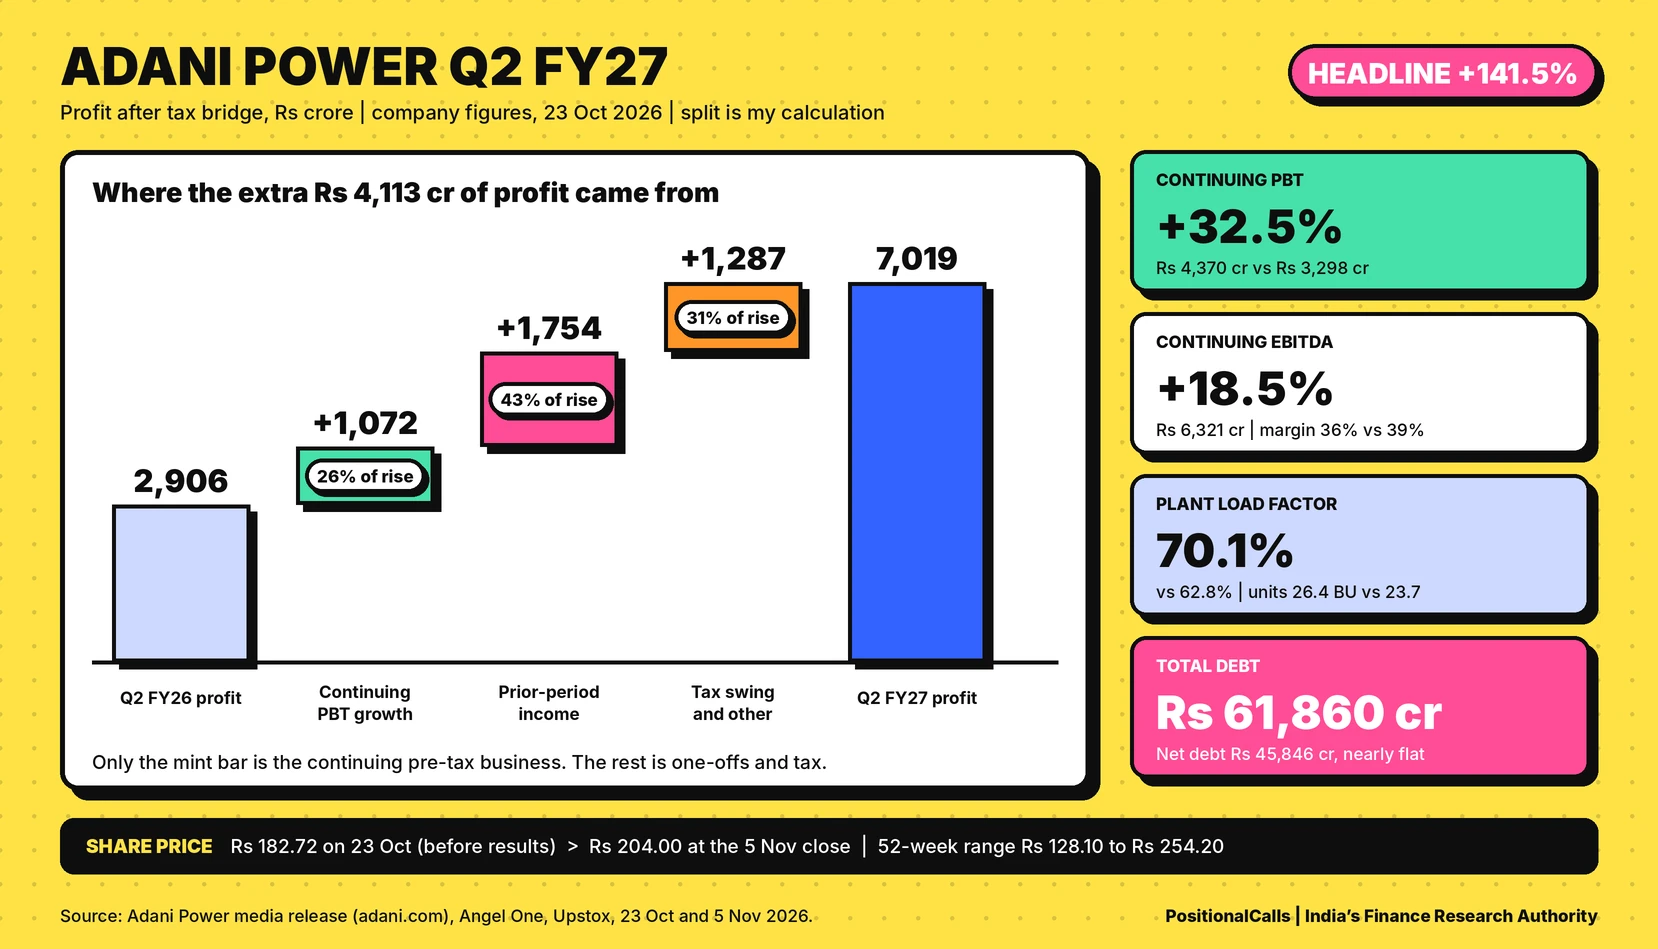
Only about 26% of the Rs 4,113 crore rise in Adani Power’s profit came from higher continuing pre-tax profit; about 43% came from more prior-period income and about 31% from the tax swing (my calculation).
| Step | Rs crore | Share of the rise | Source or calculation |
|---|---|---|---|
| Q2 FY26 profit after tax | 2,906.46 | – | Company |
| Higher continuing PBT | +1,071.83 | 26.1% | 4,369.51 less 3,297.68 |
| Higher prior-period income | +1,753.72 | 42.6% | 2,422.25 less 668.53 |
| Tax swing (charge to credit) | +1,290.34 | 31.4% | Charge of 1,059.74 became a credit of 230.60 |
| Associate share (Jaiprakash Power Ventures) | -3.04 | – | Company |
| Q2 FY27 profit after tax | 7,019.32 | 100% of the rise is 4,112.86 | Steps add up to the reported figure |
Cite this table: PositionalCalls, “Adani Power Q2 Results Profit Bridge, as of 5 November 2026”.
Illustration only: if Q2 FY27 continuing PBT of Rs 4,369.51 crore were taxed at last year’s effective rate of 26.7% (1,059.74 on 3,966.20), profit would be about Rs 3,202 crore, less than half of the reported Rs 7,019 crore (my calculation, not a company figure). On the same basis Q2 FY26 would be about Rs 2,417 crore, so the like-for-like growth is the same 32.5% as continuing PBT.
None of this means the Adani Power Q2 results FY27 were weak. Continuing pre-tax profit grew a third, which is strong for a power company. It means the 141.5% headline is not a run rate, and anyone projecting next quarter from it will overshoot.
What is the one-time income in the Adani Power Q2 results FY27?
Adani Power Q2 one-time income and credits are Rs 2,422.25 crore of prior-period revenue from revised historic energy charges, a Rs 1,211.43 crore reversal of earlier-year tax and a Rs 459.15 crore deferred tax credit.
| Item | Q2 FY27 | Q2 FY26 | H1 FY27 | H1 FY26 |
|---|---|---|---|---|
| Prior-period revenue (company) | 2,422.25 | 668.53 | 3,808.60 | 1,074.74 |
| Tax reversal for earlier years | 1,211.43 | – | n/a | – |
| Deferred tax credit | 459.15 | – | n/a | – |
| Net tax line (charge) or credit | Credit 230.60 | Charge 1,059.74 | Charge 1,320.98 | Charge 1,958.92 |
Cite this table: PositionalCalls, “Adani Power Q2 Results One-Off Items, as of 5 November 2026”.
The prior-period revenue is mainly the result of revised historic energy charges under certain power purchase agreements (company release). It flows straight to profit before tax: reported PBT less continuing PBT is Rs 2,422.25 crore, exactly the prior-period amount (my calculation). One report ties the Rs 1,211.43 crore tax reversal to the merger of 10 wholly owned subsidiaries; others describe it as relating to earlier years.
If the two tax credits (Rs 1,670.58 crore together) are removed from the net credit of Rs 230.60 crore, the implied tax before them is about Rs 1,439.98 crore, or 21.2% of reported PBT (my inference from the items listed, not a disclosed figure). The first-half prior-period total of Rs 3,808.60 crore means about Rs 1,386.35 crore arrived in Q1 FY27 (my calculation).
Which revenue figure is right in the Adani Power Q2 results FY27? Rs 17,014, 17,528, 19,439 or 19,951 crore
All four are correct for different definitions: Rs 17,014.06 crore continuing operating revenue, Rs 17,528.35 crore total continuing revenue, Rs 19,438.68 crore reported revenue from operations and Rs 19,950.60 crore total income.
| Revenue line | Q2 FY27 | Q2 FY26 | Change | Where it appears |
|---|---|---|---|---|
| Continuing operating revenue | 17,014.06 | 13,106.34 | +29.8% | Company release |
| Total continuing revenue (adds other income) | 17,528.35 | 13,639.26 | +28.5% | Company release; Business Today |
| Revenue from operations (reported) | 19,438.68 | 13,456.84 | +44.5% | Free Press Journal, filing-based |
| Total income (reported) | 19,950.60 | 14,307.79 | +39.4% | Company release; Angel One |
Cite this table: PositionalCalls, “Adani Power Q2 Results Revenue Definitions, as of 5 November 2026”.
The lines reconcile: total reported revenue less total continuing revenue is Rs 2,422.25 crore, the prior-period amount (my calculation). Headlines that say revenue rose 44% are using reported revenue from operations; headlines that say 39% use total income; the clean like-for-like growth is 28.5% to 29.8%. One summary says revenue of Rs 19,439 crore is up 29.82%, which mixes the reported amount with the continuing growth rate, so I do not use it.
In the Adani Power Q2 results FY27, other income was Rs 514.29 crore on the continuing basis against Rs 532.92 crore, down 3.5%, so the growth is not coming from treasury or other income.
Adani Power Q2 EBITDA: why the margin fell even as profit jumped
Continuing EBITDA rose 18.5% to Rs 6,320.97 crore while continuing revenue rose 28.5%, so the continuing margin slipped to about 36.1% from 39.1%; reported EBITDA of Rs 8,743.22 crore (+45.7%) includes the one-off.
| EBITDA measure | Q2 FY27 | Q2 FY26 | Change | Margin on revenue (my calculation) |
|---|---|---|---|---|
| Reported EBITDA | 8,743.22 | 6,001.24 | +45.7% | 43.8% vs 41.9% of total income |
| Continuing EBITDA | 6,320.97 | 5,332.71 | +18.5% | 36.1% vs 39.1% of total continuing revenue |
| Fuel cost | 10,229.38 | 7,216.23 | +41.8% | 60.1% vs 55.1% of continuing operating revenue |
| Finance costs | 760.23 | 841.63 | -9.7% | Lower interest bill |
Cite this table: PositionalCalls, “Adani Power Q2 Results EBITDA and Fuel Cost, as of 5 November 2026”.
The company attributes the fuel cost rise to higher volumes and a 50% higher landed cost of imported coal. Fuel took about 60% of continuing operating revenue against 55% a year ago, which is the main squeeze (my calculation). A 44% margin quoted in one summary does not match its own figures (Rs 8,743 crore on Rs 19,439 crore is about 45%), so I show the margins I computed with the denominator named.
Against Q1 FY27 the trend is softer: first-half continuing EBITDA of Rs 13,303.71 crore less Q2 leaves about Rs 6,982.74 crore for Q1, so Q2 is about 9.5% lower sequentially, and continuing PBT is about 11.1% lower (my calculation). Units sold also fell from about 28.7 billion in Q1 to 26.4 billion in Q2, which fits a seasonal dip.
How did plants perform in the Adani Power Q2 results FY27? PLF, volumes and tariffs
Adani Power’s PLF rose to 70.1% from 62.8% and units sold rose 11.4% to 26.4 billion, with PPA sales up 29.7% at Rs 6.4 per kWh and merchant volumes down 43%.
| Operating metric | Q2 FY27 | Q2 FY26 | H1 FY27 | H1 FY26 |
|---|---|---|---|---|
| Operating capacity (MW) | 18,150 | 18,150 | 18,150 | 18,150 |
| PLF | 70.1% | 62.8% | 74.1% | 64.8% |
| Units sold (billion units) | 26.4 | 23.7 | 55.1 | 48.3 |
| PPA sales | 23.4 BU (+29.7%) | – | – | – |
| PPA tariff, continuing basis | Rs 6.4/kWh (+12.7%) | – | – | – |
| Merchant and short-term realisation | Rs 7.2/kWh (+33.1%) | – | – | – |
Cite this table: PositionalCalls, “Adani Power Q2 Results Operating Metrics, as of 5 November 2026”.
In the Adani Power Q2 results FY27, volume growth shifted from the open market to contracts: merchant volumes fell 43% as open capacity moved into medium-term contracts, while merchant prices were much higher. National context from the release: demand 502 billion units (+11.5%), peak demand 270 GW (+18%), and IEX day-ahead prices Rs 5.7 per unit (+46%).
Capacity is quoted three ways: 18,150 MW in the release table, 18,110 MW in its “About” section and 18,330 MW in two press reports. The release excludes the 180 MW Churk plant, which is being revived. Use the table figure and check the presentation.
How do the Adani Power Q2 results FY27 compare with Q1 FY27 and the first half?
Adani Power Q2 net profit FY27 rose 44.2% from Rs 4,866.60 crore in Q1, but that is driven by one-offs; continuing EBITDA fell about 9.5% and continuing PBT about 11% from Q1 (my calculation).
| Rs crore | Q2 FY27 | Q1 FY27 | H1 FY27 | H1 FY26 |
|---|---|---|---|---|
| Profit after tax | 7,019.32 | 4,866.60 | 11,885.92 | 6,211.59 |
| Revenue from operations (reported) | 19,438.68 | 18,901.89 | 38,340.57 | 27,565.99 |
| Continuing EBITDA | 6,320.97 | about 6,982.74 | 13,303.71 | 11,076.33 |
| Continuing PBT | 4,369.51 | about 4,914.15 | 9,283.66 | 7,095.77 |
| Prior-period revenue | 2,422.25 | about 1,386.35 | 3,808.60 | 1,074.74 |
Cite this table: PositionalCalls, “Adani Power Q2 Results Sequential and H1 Table, as of 5 November 2026”.
Half-year profit after tax was Rs 11,885.92 crore, up 91.4%, and half-year continuing PBT grew 30.8%, so the underlying growth has been steady at about 30% in both quarters. Business Today gives Q1 FY27 profit as Rs 4,806 crore; the half-year less Q2 gives Rs 4,866.60 crore, matching the Free Press Journal, so I use the latter.
What does debt look like in the Adani Power Q2 results FY27?
Adani Power’s total debt rose to Rs 61,860 crore from Rs 53,556 crore at March, while net debt was nearly flat at Rs 45,846 crore, and CARE and India Ratings upgraded it to AA+.
| Debt measure, Rs crore | 30 Sep 2026 | 31 Mar 2026 | Change |
|---|---|---|---|
| Total debt | 61,860.37 | 53,555.54 | +15.5% |
| Net debt | 45,845.92 | 45,022.02 | +1.8% |
| Implied cash and equivalents (my calculation) | 16,014.45 | 8,533.52 | +88% |
| Debt to equity (Angel One) | 0.79x | n/a | – |
| Interest service coverage (Angel One) | 8.86x | n/a | – |
Cite this table: PositionalCalls, “Adani Power Q2 Results Debt Table, as of 5 November 2026”.
Borrowing went up by about Rs 8,305 crore in six months while net debt barely moved, so most of the new debt is sitting as cash for the expansion (my inference). Net debt of Rs 45,846 crore is about 1.7 times twice the first-half continuing EBITDA, a rough annualisation that ignores seasonality (my calculation). Finance costs fell 9.7% to Rs 760.23 crore.
PositionalCalls WhatsApp channel
Adani group, power and the next big results
- One-offs separated from the underlying number, the same day
- Which revenue and EBITDA line each report uses, flagged clearly
- Price moves and brokerage views the day they appear
What is in Adani Power’s expansion pipeline?
In the Adani Power Q2 results FY27, the company confirmed plans for 23,720 MW of new capacity, with power sales agreements covering 62% of it, led by Korba Phase-II, Mahan Phase-II and four other thermal projects.
| Project | Capacity | Status in the release |
|---|---|---|
| Korba Phase-II | 1,320 MW | First 660 MW unit synchronised, commissioning expected shortly; second unit Q4 FY27 |
| Mahan Phase-II | 1,600 MW | Full commissioning expected early FY2027-28 |
| Raipur Phase-II and Raigarh Phase-II | 1,600 MW each | Over 65% complete; commissioning FY2028-29 |
| Mirzapur, Mahan Phase-III, Anuppur | 1,600, 1,600 and 2,400 MW | Under execution |
| Raipur Phase-III | 1,600 MW | Supplies a 1,600 MW agreement signed with MSEDCL in July 2026 |
| Capex | Not given | The release gives no rupee capex; Business Today cites about Rs 2 lakh crore by FY32 (single source) |
Cite this table: PositionalCalls, “Adani Power Q2 Results Expansion Pipeline, as of 5 November 2026”.
Sixty-two percent of 23,720 MW is about 14.7 GW tied up (my calculation), against 55% (13.3 GW) in a pre-results note, so tie-ups progressed. Jefferies lists delays and funding as watch points, and Elara trimmed FY27 earnings estimates for capacity-addition delays, as reported.
What deals and approvals came with the Adani Power Q2 results FY27?
Adani Power was named the successful applicant for GVK Energy’s 330 MW Alaknanda hydro plant, won a 25-year agreement for 1,320 MW in Uttarakhand, and merged 10 subsidiaries effective 25 September 2026.
| Item | What the release says |
|---|---|
| GVK Energy (Alaknanda) | Selected as successful resolution applicant; 330 MW hydro in Uttarakhand, the company’s entry into hydro |
| Uttarakhand PSA | Letter of award for a 25-year agreement for 1,320 MW (1,234 MW net) supercritical thermal capacity |
| Bhutan: Chamkarchhu | 770 MW hydro project with Druk Green Power, Adani Power holding 49%; second project after the 570 MW Wangchhu |
| Amalgamation | 10 wholly owned subsidiaries merged into Adani Power, effective 25 September 2026 |
| Credit ratings | CARE and India Ratings upgraded to AA+ (Stable) from AA (Stable) |
| Dividend | None reported in the sources I read |
Cite this table: PositionalCalls, “Adani Power Q2 Results Corporate Actions, as of 5 November 2026”.
In the Adani Power Q2 results FY27, the merger matters for reading the accounts: the tax reversal reported in the quarter is linked in one report to the amalgamation, which is a one-time effect and not a recurring benefit.
Adani Power was Rs 182.72 at 3:00 PM on results day, 23 October, rose with the Adani group by 3% to 5% on 29 October, and closed near Rs 204 on 5 November, but I found no sourced first-day move after the results.
| Date and time (IST) | Reported price or move | Source type |
|---|---|---|
| Mon 19 Oct, 3:29 PM | Rs 194.08 (NSE) | ad-hoc-news |
| Fri 23 Oct, 3:00 PM | Rs 182.72, down 1.38%; results published after this | Angel One |
| Mon 26 Oct | Analyst call; price move not found | Company schedule |
| Thu 29 Oct | Adani Power among group stocks up 3% to 5%; no individual level | Business Standard |
| Wed 4 Nov close | Rs 201.71 | Upstox page |
| Thu 5 Nov, 10:11 AM | Rs 205.30, up about 2% | Business Today |
| Thu 5 Nov, 3:59 PM | Rs 204.00, up 1.14%; page timestamps conflict | Upstox page |
Cite this table: PositionalCalls, “Adani Power Q2 Results Share Price Trail, as of 5 November 2026”.
From Rs 182.72 on results day to Rs 204.00 is about 11.6%, which mixes the results, the group-wide rally on 29 October and the wider market, so it is not a pure reaction to the quarter (my calculation). The 52-week range is Rs 128.10 to Rs 254.20: the price is about 20% below the high and about 59% above the low (my calculation). Market capitalisation is quoted as Rs 3.76 lakh crore on one page and Rs 3.95 lakh crore on another, so I leave it out.
PositionalCalls is not a SEBI-registered research analyst, so this page publishes no price targets or buy, sell or hold views.
What did brokerages say about Adani Power after the Q2 results?
A 5 November Business Today article cites Jefferies cutting its target to Rs 240 from Rs 270, Elara at Accumulate with Rs 220, and JM Financial at Buy with Rs 258; dates for each note are not given.
| Brokerage | Reported view | Reason given | Source |
|---|---|---|---|
| Jefferies | Target cut to Rs 240 from Rs 270; multiple 18x EV/EBITDA (Sept 2028E) from 20x | Sector de-rating on higher interest rates; risks: PPA issues, merchant price drop, Godda payment delays | Business Today, 5 Nov |
| Elara Securities | Accumulate, Rs 220 | Trimmed FY27 earnings for capacity-addition delays; says much of medium-term growth is priced in | Business Today; ad-hoc-news (target set 12 Oct) |
| JM Financial | Buy, Rs 258 (from Rs 255) | 18x Sept 2028E EV/EBITDA | Business Today, 5 Nov |
Cite this table: PositionalCalls, “Adani Power Q2 Results Brokerage Views, as Reported, as of 5 November 2026”.
These are other firms’ published views, reported as they appear and not endorsed by PositionalCalls. Because the Elara target pre-dates the results and the other notes carry no date, I cannot tell which reflect the Q2 numbers. Targets change often and are not a prediction.
What to watch in the Adani Power Q3 FY27 results
At Q3 FY27, read continuing EBITDA against Rs 6,321 crore, PLF against 70.1%, fuel cost as a share of revenue against 60%, and whether prior-period items repeat.
| What to read | Q2 FY27 mark | Question to ask |
|---|---|---|
| Continuing EBITDA | Rs 6,320.97 crore (36.1% margin) | Did the margin stabilise as coal costs eased? |
| Continuing PBT | Rs 4,369.51 crore | Is growth still about 30% year on year? |
| Prior-period items | Rs 2,422.25 crore | Is there another catch-up, and how large? |
| Tax line | Credit of Rs 230.60 crore | Did the effective rate return to the mid-20s? |
| PLF and units | 70.1%; 26.4 billion units | Did the winter demand lift volumes? |
| Debt and capex | Total debt Rs 61,860 crore | Did borrowing keep rising before new units start? |
| Korba Phase-II | First 660 MW unit synchronised | Was it commissioned on time? |
Cite this table: PositionalCalls, “Adani Power Q2 Results Decoder, as of 5 November 2026”.
No Q3 FY27 results date is confirmed as of Thursday, 5 November 2026, 4:45 PM IST. Check the board meeting notice on the exchange announcement pages.
What most people miss in the Adani Power Q2 results FY27
Most pages repeat the 141% profit growth; the details that change the picture are the prior-period income, the tax credit, the falling continuing margin and the softer sequential trend.
The Adani Power Q2 results FY27 alone need no action, and none of the sources I read reported a dividend, so check the exchange filing before assuming one.
- What you need: nothing special. The shares trade on NSE and BSE like any other listed stock.
- Tax angle: gains on sale are taxed under current rules. Check our guide to capital gains tax on shares or ask a tax adviser.
- NRI note: NRIs buy through a PIS account with limits that changed in 2026. See NRI investment in the Indian stock market.
- Costs: brokerage and demat charges vary, so check your broker’s current schedule.
- Scam warning: fake “results alert” groups and tip sellers use well-known group names. No genuine result needs your OTP or an app download.
Related: Adani Ports Q2 results FY27, Power Grid Q2 results FY27, Coal India Q2 results FY27 and Reliance Q2 results FY27. More in Earnings.
Analyst’s note
- What stands out: the Adani Power Q2 results FY27 carry a 141.5% profit headline that is mostly one-offs, on top of steady continuing growth of about a third before tax.
- Easy to miss: continuing margin down about 3 points and continuing EBITDA below Q1.
- What would change the view: the filing showing the prior-period amount is larger or recurring, or Q3 continuing EBITDA falling again.
- Caution: I opened the company release but not the exchange filing or presentation, and brokerage notes are undated.
- Reader action: compare continuing figures, open the filing and re-check the price on 6 November.
Bottom line
Adani Power’s underlying quarter was good, with continuing pre-tax profit up 32.5%, but the 141% headline is inflated by prior-period income and a tax credit, and the continuing margin and sequential trend softened. Compare continuing numbers, and confirm them in the filing.
Next read: the Q2 results calendar.
Part of the Earnings series.
PositionalCalls WhatsApp channel
Never miss a results-day update
- Same-day decoders for the biggest companies reporting
- Record dates and dividend amounts checked against filings
- Corrections posted openly when a number changes
Adani Power Q2 results FY27: frequently asked questions
When were the Adani Power Q2 results FY27 announced?
Adani Power announced its Q2 FY27 results on Friday, 23 October 2026 for the quarter ended 30 September 2026, with the analyst and investor call on Monday, 26 October 2026.
What was Adani Power’s net profit in Q2 FY27?
Profit after tax was Rs 7,019.32 crore, up 141.5% from Rs 2,906.46 crore. One data platform shows Rs 6,919 crore; the company release and filing-based reports show Rs 7,019.32 crore. Confirm in the exchange filing.
Why is Adani Power’s Q2 profit so high?
Because of one-offs: Rs 2,422.25 crore of prior-period revenue and a tax line that swung to a Rs 230.60 crore credit. Continuing pre-tax profit rose 32.5% to Rs 4,369.51 crore, which is the cleaner growth rate.
What was Adani Power’s revenue in Q2 FY27?
Total income was Rs 19,950.60 crore (+39.4%), revenue from operations Rs 19,438.68 crore (+44.5%) and continuing operating revenue Rs 17,014.06 crore (+29.8%). Pick the line that matches your comparison.
What was the Adani Power EBITDA and margin?
Reported EBITDA was Rs 8,743.22 crore (+45.7%) and continuing EBITDA Rs 6,320.97 crore (+18.5%). My calculation puts the continuing margin at about 36.1% against 39.1% a year ago.
What were Adani Power’s PLF and units sold?
PLF was 70.1% against 62.8% and units sold were 26.4 billion against 23.7 billion. Operating capacity was 18,150 MW in the release table, though other sources quote 18,110 or 18,330 MW.
How much debt does Adani Power have?
Total debt was Rs 61,860.37 crore at 30 September 2026 against Rs 53,555.54 crore at March, and net debt Rs 45,845.92 crore against Rs 45,022.02 crore. CARE and India Ratings upgraded it to AA+ (Stable).
What is Adani Power’s expansion plan?
A 23,720 MW thermal pipeline with agreements covering 62% of it, led by Korba Phase-II (1,320 MW) and Mahan Phase-II (1,600 MW). The release gives no rupee capex figure.
It was Rs 182.72 on 23 October before the results and about Rs 204 on 5 November, with a Rs 128.10 to Rs 254.20 range. I found no sourced first-day move, and brokerage views cited include Jefferies Rs 240, Elara Rs 220 and JM Rs 258, as reported.
When are Adani Power Q3 FY27 results?
The company has not announced a date as of Thursday, 5 November 2026, 4:45 PM IST. Watch for the board meeting notice on the NSE and BSE announcement pages.
Sources
- Adani Power Q2 FY27 media release, adani.com, 23 October 2026 (opened; primary)
- Free Press Journal, 23 October 2026 (filing figures)
- Multibagg, 23 October 2026 (results table) (AI-generated summary)
- Angel One, 23 October 2026 (price and balance sheet)
- InvestyWise, October 2026 (presentation summary)
- Business Today, 5 November 2026 (price, brokerages, risks)
- Upstox stock page, 5 November 2026 (price)
- Business Standard, 29 October 2026 (Adani group move)
- ad-hoc-news, 20 October 2026 (call date, pre-results price)
- BSE website: where the filing appears (I did not open the filing or the investor presentation).
PositionalCalls.com is not a SEBI-registered research analyst or investment adviser. Investments in securities markets are subject to market risks. Read all related documents carefully before investing. Returns are never guaranteed. PositionalCalls is an independent Indian stock market research and education site founded by Shubham Chaudhary. This page is education and results analysis, not a recommendation to buy, sell or hold any security. How I researched this: I read the company media release and press reports of the results, reconciled the revenue, EBITDA, PBT and profit lines against each other, recomputed every derived number, and listed conflicts openly. I have not opened the exchange filing directly.

Shubham Chaudhary is the founder of PositionalCalls, an independent Indian stock market research website. He writes company fundamentals, quarterly results analysis, IPO analysis and sector research for NSE and BSE listed companies, with a focus on banking stocks, insurance and long-term value investing. Every article is built from primary sources such as RBI, SEBI, NSE and BSE filings and company annual reports, and states its risks plainly in simple language for retail investors.
Coverage areas Our research standards- Numbers checked against NSE, BSE and SEBI filings
- Risks and limits stated in every article
- No paid promotions or broker tie-ups
- Articles updated when new filings arrive