
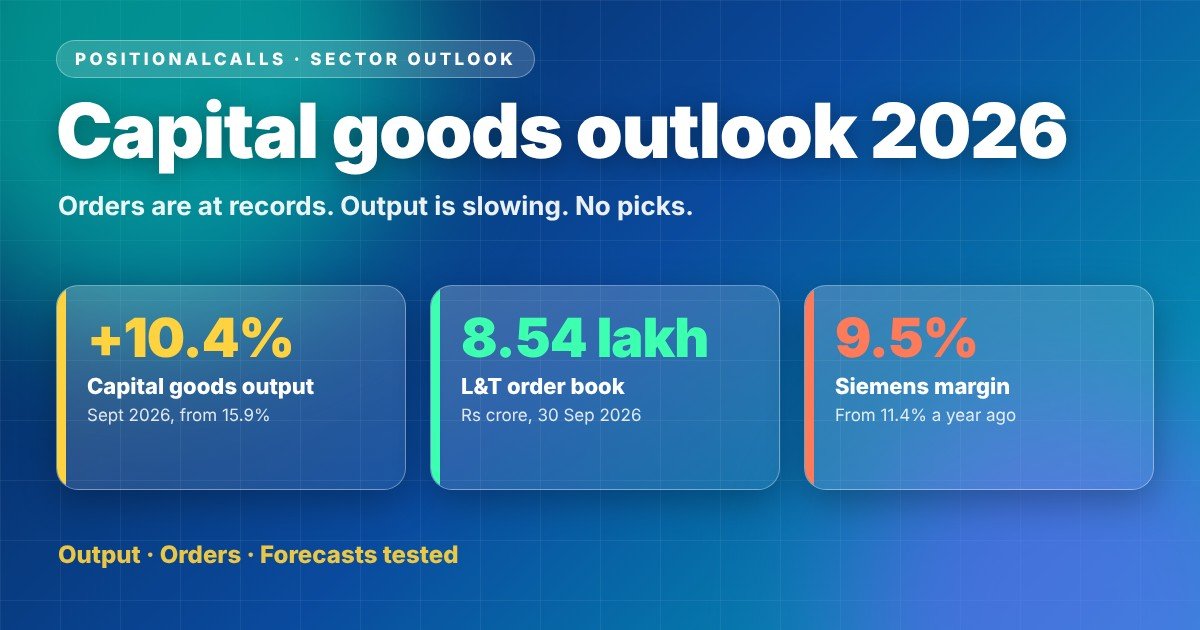
Sector Outlook · Capital Goods
This capital goods sector outlook 2026 page tests India’s factory output, order books and Q2 FY27 results of listed equipment and project companies against broker forecasts, records where numbers disagree and gives no stock picks.
Quick answer
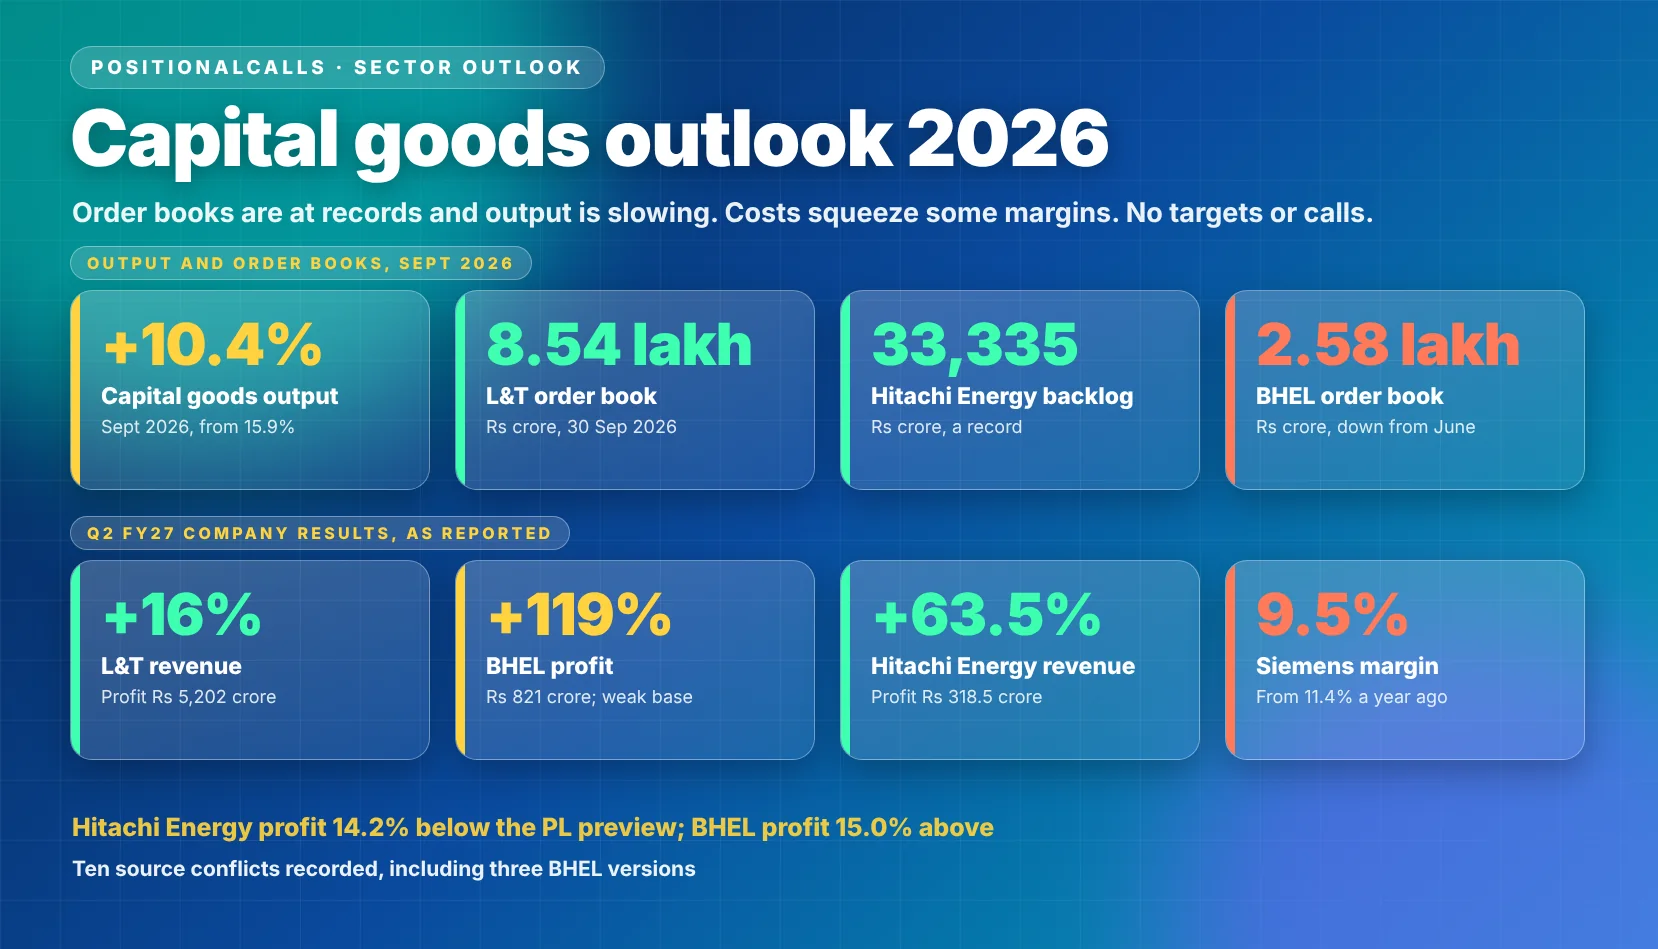
The capital goods sector outlook 2026 is strong orders with slower output and cost pressure. L&T’s order book reached Rs 8.54 lakh crore and Hitachi Energy’s Rs 33,335 crore, but capital goods output growth eased to 10.4% in September from 15.9% in August, and Siemens’ operating margin fell to 9.5%.
Key takeaways on the capital goods sector outlook 2026
- Output: capital goods production grew 16% in April, 15.9% in August and 10.4% in September.
- Orders: L&T, Siemens and Hitachi Energy reported order growth of 28% to 86%, while BHEL’s backlog slipped from June.
- Forecasts: results were mixed against PL’s previews: BHEL beat on profit, Hitachi Energy beat on revenue but missed on profit, and Cummins missed.
- Margins: Siemens’ operating margin fell 1.9 points to 9.5%, and brokers flag high metal prices.
- Doubt: ten source conflicts are recorded, including three BHEL versions.
In plain words: Companies that build power equipment, machines and projects are winning many more orders than a year ago, and several grew revenue fast. Factory output of such goods is still growing, though slower than in spring, and metal costs are squeezing some profits. Orders only turn into earnings once they are delivered.
Data note: as of Saturday, 21 November 2026, 12:30 PM IST. Output figures are from the MoSPI Index of Industrial Production, as relayed by the sources named. Company figures are for the quarter ended 30 September 2026, as relayed by the sources named. I did not open the exchange filings or the MoSPI release, and lines marked as my calculation are my own arithmetic. Analysis only: no buy or sell calls, targets or price zones.
Latest update
- 21 November 2026, 12:30 PM IST: output data run to September 2026 (released 28 October), order books to 30 September, and company results to Hitachi Energy on 12 November.
Capital goods sector outlook 2026: where does the sector stand in November 2026?
The capital goods sector outlook 2026 shows record order books, double-digit output growth that is slowing, and margin pressure from costs. The table collects the latest dated figures this page uses.
| Measure | Latest figure | Period | Source named |
|---|---|---|---|
| Capital goods output (IIP) | Up 10.4%; index 153.4 | September 2026 | Swarajya, Newkerala |
| L&T order book | Rs 8,53,514 crore | 30 September 2026 | Upstox, Lakshmishree |
| L&T Q2 order inflow | Rs 1,47,665 crore, up 28%, a record | Q2 FY27 | Lakshmishree, DSIJ |
| Siemens order backlog | Rs 47,034 crore, up 12% on a year | 30 September 2026 | Kotak Neo |
| Hitachi Energy India order backlog | Rs 33,335.4 crore, a record | 30 September 2026 | Investywise, Equitybulls |
| BHEL order book | Rs 2,57,571 crore, up 17% on a year | 30 September 2026 | TND India, from BHEL presentation |
Cite this table: Capital goods snapshot, PositionalCalls, Saturday, 21 November 2026, 12:30 PM IST, figures as reported by the sources named.
Two readings of this table are worth keeping apart. The first is output: the index is still growing at double digits, but September’s 10.4% was well below April’s 16% and August’s 15.9%. The second is orders: record backlogs promise revenue, yet they say nothing about margins, and the results section shows where profit lagged revenue.
The sector overlaps with several other pages on this site. Power equipment demand ties to the power sector outlook 2026, project orders to the infrastructure sector outlook 2026 and defence manufacturing to the defence sector outlook 2026. This page stays on equipment and project makers.
How fast is capital goods output growing in the capital goods sector outlook 2026?
Capital goods output has grown at double-digit rates in most 2026 months, but growth slowed to 10.4% in September. The table shows the path in the Index of Industrial Production, with the use-based category for capital goods.
| Month | Capital goods output growth | Overall IIP growth | Source named |
|---|---|---|---|
| October 2025 | Up 2.4% | Up 0.4% | ICRA |
| December 2025 | Up 8.1% | Up 7.8% | Invest India |
| April 2026 | Up 16% | Up 4.9% | Bank of Baroda, via Tribune and Devdiscourse |
| August 2026 | Up 15.9% | Up 7.8% (revised) or 8.0% (quick estimate) | Swarajya, Finnovate, Newkerala |
| September 2026 | Up 10.4% | Up 6.7% | Swarajya, Finnovate |
Cite this table: India capital goods output path, PositionalCalls, Saturday, 21 November 2026, 12:30 PM IST, as reported; September figures are quick estimates and may be revised.
The path is volatile: capital goods grew 2.4% in October 2025, then 16% in April 2026. MoSPI’s September release called the figures quick estimates that may be revised, so the 10.4% could move. The ministry said the overall index stood at 124.3 against 116.5 a year earlier, and April to September 2026 industrial output grew 6.8% against 4.4% a year earlier, per Newkerala.
How does capital goods output compare with other IIP groups?
| IIP group, September 2026 | Growth | Source named |
|---|---|---|
| Capital goods | Up 10.4% | Swarajya |
| Intermediate goods | Double-digit growth | Finnovate, Policy Edge |
| Consumer durables | Up 6.0% | Policy Edge |
| Manufacturing | Up 7.6% | Swarajya |
| Electricity and gas | Up 11.2% | Swarajya |
| Consumer non-durables | Up 1.4% | Finnovate, Policy Edge |
| Mining | Down 6.2% | Finnovate |
Cite this table: IIP use-based and sector groups for September 2026, PositionalCalls, Saturday, 21 November 2026, 12:30 PM IST, as reported by the sources named.
Investment goods outgrew consumer goods in September: Policy Edge named intermediate, primary and capital goods as the three largest contributors to the rise, while consumer non-durables rose 1.4%. That split suggests investment demand is carrying the index, which supports the capex story, though a single month cannot show a trend.
What do order books say in the capital goods sector outlook 2026?
Order books are at or near records at L&T, Siemens, Hitachi Energy and BHEL, but the pace of new orders differs. The table sets out Q2 FY27 order intake and backlog for the companies with reported figures.
| Company | Q2 FY27 order intake | Order backlog | Source named |
|---|---|---|---|
| L&T | Rs 1,47,665 crore, up 28% | Rs 8,53,514 crore | Lakshmishree, Upstox |
| Siemens Limited | Rs 6,228 crore, up 37.8% from Rs 4,519 crore | Rs 47,034 crore, up 12% | Kotak Neo |
| Hitachi Energy India | Rs 4,120.8 crore, up 85.9% from Rs 2,217.1 crore | Rs 33,335.4 crore | Lakshmishree, Investywise |
| BHEL | About Rs 4,000 crore of fresh orders (approximate) | Rs 2,57,571 crore, up 17% on a year | Indmoney, TND India |
| ABB India (July to September 2026, single source) | About Rs 4,700 crore, up 56% | About Rs 13,000 crore | Sovrenn concall summary |
Cite this table: Capital goods order intake and backlog, Q2 FY27, PositionalCalls, Saturday, 21 November 2026, 12:30 PM IST, as reported; the ABB row rests on one secondary source.
L&T’s order book rose from Rs 7.79 lakh crore at the end of Q1, per Kotak Neo, and international orders were 54% of the book, per Upstox. Hitachi Energy’s mix shifted toward projects, which were 34% of orders against 19% a year earlier, and export orders rose 41%, per Multibagg. BHEL is the outlier: Indmoney’s table shows the backlog slipping about Rs 2,684 crore from the June quarter because executed revenue exceeded fresh orders.
Why does the ABB India row carry a quarter warning?
ABB India reports on a calendar year, so July to September 2026 is its Q3 CY2026, while Sovrenn’s summary labels the same quarter Q2 FY27. ABB’s own release for April to June 2026 showed orders of Rs 4,363 crore, a backlog of Rs 11,898 crore and revenue of Rs 3,559 crore, so the July to September figures above should be checked against ABB’s filing, which I did not open. The site’s ABB India Q3 results page carries the company-level detail.
Did Q2 FY27 results beat forecasts in the capital goods sector outlook 2026?
Results were mixed against the previews: BHEL beat on profit, Hitachi Energy beat on revenue but missed on profit, and Cummins missed. The table sets PL Research’s 8 October preview estimates beside reported results, with the gaps as my calculation.
| Company and line | PL preview, 8 October | Reported | Gap, my calculation |
|---|---|---|---|
| BHEL revenue | Rs 9,563 crore | Rs 9,300 crore (consolidated) | 2.7% below |
| BHEL EBITDA | Rs 985 crore | Rs 1,026 crore | 4.2% above |
| BHEL profit | Rs 714 crore | Rs 821 crore consolidated; Rs 810 crore elsewhere | 15.0% above; 13.5% on Rs 810 crore |
| Hitachi Energy revenue | Rs 2,771 crore | Rs 2,996.5 crore | 8.1% above |
| Hitachi Energy EBITDA | Rs 470 crore | Rs 494.4 crore operational (Multibagg) | 5.3% above |
| Hitachi Energy profit | Rs 371 crore | Rs 318.5 crore | 14.2% below |
| Cummins India profit | Rs 616 crore | Rs 466.9 crore standalone; Rs 507.2 crore consolidated | 24.2% below on standalone; 17.7% below on consolidated |
| ABB India revenue (single source) | Rs 3,766 crore | Rs 3,738 crore | 0.7% below |
Cite this table: Preview estimates against reported results, Q2 FY27, PositionalCalls, Saturday, 21 November 2026, 12:30 PM IST; gaps are my calculation from the sourced figures.
The previews were published before results, so they test how well analysts read the quarter. PL expected BHEL’s margin to widen on better gross margin and Hitachi Energy’s to expand on favourable mix; BHEL delivered, while Hitachi Energy’s profit grew 20.5% against the 48.9% PL expected. PL expected Cummins’ margin to contract on raw materials, and the profit fell far more than the 3.4% it modelled. The site’s Cummins India Q2 results and Hitachi Energy India Q2 results pages carry the company detail.
Did the sector-level growth forecasts hold in the capital goods sector outlook 2026?
| Source | Date | Q2 FY27 forecast | Universe |
|---|---|---|---|
| Motilal Oswal Financial Services | 5 October 2026 | Revenue up 9.5%, operating earnings up 10%, profit up 9.8%, margin stable near 13% | Capital goods and defence coverage |
| PL Research | 8 October 2026 | Revenue up 12.2% (17.6% without L&T); EBITDA up 12.0% (19.4% without L&T) | PL capital goods coverage |
Cite this table: Sector-level Q2 FY27 growth forecasts for capital goods, PositionalCalls, Saturday, 21 November 2026, 12:30 PM IST, as reported.
Reported revenue growth was 16% at L&T, 17% at Siemens, 23.8% at BHEL, 63.5% at Hitachi Energy and 19.4% at ABB India on one source. The median of those five is 19.4%, which is my calculation and does not equal either broker’s coverage universe, so it shows direction, not a verdict on either forecast.
What did capital goods companies report for Q2 FY27 in the capital goods sector outlook 2026?
Revenue grew at double digits at every company with a reported figure, and profit growth ranged from a 27% fall to a 119% rise. Figures are for the quarter ended 30 September 2026, as reported.
| Company | Q2 FY27 revenue | Q2 FY27 profit | Source named |
|---|---|---|---|
| L&T | Consolidated Rs 78,750 crore, up 16% from Rs 67,984 crore | Consolidated Rs 5,202 crore, up 33% from Rs 3,926 crore | Kotak Neo, Free Press Journal |
| Siemens Limited | Continuing operations Rs 5,734 crore, up 17% | Continuing operations Rs 504 crore, from Rs 481 crore | Kotak Neo |
| BHEL | Rs 9,300 crore, up 24% | Rs 821 crore consolidated, up 119% | Free Press Journal, Indmoney |
| Hitachi Energy India | Rs 2,996.5 crore, up 63.5% from Rs 1,832.6 crore | Rs 318.5 crore, up 20.5% | Lakshmishree, Investywise |
| Cummins India | Not retested on this page | Standalone Rs 466.9 crore, down 26.8%; consolidated Rs 507.2 crore, down 18.5% | This site’s Cummins page |
| Thermax | Not retested on this page | About Rs 113 crore, shares fell 15% after the result | This site’s Thermax page |
Cite this table: Capital goods company results, Q2 FY27, PositionalCalls, Saturday, 21 November 2026, 12:30 PM IST, as reported; this page does not rank the companies.
Each profit line needs a qualifier. Siemens’ revenue grew 17% but profit from continuing operations grew only 4.8% on my calculation, and its half-year profit fell to Rs 847.6 crore from Rs 903.3 crore. BHEL’s H1 consolidated profit was Rs 1,198 crore against a loss of Rs 81 crore a year earlier, per Indmoney, so part of the 119% reflects a weak base. L&T’s H1 profit rose 24% to Rs 9,325 crore, per Upstox. See Thermax Q2 results for the one company where a cost overrun hit profit.
How do margins and operating detail compare in the capital goods sector outlook 2026?
| Company | Operating detail | Source named |
|---|---|---|
| L&T | International business 58% of Q2 revenue; operating profitability remained under pressure | Lakshmishree, Kotak Neo |
| Siemens | Operating margin 9.5% against 11.4% a year earlier and 7.6% in Q1; Smart Infrastructure revenue Rs 3,281.3 crore, up 20.4%; Mobility segment result Rs 96.4 crore against Rs 126.1 crore; management cited commodity and currency volatility | Kotak Neo |
| BHEL | EBITDA Rs 1,026 crore, up 76.6%; H1 revenue Rs 16,998 crore, up 31% | Sarkaritel, PSU Connect |
| Hitachi Energy India | Operational EBITDA Rs 494.4 crore, up 69.5%, margin 16.5%; products 60% of orders, projects 34%; exports up 41% | Multibagg |
| ABB India (single source) | EBITDA Rs 552 crore, up 13.6% on a year and 23.5% on the quarter | Sovrenn |
Cite this table: Capital goods operating detail, Q2 FY27, PositionalCalls, Saturday, 21 November 2026, 12:30 PM IST, as reported.
The comparison shows a split. Product and T&D businesses such as Hitachi Energy gained from mix and volume, while Siemens’ Mobility segment and Cummins show where cost pressure bites. The sector-wide picture sits in the infrastructure sector outlook 2026 for EPC names, and defence orders for HAL are on the HAL Q2 results page.
What drives capital goods orders in the capital goods sector outlook 2026?
Orders come from public capex, power transmission, data centres, defence, oil and gas projects and exports, with private capex the least certain. The table lists each driver with the evidence in the sources.
| Driver | Evidence | Source named |
|---|---|---|
| Public capex | Union Budget FY27 set public capital expenditure at Rs 12.2 lakh crore | Drishti IAS, from the Budget |
| Power transmission | Green Energy Corridor Phase-III of Rs 1.86 lakh crore covers evacuation for 135 GW of renewables and 50 GWh of storage; Q2 generation was 536 billion units, up 11% | MOFSL via Free Press Journal; Upstox |
| Data centres and electrification | Brokers name data-centre-linked power infrastructure as a preferred theme; ICRA lists planned expansion in refineries, data centres and defence | PL Research, 26 October; ICRA |
| Defence | Defence Acquisition Council approvals of Rs 1.62 lakh crore in FY27 so far; BEL’s Q2 orders were subdued at about Rs 3,340 crore | MOFSL; PL Research |
| Oil and gas | L&T’s Q2 orders included three large Middle East hydrocarbon contracts | PL Research, MOFSL |
| Thermal power | A multi-year thermal power ordering cycle supports power equipment visibility | 360 ONE Capital via Newkerala |
| Exports | Hitachi Energy export orders rose 41% in Q2 and 184% in H1 FY27 | Upstox |
Cite this table: Drivers of capital goods orders in 2026, PositionalCalls, Saturday, 21 November 2026, 12:30 PM IST, as reported by the sources named.
PositionalCalls WhatsApp channel
Follow sector pages in one place
- New sector outlooks as they are posted
- Results summaries without tips
- A message when a page is updated
Is private capex supporting capital goods orders in 2026?
Private investment is the unsettled driver. Whalesbook reported in January that order inflows for most companies excluding L&T fell year on year in Q3 FY26 and that private capex lagged, while B&K Securities, per Business Today in June, saw private capex improve with Siemens’ order intake up 32.6% and ABB India’s up 25%. The Q2 numbers lean toward B&K’s reading for the names that reported, though BHEL and defence orders were softer.
What do the derived numbers show in the capital goods sector outlook 2026?
Ten checks tie reported figures together and show how much of the backlog is cover for revenue. Every row in this table is my calculation from the sourced figures above.
| Check | My calculation | Reading |
|---|---|---|
| L&T order inflow to revenue | 1,47,665 / 78,750 = 1.9 times | Orders were nearly twice Q2 revenue |
| L&T backlog cover | 8,53,514 / (78,750 x 4) = 2.7 years | Years of revenue at the Q2 run-rate |
| Siemens order inflow to revenue | 6,228 / 5,734 = 1.09 times; backlog 47,034 / (5,734 x 4) = 2.1 years | Modest cover against L&T |
| Hitachi Energy order inflow to revenue | 4,120.8 / 2,996.5 = 1.38 times; backlog 33,335.4 / (2,996.5 x 4) = 2.8 years | Revenue grew 63.5% yet orders still exceeded it |
| BHEL backlog cover | 2,57,571 / (9,300 x 4) = 6.9 years | Long cover, but about Rs 4,000 crore of fresh orders is 0.43 times revenue |
| Hitachi Energy backlog growth | 33,335.4 / 29,400 less 1 = 13.4% | Ties to management’s double-digit description; Q2 FY26 base from Business Standard |
| Siemens growth gap | Revenue up 17%, profit up 4.8% (504 / 481) | A 12.2 point gap points to margin pressure |
| BHEL EBITDA margin | 1,026 / 9,300 = 11.0% | Differs from the 13.45% shown by one source |
| Output growth against overall IIP | 10.4% less 6.7% = 3.7 points; August to September down 5.5 points | Still ahead of the index, but slowing |
| L&T inflow against preview tallies | 1,47,665 against about 1,00,000 (MOFSL) is 47.7% higher; against about 1,40,000 (PL) is 5.5% higher | The tallies counted disclosed orders only |
Cite this table: Derived capital goods numbers, PositionalCalls, Saturday, 21 November 2026, 12:30 PM IST, my calculation from the sourced figures.
What does backlog cover tell you about capital goods?
Backlog cover is the useful screen here, and it varies widely: 2.7 years at L&T, 2.8 at Hitachi Energy and 6.9 at BHEL. Cover alone does not mean profit, since BHEL’s fresh orders were small relative to its revenue and Siemens’ margin fell while its backlog grew 12%.
What do rating agencies and brokerages say about capital goods, as reported?
Reported sector views are constructive on orders and cautious on costs, and none of them is a stock call on this page. The table lists views on the sector as a whole, with dates and sources.
| Source | Date | Reported view of the sector | Source named |
|---|---|---|---|
| ICRA | 25 February 2026 | Positive outlook; near-term median operating profit growth above 15% for its sample, driven by capex in power and other end-user industries | ICRA annual update |
| Report cited by Business India News | 22 May 2026 | Revenue growth of 12% to 14%; power at 50% of capex against 32%; order books up 1.5 times to Rs 5.2 lakh crore; publisher not shown in the result | Newkerala |
| 360 ONE Capital | 24 August 2026 | Soft first half of FY27, recovery in the second half | Newkerala |
| Motilal Oswal Financial Services | 5 October 2026 | Strong orders support the outlook; high commodity prices and the West Asia crisis could pressure margins | Free Press Journal |
| PL Research | 8 October 2026 | T&D-led product companies and defence should outperform; EPC and export businesses face supply-chain pressure | PL Research PDF |
| PL Research | 26 October 2026 | Constructive; expects gradual price hikes and pass-throughs to offset near-term cost pressure | PL Research summary page |
Cite this table: Agency and broker views on capital goods, PositionalCalls, Saturday, 21 November 2026, 12:30 PM IST, as reported; each is a single-source item and none is a stock recommendation.
Do the broker views agree on timing?
The views agree on direction and differ on timing: 360 ONE expected a soft first half, yet L&T, BHEL and Hitachi Energy reported strong revenue growth for Q2. This page gives no call and does not repeat any broker’s stock names or price targets.
Where do sources disagree on the capital goods sector outlook 2026?
Ten conflicts appear in the data, and each changes how a number reads. The table shows both versions and the one this page uses.
| Item | Version A | Version B | How this page handles it |
|---|---|---|---|
| BHEL Q2 revenue | Rs 9,300 crore, up 24% (Free Press Journal, Indmoney, PSU Connect) | Rs 9,553 crore (Kotak Neo results page) | Uses Rs 9,300 crore, the figure most sources give |
| BHEL Q2 profit | Rs 821 crore consolidated (Free Press Journal, Indmoney) | Rs 810 crore, called standalone (PSU Connect) and consolidated (Sarkaritel) | Shows both and labels the basis |
| BHEL Q2 EBITDA | Rs 1,026 crore, up 76.6% (Sarkaritel, Lapaas Voice) | Rs 1,278 crore (Kotak Neo) | Uses Rs 1,026 crore; margin 11.0% is my calculation |
| BHEL results date | 14 October 2026 (Free Press Journal, Finology) | 3 November 2026 (Kotak Neo) | Does not rely on the date |
| Hitachi Energy Q2 operating profit | Rs 494.4 crore, margin 16.5% (Multibagg) | Rs 406 crore, up 36% (Sovrenn) | Shows both; definitions probably differ |
| L&T order inflow | Rs 1.48 lakh crore (Kotak Neo) | Rs 1,47,665 crore (Lakshmishree) and Rs 1,47,700 crore (DSIJ) | Rounding; uses Rs 1,47,665 crore |
| L&T order book growth | Up 15% over March 2026 (Upstox) | Up 28% on a year (Investywise) | Different bases; both can hold |
| August overall IIP growth | 7.8%, revised (Finnovate) | 8.0%, quick estimate (Newkerala, Swarajya) | Shows both; revised data governs |
| Sector Q2 revenue growth forecast | 9.5% (MOFSL, capital goods and defence) | 12.2% (PL, capital goods coverage) | Different universes; shows both |
| ABB India quarter label | Q3 CY2026 for July to September (ABB calendar year) | Q2 FY27 (Sovrenn) | Uses the date range; Siemens Limited is not Siemens Energy India in PL’s table |
Cite this table: Source conflicts in capital goods data, PositionalCalls, Saturday, 21 November 2026, 12:30 PM IST, as recorded from the sources named.
Which conflict matters most for comparing capital goods companies?
Most of these are definition gaps: consolidated against standalone, reported against quick estimate, orders disclosed against orders booked. The two that change the reading are BHEL’s EBITDA and the IIP revisions, and the capital goods sector outlook 2026 on this page does not rest on either.
What are the risks to the capital goods sector outlook 2026?
Six risks could make the capital goods sector outlook 2026 wrong, and two are visible in reported numbers. Red marks risks that already show in data, amber marks measures to watch, and blue marks risks that depend on future events.
The risks feed each other: higher metal prices squeeze fixed-price contracts, which delays pass-through, and slow order finalisation delays the revenue that would absorb costs.
Bottom line
The capital goods sector outlook 2026 is strong on orders and mixed on profit. Backlogs are at records and revenue grew at double digits, but output growth slowed to 10.4% and some margins fell, so orders alone do not settle the outlook.
What should you watch next in the capital goods sector outlook 2026?
Watch the October IIP print, Q3 FY27 order inflows and margins. The table gives each item and the figure to compare it against.
| Item to watch | Why it matters | Compare against |
|---|---|---|
| October IIP capital goods growth, due around month-end (date not verified) | Tests whether growth steadies after the September slowdown | September: 10.4%; August: 15.9% |
| Q3 FY27 order inflows, January and February 2027 | Tests whether L&T’s record quarter repeats | L&T Q2: Rs 1,47,665 crore |
| BHEL order book | Tests conversion and fresh orders | 30 September: Rs 2,57,571 crore |
| Siemens and Cummins margins | Tests cost pass-through | Siemens 9.5%; Cummins standalone profit down 26.8% |
| Power transmission awards under the Green Energy Corridor | Tests T&D order visibility | Phase-III: Rs 1.86 lakh crore |
| Defence Acquisition Council approvals | Tests defence order flow | FY27 so far: about Rs 1.62 lakh crore |
Cite this table: Capital goods watch list, PositionalCalls, Saturday, 21 November 2026, 12:30 PM IST, dates as reported; later dates may move.
Order data say nothing about profit, so use the quarterly results and check which profit line is quoted.
Capital goods sector outlook 2026 in Hinglish: short summary
Capital goods companies ke paas orders ka record backlog hai, lekin factory output ki growth slow hui hai. September 2026 mein capital goods output 10.4% badha, jabki August mein 15.9% tha. L&T ka order book Rs 8.54 lakh crore aur Hitachi Energy ka Rs 33,335 crore raha.
BHEL ka Q2 profit 119% badha, lekin Siemens ka operating margin 9.5% par aa gaya aur Cummins ka standalone profit lagbhag 27% gira. Metal prices ek bada risk hain. Yeh sirf jaankari hai: koi target, rating ya buy-sell salaah nahi.
What pages sit beside this capital goods page?
The company results pages and the other sector outlooks give the surrounding layer.
- Sector hub: sector outlook India, the sector pages
- Company results: Cummins India Q2 results, Hitachi Energy India Q2 results, Thermax Q2 results and HAL Q2 results
- Related sector pages: power sector outlook 2026, infrastructure sector outlook 2026, defence sector outlook 2026 and metal sector outlook 2026
- Macro: India CPI inflation for October 2026 and RBI repo rate
- Dates: earnings calendar and Q2 FY27 results scorecard
This page is the sector view. It does not rank companies or give targets. The results pages show the company figures, so use them for that job.
Sources for this capital goods page
Every figure comes from the sources below, read on 21 November 2026. I did not open exchange filings, the MoSPI release or company presentations for each figure, so use the links to reach the primary source.
- m.Stock: Capital goods sector in 2026
- ICRA: Capital goods annual update
- Drishti IAS: Capital goods sector
- Newkerala: Capital goods soft in H1 FY27
- Newkerala: Capital goods 12-14% growth
- Free Press Journal: MOFSL capital goods preview
- PL Research: Q2FY27 capital goods preview
- PL Research: Capital goods sector update
- Business Today: B&K on capex recovery
- Whalesbook: Capital goods brace for Q3
- Swarajya: September industrial growth
- Newkerala: IIP September
- Newkerala: IIP April to September
- Finnovate: IIP September 2026
- Policy Edge: IIP September
- Tribune: Capital goods surge, BoB
- Devdiscourse: Capital goods propel outlook
- Invest India: Capital goods demand
- ICRA: IIP December 2025 report
- Kotak Neo: L&T Q2 FY27
- Upstox: L&T Q2 FY27
- Lakshmishree: L&T Q2 results
- DSIJ: L&T order inflow
- Investywise: L&T Q2 H1 FY27
- Kotak Neo: L&T Q1 FY27
- Kotak Neo: Siemens Q2 FY27
- Free Press Journal: BHEL Q2 FY27
- Indmoney: BHEL Q2 order book
- Indmoney: BHEL Q2 profit
- PSU Connect: BHEL Q2
- Sarkaritel: BHEL Q2 FY27
- Lapaas Voice: BHEL Q2
- Kotak Neo: BHEL results page
- TND India: BHEL order book
- Finology: BHEL Q2 FY27
- Lakshmishree: Hitachi Energy Q2
- Investywise: Hitachi Energy Q2 FY27
- Multibagg: Hitachi Energy orders
- Multibagg: Hitachi Energy Q2
- Sovrenn: Hitachi Energy Q2 FY27
- Upstox: Hitachi Energy Q2
- Business Standard: Hitachi Energy Q2 FY26
- Sovrenn: ABB India concall
- ABB India: Q2 CY2026 release
Where a source is a news report on company or industry data, the report is named, not the company. If any figure differs from the primary release, the primary release governs.
PositionalCalls WhatsApp channel
Keep sector updates together
- Quarterly result summaries
- Budget and policy changes
- Links to new sector pages
capital goods sector outlook 2026: frequently asked questions
What is the capital goods sector outlook 2026 for India?
Orders are strong but factory output and margins give mixed signals. Larsen and Toubro reported a record Rs 1.48 lakh crore of Q2 FY27 orders, and Hitachi Energy’s backlog reached Rs 33,335 crore. Capital goods output grew 10.4% in September, down from 15.9% in August, and brokers flag commodity costs as a margin risk.
How much did capital goods output grow in September 2026?
Capital goods production grew 10.4% in September 2026, against 15.9% in August, per Swarajya’s report on the MoSPI release. The use-based index stood at 153.4. Overall industrial output grew 6.7%, so capital goods ran 3.7 percentage points ahead on my calculation, though the pace has slowed from April’s 16%.
Which capital goods companies reported strong Q2 FY27 orders?
Larsen and Toubro reported Rs 1,47,665 crore of orders, up 28%, and an order book of Rs 8,53,514 crore. Siemens reported orders of Rs 6,228 crore, up 37.8%, Hitachi Energy Rs 4,121 crore, up 85.9%, and BHEL a backlog of Rs 2,57,571 crore. BHEL’s backlog fell from the June quarter on one source’s table.
Did Q2 FY27 results beat forecasts in the capital goods sector outlook 2026?
Mixed. Against PL’s preview, my calculation shows BHEL profit 15% above and Hitachi Energy revenue 8.1% above, but Hitachi profit 14.2% below and Cummins profit 17.7% to 24.2% below, by basis. Different names beat and missed, so a sector average hides the spread.
What are the main risks in the capital goods sector outlook 2026?
Six risks stand out: elevated copper, zinc, aluminium and steel prices, fixed-price contracts, West Asia disruption, slower output growth, order conversion delays and one-off items in profit. Siemens’ operating margin fell to 9.5% from 11.4%, and Cummins’ standalone profit fell about 27%, so cost pressure already shows in results.
Why do sources disagree on capital goods numbers?
They use different definitions and dates. BHEL’s Q2 revenue appears as Rs 9,300 crore and Rs 9,553 crore, its profit as Rs 821 crore consolidated and Rs 810 crore, and Hitachi Energy’s EBITDA as Rs 494 crore and Rs 406 crore. The conflicts table records ten such gaps and how this page handles each.
Is the capital goods sector outlook 2026 a call to buy stocks?
No. This page gives no target, rating, entry or exit level and no buy or sell call, and it leaves out brokerage stock preferences. It reports IIP, company and brokerage figures with sources and dates, and it shows which numbers conflict. Treat it as analysis only, and check each company’s filing before acting.
How is the capital goods sector different from infrastructure and defence?
Capital goods covers equipment and project makers such as transformers, switchgear, turbines, engines and automation, while infrastructure covers builders and asset owners and defence covers platform makers. They share customers and Larsen and Toubro appears in several. This page stays on equipment orders and output, with separate pages on the other two sectors.
What do forecasts say about capital goods growth in FY27?
They differ by universe and date. MOFSL expected Q2 revenue growth of 9.5% for capital goods and defence, PL 12.2% for its coverage, and ICRA expected operating profit growth above 15% in February. A 360 ONE report in August expected a soft first half and recovery in the second half.
What should I watch next in the capital goods sector outlook 2026?
Watch the October IIP capital goods print, Q3 FY27 order inflows, input-cost pass-through and margins. Compare September’s 10.4% output growth, Larsen and Toubro’s Rs 1.48 lakh crore of orders, Siemens’ 9.5% margin and BHEL’s order book of Rs 2,57,571 crore. Order books matter only when they convert to revenue.

Shubham Chaudhary is the founder of PositionalCalls, an independent Indian stock market research website. He writes company fundamentals, quarterly results analysis, IPO analysis and sector research for NSE and BSE listed companies, with a focus on banking stocks, insurance and long-term value investing. Every article is built from primary sources such as RBI, SEBI, NSE and BSE filings and company annual reports, and states its risks plainly in simple language for retail investors.
Coverage areas Our research standards- Numbers checked against NSE, BSE and SEBI filings
- Risks and limits stated in every article
- No paid promotions or broker tie-ups
- Articles updated when new filings arrive