
Results analysis · Energy
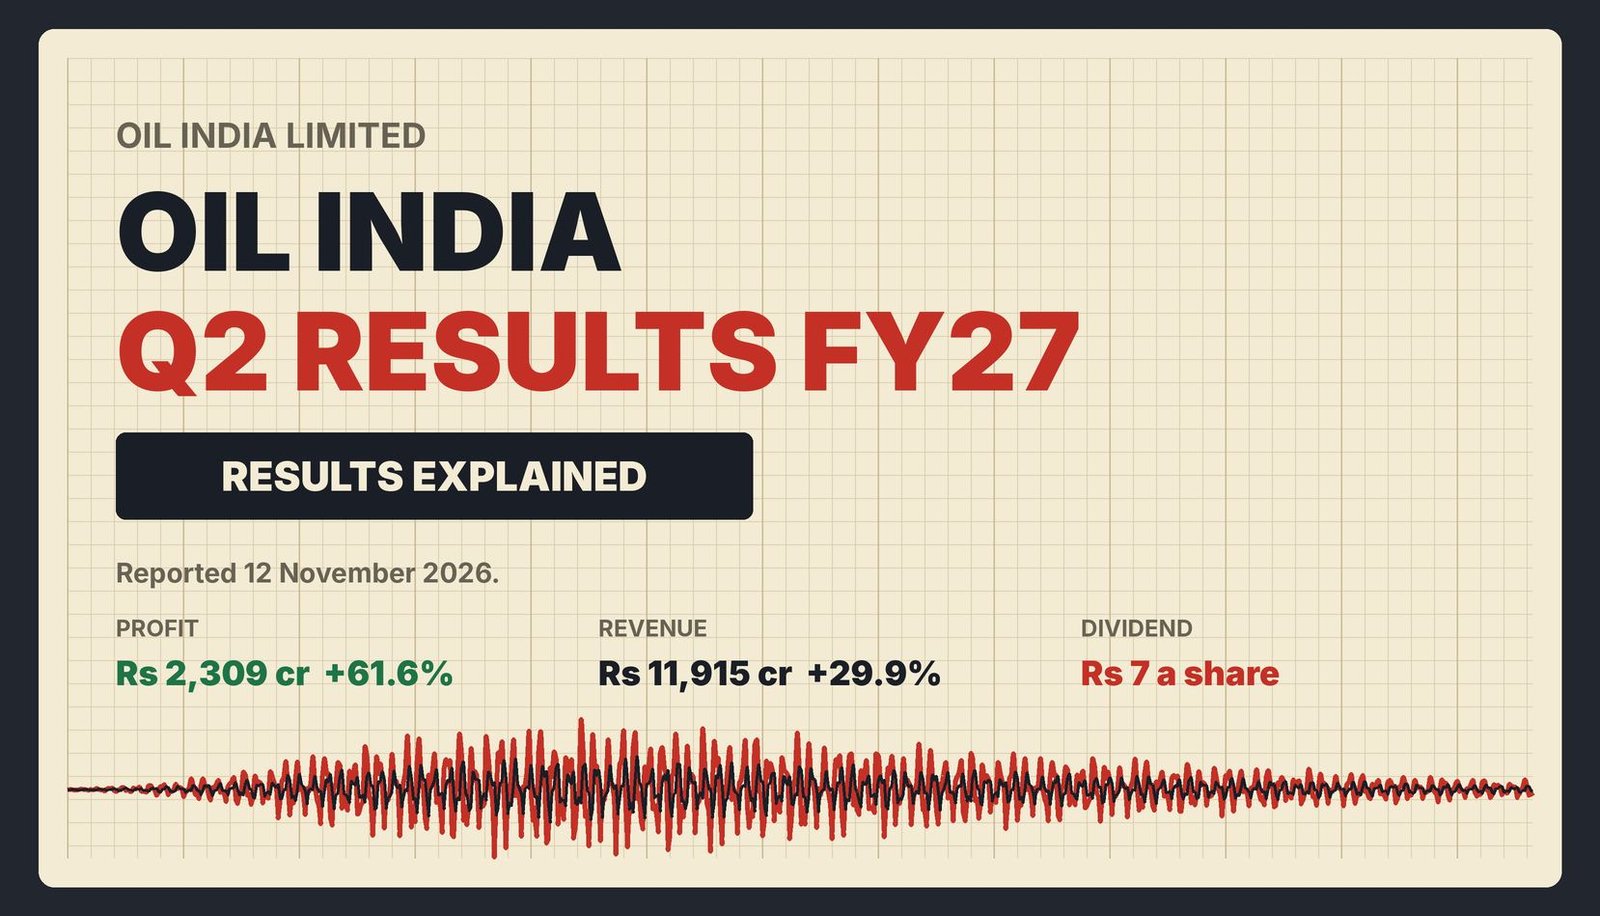
Looking for the Oil India Q2 results FY27? Oil India Limited reported on 12 November 2026: consolidated profit up 61.6% to Rs 2,309 crore, revenue up 29.9% and an interim dividend of Rs 7 a share. This page ties the numbers to the base and the previous quarter, shows where sources are silent and lists what to check in the filing.
Quick answer
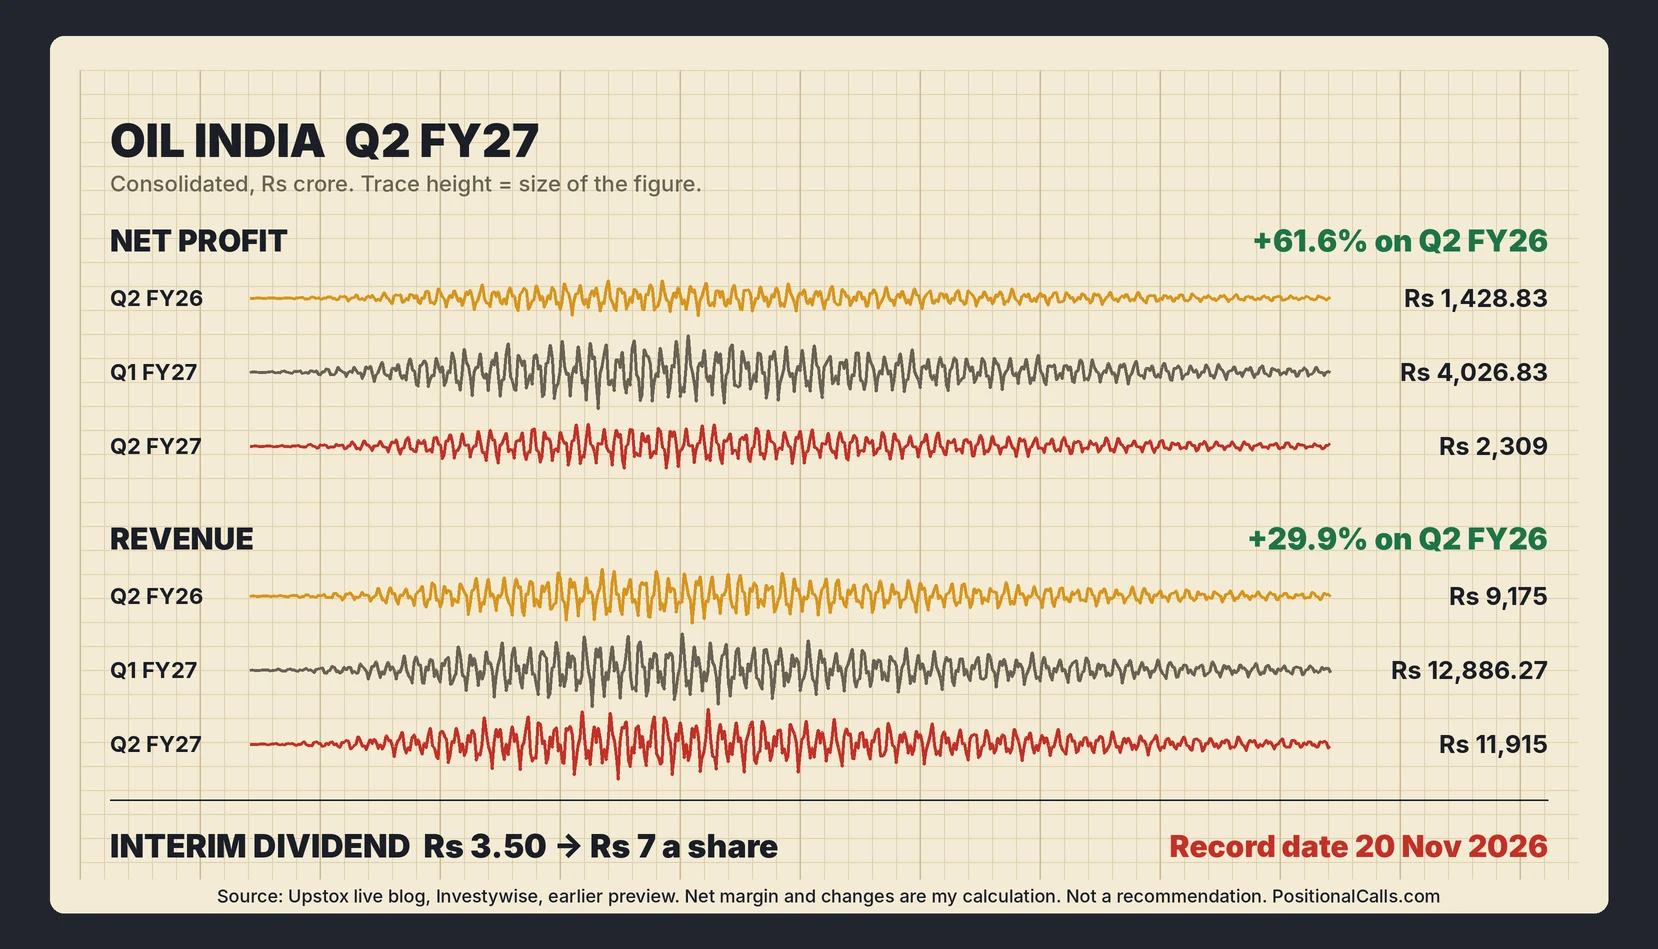
Oil India Q2 results FY27: consolidated net profit rose 61.6% to Rs 2,309 crore from Rs 1,428.83 crore and revenue rose 29.9% to Rs 11,915 crore, per the Upstox live blog. The board also declared an interim dividend of Rs 7 a share, record date 20 November 2026, per Investywise. Reported 12 November 2026; no call here.
Latest update (Thursday, 12 November 2026, 4:20 PM IST): Oil India Limited reported Q2 FY27 results on Thursday, 12 November 2026. The Upstox live blog carried the consolidated figures at 3:57 PM IST and Investywise carried the dividend notice, with page metadata of about 3:50 PM IST. I did not find standalone figures, crude realisation, production, an analyst estimate or a post-result price, and I have not opened the exchange filing.
Key takeaways
- Profit: consolidated net profit was Rs 2,309 crore against Rs 1,428.83 crore a year earlier, up 61.6% (Upstox live blog, 3:57 PM IST).
- Revenue: consolidated revenue was Rs 11,915 crore, up 29.86%; that ties to the Rs 9,175 crore consolidated base from the year-ago quarter.
- Dividend: interim dividend of Rs 7 a share, double last year’s Rs 3.50, with record date 20 November 2026 and payment by 12 December (Investywise).
- Sequential: profit was 42.7% below Q1 FY27’s Rs 4,026.83 crore and revenue 7.5% below Rs 12,886.27 crore (my calculation).
- First half: consolidated profit of about Rs 6,336 crore, roughly 82% above the first half of FY26 (my calculation, same-basis assumption).
- Still open: no standalone figures, no realisation or production data, no estimate and no post-result price found; the filing is not opened.
In plain words: Oil India Limited produces crude oil and natural gas, mostly in Assam, and also owns a majority of Numaligarh Refinery. Its profit moves with oil prices, production volumes, exploration write-offs and refinery margins, so a jump or a fall usually points to one of those.
Data note: Figures are as of 12 November 2026, 4:20 PM IST. The profit and revenue come from one line of the Upstox live blog and are consolidated; the dividend comes from Investywise. Earlier figures come from my Oil India preview, which used PSU Watch, Business Standard, FilingReader and PSU Connect. I could not open the exchange filings. Derived numbers are my calculation.
In this post
- What did Oil India report in Q2 FY27?
- What was the Q2 FY26 base?
- How does Q2 compare with Q1 FY27?
- What happened to the net margin?
- The Rs 7 interim dividend
- What the reports do not show
- What does the first half show?
- What did the preview say?
- Price and estimates
- Dividend cash arithmetic
- Next-filing decoder
- How to read the filing
- What most people miss
- FAQs
- Sources
What did the company report in the Oil India Q2 results FY27, and how big was the change?
In the Oil India Q2 results FY27, consolidated net profit was Rs 2,309 crore, up 61.6% from Rs 1,428.83 crore, and consolidated revenue was Rs 11,915 crore, up 29.86%, per the Upstox live blog entry at 3:57 PM IST on 12 November 2026. The board also declared a Rs 7 interim dividend, per Investywise.
The results covered the quarter and half-year ended 30 September 2026. The board met on Thursday, 12 November 2026 to approve standalone and consolidated results, as PSU Connect reported on 27 October. Investywise’s page metadata shows about 3:50 PM IST (10:20 UTC), which is after the 3:30 PM close, and the Upstox entry is stamped 3:57 PM; I did not find the exact filing time. Companies must report within 45 days of the quarter-end, which made 14 November the limit, so this was day 43 (my calculation). Every number below is as reported by the sources named, and I have not opened the filing.
| Reported figures (quarter to 30 Sep 2026) | Q2 FY27 | Q2 FY26 | Change |
|---|---|---|---|
| Consolidated revenue | Rs 11,915 crore | About Rs 9,175 crore | +29.86% |
| Consolidated net profit | Rs 2,309 crore | Rs 1,428.83 crore | +61.60% |
| Net margin on revenue | 19.4% | 15.6% | +3.8 points (my calculation) |
| Interim dividend a share | Rs 7.00 | Rs 3.50 | +100% (my calculation) |
| Record date | 20 November 2026 | 21 November 2025 | One day earlier in the calendar |
| Payment date | On or before 12 December 2026 | Not found | No comparison |
Cite this table: Oil India Q2 FY27 figures per Upstox live blog and Investywise; Q2 FY26 dividend and revenue per my earlier preview; derived changes calculated by PositionalCalls.
The profit growth checks against its own base: Rs 1,428.83 crore multiplied by 1.616 is Rs 2,309 crore. Revenue also checks: Rs 11,915 crore divided by 1.2986 is about Rs 9,175 crore, which is the consolidated turnover PSU Watch reported for Q2 FY26 (my calculation). The line does not say whether profit is the total or the amount attributable to owners of the parent, and Oil India has minority holders in Numaligarh Refinery, so I treat the two bases as not confirmed.
Which basis does the Oil India Q2 results FY27 headline use?
It is consolidated. The Upstox entry says so, and the dividend page confirms that the board approved both standalone and consolidated results. I could not find the standalone profit or revenue for Q2 FY27 in any source I could read, so this page does not compare standalone figures. A year earlier the standalone profit was Rs 1,044.02 crore and the consolidated figure was higher, so the two bases differ by large amounts and must not be mixed.
What was the Q2 FY26 base, and does it tie to the Oil India Q2 results FY27?
The consolidated base was revenue of about Rs 9,175 crore and profit of Rs 1,428.83 crore. Standalone, Q2 FY26 revenue was Rs 5,456.64 crore and profit Rs 1,044.02 crore, down 43.1%, after about Rs 1,423 crore of exploration write-offs, per my earlier preview. The consolidated changes tie to that base.
| Q2 FY26 base (earlier preview and Upstox) | Figure | Q2 FY27 figure | Ties? |
|---|---|---|---|
| Consolidated revenue | Rs 9,175 crore (PSU Watch) | Rs 11,915 crore | Yes: +29.86% implies Rs 9,175 crore |
| Consolidated net profit | Rs 1,428.83 crore (Upstox) | Rs 2,309 crore | Yes: +61.6% |
| Standalone revenue | Rs 5,456.64 crore (+4.01%) | Not found | No comparison |
| Standalone net profit | Rs 1,044.02 crore (-43.1%) | Not found | No comparison |
| Standalone operating margin | 13.69% (from 30.43%) | Not found | No comparison |
| Interim dividend | Rs 3.50, record 21 Nov 2025 | Rs 7, record 20 Nov 2026 | Doubled |
Cite this table: Oil India Q2 FY26 base per my earlier preview, PSU Watch, Business Standard and Upstox; Q2 FY27 comparison by PositionalCalls.
The year-ago quarter was weak at the standalone level, with profit down 43.1% and crude realisation down sharply, so a large rise in Q2 FY27 is partly a low-base effect (my reading). One caution on the base: an AI summary I saw earlier gave about Rs 1,640 crore for the year-ago consolidated profit. I could not verify it, and the Upstox figure is the one that ties arithmetically to the reported 61.6%, so I use Rs 1,428.83 crore. The gap may be a difference between total profit and profit attributable to owners.
How do the Oil India Q2 results FY27 compare with Q1 FY27?
Q2 FY27 consolidated profit of Rs 2,309 crore was 42.7% below Q1 FY27’s Rs 4,026.83 crore, and revenue of Rs 11,915 crore was 7.5% below Rs 12,886.27 crore. The year-on-year rise is large, but Q2 was a step down from a record first quarter.
| Sequential view (consolidated) | Q2 FY27 | Q1 FY27 | Change, my calculation |
|---|---|---|---|
| Revenue | Rs 11,915 crore | Rs 12,886.27 crore | -7.5% |
| Net profit | Rs 2,309 crore | Rs 4,026.83 crore | -42.7% |
| Net margin | 19.4% | 31.3% | -11.9 points |
| Year-on-year profit growth | +61.6% | +96.8% | Slower growth |
| Year-on-year revenue growth | +29.9% | +47.3% | Slower growth |
| Q1 FY27 Numaligarh Refinery profit | Not found for Q2 | Rs 1,305 crore (+167%) | No comparison |
Cite this table: Oil India Q1 FY27 figures per Indian Masterminds and my earlier preview; Q2 FY27 per Upstox; calculations by PositionalCalls.
Revenue fell 7.5% but profit fell 42.7%, so the margin took the strain, not volume alone (my reading). The reports I found for Q2 do not give a crude price, a realisation or a refinery margin, so I cannot say how much came from oil prices, how much from the refinery and how much from costs. My preview recorded Q1 FY27 crude realisation of $98.73 a barrel and refinery gross margin of $35.95 a barrel at Numaligarh; Q2 equivalents were not found.
What happened to the net margin in the Oil India Q2 results FY27?
Consolidated net profit as a share of revenue was about 19.4% against 15.6% a year earlier and 31.3% in Q1 FY27. That is my calculation from reported figures, not a company-reported margin, and no EBITDA figure was found.
| Margin arithmetic (my calculation) | Q2 FY27 | Q2 FY26 | Q1 FY27 |
|---|---|---|---|
| Consolidated revenue | Rs 11,915 crore | Rs 9,175 crore | Rs 12,886.27 crore |
| Consolidated net profit | Rs 2,309 crore | Rs 1,428.83 crore | Rs 4,026.83 crore |
| Net profit as % of revenue | 19.4% | 15.6% | 31.3% |
| Costs and tax as % of revenue | 80.6% | 84.4% | 68.7% |
| Revenue per Rs 100 of profit | Rs 516 | Rs 642 | Rs 320 |
Cite this table: Oil India net margin calculated by PositionalCalls from Upstox and earlier-preview figures; not company disclosures and not EBITDA.
A net margin mixes operating profit, depreciation, finance cost, tax, other income and the minority share, so it is a coarse measure. It is still useful for direction: each Rs 100 of revenue left Rs 19.4 of profit in Q2 FY27 against Rs 15.6 a year earlier, a gain of 3.8 points, yet it was well below the Rs 31.3 of Q1 FY27. Without the standalone and segment lines I cannot say whether the step down came from lower prices, higher costs or the refinery.
What is the Rs 7 interim dividend in the Oil India Q2 results FY27?
The board declared an interim dividend of Rs 7 per equity share, with record date Friday, 20 November 2026 and payment on or before 12 December 2026, per Investywise. Last year’s Q2 interim dividend was Rs 3.50, with record date 21 November 2025.
| Dividend item | Q2 FY27 | Q2 FY26 | Source and status |
|---|---|---|---|
| Interim dividend a share | Rs 7 | Rs 3.50 | Investywise; PSU Watch |
| Percent of paid-up capital | 70% as stated | 35% (my calculation) | Face value not stated on the page |
| Record date | Friday, 20 November 2026 | 21 November 2025 | Investywise; earlier preview |
| Payment date | On or before 12 December 2026 | Not found | Investywise |
| Estimated outlay | About Rs 1,138 crore | About Rs 569 crore | My calculation on about 162.6 crore shares |
| Source filing | BSE attachment linked by Investywise | Earlier filing | Not opened |
Cite this table: Oil India interim dividend per Investywise and my earlier preview; outlay calculated by PositionalCalls.
The share count of about 162.6 crore comes from Q1 FY27 standalone profit of Rs 2,870.21 crore and earnings per share of Rs 17.65, which divide to that figure (my calculation). On that count a Rs 7 dividend is about Rs 1,138 crore, double the roughly Rs 569 crore of a year earlier. The 70% of paid-up capital in the Investywise article is consistent with a Rs 10 face value, but the page does not state the face value, so that is my inference. The page does not state an ex-date. How a dividend is taxed is covered in dividend tax in India, and the receipt is taxable in the holder’s hands.
What do the reports not show about the Oil India Q2 results FY27?
The reports I read do not show standalone profit, crude realisation, oil and gas production, Numaligarh Refinery’s profit, exploration write-offs, exceptional items, EBITDA or the cash balance. Each of these would explain part of the 61.6% rise or the 42.7% sequential fall.
PositionalCalls WhatsApp channel
The results, then the dividend check
- The profit, revenue and dividend lines as soon as they appear
- Record dates and payout dates explained
- Links to the updated page
| Item missing from the reports | Why it matters | Last mark in my preview | Where to find it |
|---|---|---|---|
| Standalone profit | Isolates the upstream business | Q1 FY27 Rs 2,870.21 crore | Exchange filing |
| Crude realisation | Main price driver | Q1 FY27 $98.73 a barrel; Q2 FY26 $68.19 | Investor presentation |
| Crude production | Volume driver | Q1 FY27 0.950 million tonnes | Production release |
| Numaligarh Refinery profit | Downstream contribution | Q1 FY27 Rs 1,305 crore (+167%) | Filing and presentation |
| Exploration write-offs | Q2 FY26 included about Rs 1,423 crore | Q2 FY26 only | Notes to results |
| GST on royalty | Possible Rs 2,500 crore disclosure | Reported by Cofacto in the preview | Notes and contingent liabilities |
Cite this table: Oil India items not found in Q2 FY27 reports; earlier marks per my preview; PositionalCalls.
These gaps matter because oil producers’ profit swings with prices and write-offs more than with revenue alone. Last year’s standalone fall of 43.1% came with about Rs 1,423 crore of exploration write-offs, so if write-offs were small this year, the rise would partly reflect their absence (my reading). I am not able to confirm that from what I read.
What does the first half show in the Oil India Q2 results FY27?
Adding Q1 and Q2, consolidated first-half revenue is about Rs 24,801 crore and profit about Rs 6,336 crore. Against Q1 FY26 and Q2 FY26 combined, profit is up about 82% and revenue about 38% (my calculation, assuming the same basis in each quarter).
| First half (my calculation) | H1 FY27 | H1 FY26 | Change |
|---|---|---|---|
| Consolidated revenue | About Rs 24,801 crore | About Rs 17,925 crore | +38% |
| Consolidated net profit | About Rs 6,336 crore | About Rs 3,476 crore | +82% |
| Q1 plus Q2 profit | Rs 4,026.83 + 2,309 crore | Rs 2,046.77 + 1,428.83 crore | Sum of reported quarters |
| Share of H1 profit earned in Q1 | 63.6% | 58.9% | Front-loaded |
| Share of H1 profit earned in Q2 | 36.4% | 41.1% | Lower in Q2 |
Cite this table: Oil India H1 figures calculated by PositionalCalls by adding reported quarters; the year-ago revenue is derived from Q1 growth of 47.28% and is approximate.
The sum is only as good as the assumption that both quarters use the same profit definition, and I could not confirm that; the company’s own half-year column in the filing will settle it. The pattern is clear in any case: the first half is far ahead of last year, with most of the gain landing in Q1, and Q2 contributed 36% of the half’s profit.
What did the preview say, and how did the Oil India Q2 results FY27 compare?
The Oil India Q2 results date FY27 preview named Rs 9,175 crore consolidated revenue as the base, Q1 FY27 consolidated revenue of Rs 12,886.27 crore and profit of Rs 4,026.83 crore as the sequential marks, and a Rs 3.50 dividend a year earlier. Revenue and profit were well above the base and below Q1.
| Preview mark | Preview figure | Reported in Q2 FY27 | Outcome |
|---|---|---|---|
| Consolidated revenue base | Rs 9,175 crore | Rs 11,915 crore | Above, +29.9% |
| Consolidated profit base | Rs 1,428.83 crore (Upstox) | Rs 2,309 crore | Above, +61.6% |
| Q1 FY27 revenue | Rs 12,886.27 crore | Rs 11,915 crore | Below, -7.5% |
| Q1 FY27 profit | Rs 4,026.83 crore | Rs 2,309 crore | Below, -42.7% |
| Last year’s interim dividend | Rs 3.50 | Rs 7 | Higher, doubled |
| Interim dividend question | Whether one would be declared | Rs 7 declared | Answered |
Cite this table: Preview marks against reported figures; outcomes calculated by PositionalCalls.
The preview raised the dividend question without a view, and this page records the answer without one. The base of Rs 1,428.83 crore for profit was not in the preview, which used a different year-ago figure from an AI summary, and I have set that aside as explained above.
I found no post-result share price, no analyst estimate and no consensus for the quarter. The result appears to have been released after the 3:30 PM market close, so the first trading reaction would be the next session, Friday, 13 November 2026 (my reading from the timestamps).
| Item | Figure | Source and status |
|---|---|---|
| Share price after the result | Not found | No dated figure in the reports read |
| Analyst consensus for Q2 | Not found | No estimate located |
| Brokerage targets | Not used | PositionalCalls does not use targets |
| First trading session after result | Friday, 13 November 2026 | My reading from the timestamps |
| Record date | 20 November 2026 | Investywise |
| Exchange filing | Not opened | Check NSE and BSE |
Cite this table: Oil India price and estimate items as of the time stated; not verified against filings.
Without an estimate I cannot say whether the result beat or missed expectations. The comparison that can be made from reported figures is against the base and the previous quarter, done above. For other energy names in the same results season, see ONGC Q2 results FY27 and IOC Q2 results FY27.
What does the dividend cash arithmetic show for the Oil India Q2 results FY27?
On about 162.6 crore shares each rupee of dividend costs about Rs 163 crore. The Rs 7 dividend is about Rs 1,138 crore, about 49% of Q2 consolidated profit of Rs 2,309 crore. That is a rough comparison of a standalone share count with a consolidated profit, not a payout ratio.
| Dividend a share | Total outlay, Rs crore | Against Q2 consolidated profit of Rs 2,309 crore |
|---|---|---|
| Rs 3.50 (last year) | 569 | 24.6% |
| Rs 7 (declared) | 1,138 | 49.3% |
| Rs 10 | 1,626 | 70.4% |
| Rs 14.2 (about the whole quarter’s profit per share) | 2,309 | 100% |
Cite this table: Oil India dividend outlay sensitivity, my calculation on about 162.6 crore shares. Illustrations, not forecasts.
The last row shows the quarter’s consolidated profit divided by the share count, about Rs 14.2 a share (my calculation, which assumes the consolidated profit is attributable to owners). The Rs 7 declared is about half of that, which is a comparison of arithmetic only. The company has also declared interim dividends in earlier quarters, so the total for the year will be clear only after the next declarations.
How do I read the next Oil India results after the Oil India Q2 results FY27?
On the next results read, in this order: standalone profit against the Rs 2,870.21 crore of Q1 FY27, crude realisation, production volume, Numaligarh Refinery profit, exploration write-offs, consolidated profit against Rs 2,309 crore and the dividend.
| Order | Line to read | Mark to compare | Why it comes first |
|---|---|---|---|
| 1 | Crude realisation | $98.73 in Q1 FY27; $68.19 in Q2 FY26 | Main price driver |
| 2 | Production volume | 0.950 million tonnes in Q1 FY27 | Volume driver |
| 3 | Standalone profit | Rs 2,870.21 crore in Q1 FY27 | Upstream business |
| 4 | Numaligarh Refinery profit | Rs 1,305 crore in Q1 FY27 | Downstream business |
| 5 | Exploration write-offs | About Rs 1,423 crore in Q2 FY26 | Large one-off item |
| 6 | Consolidated profit | Rs 2,309 crore in Q2 FY27 | The headline |
| 7 | Dividend | Rs 7 in Q2 FY27 | Cash returned |
Cite this table: Oil India reading order, PositionalCalls.
For any summary or target you read elsewhere, compare its assumptions with these lines: the crude price, the production volume and the refinery margin. If it does not state them, you cannot check it.
How do I read the Oil India filing and avoid fake tips?
Open the NSE or BSE announcement for Oil India Limited, not a link in a message, and read the standalone and consolidated tables together. Treat any tip that asks for an OTP, payment or login, or promises a target, as fake.
- Open the exchange announcement page for Oil India Limited.
- Read the unaudited standalone and consolidated results for the quarter and half year ended 30 September 2026.
- Note revenue, expenses by line, exceptional items, profit before tax and profit, and the profit attributable to owners.
- Compare with Rs 11,915 crore and Rs 2,309 crore.
- Read the notes on exploration costs, royalty and GST, and the limited review conclusion.
- Check the dividend notice, the record date and the payment date.
PositionalCalls is not SEBI-registered, gives no buy or sell calls and never asks for payment. Nothing here is investment advice.
What do most people miss in the Oil India Q2 results FY27?
Most readers see profit up 61.6% and miss that profit was 42.7% below Q1 FY27, that the figure is consolidated and its basis is not confirmed, that the year-ago base was weak and that no source gave realisation, production or standalone numbers.
Analyst’s note. What stands out: profit grew 61.6% on revenue growth of 29.9%, so margin rose from a weak base (my reading). What is easy to miss: the quarter was far below the first quarter, so the half-year gain is front-loaded. What would change the view: a filing with standalone figures, write-offs or a different profit basis. Caution: the headline figures come from one live blog line and I did not open the filing. Reader action: read realisation, production, write-offs and the standalone profit first.
Bottom line
The result shows consolidated profit of Rs 2,309 crore (+61.6%), revenue of Rs 11,915 crore (+29.9%) and an interim dividend of Rs 7 a share, with profit 42.7% below Q1 FY27. There is no target or call on this page. I will update it when the filing is read. See our earnings coverage.
PositionalCalls WhatsApp channel
Never miss an update
- Results dates and payout dates
- Numbers explained without tips or targets
- Updated posts as they go live
Oil India Q2 results FY27: frequently asked questions
What did the company report in the Oil India Q2 results FY27?
In the Oil India Q2 results FY27, consolidated net profit was Rs 2,309 crore, up 61.6% from Rs 1,428.83 crore, on consolidated revenue of Rs 11,915 crore, up 29.86%, reported on 12 November 2026. The board declared a Rs 7 interim dividend. Figures are from Upstox and Investywise; check the filing.
What was Oil India net profit in Q2 FY27?
Consolidated net profit was Rs 2,309 crore against Rs 1,428.83 crore a year earlier, up 61.6%, per the Upstox live blog. It was 42.7% below Q1 FY27’s Rs 4,026.83 crore. I did not find the standalone profit, and the line does not say whether the figure is attributable to owners.
How much dividend did Oil India declare with Q2 results?
The board declared an interim dividend of Rs 7 per equity share, with record date 20 November 2026 and payment on or before 12 December 2026, per Investywise. That is double last year’s Rs 3.50. In the Oil India Q2 results FY27, on about 162.6 crore shares it costs about Rs 1,138 crore, my calculation.
What is the Oil India dividend record date?
The record date for the Rs 7 interim dividend is Friday, 20 November 2026, per Investywise, and payment is on or before 12 December 2026. The page does not state an ex-date, so check the NSE and BSE notice. Last year’s record date was 21 November 2025.
What was Oil India revenue in Q2 FY27?
Consolidated revenue was Rs 11,915 crore, up 29.86% year on year, per the Upstox live blog. The growth implies a base of about Rs 9,175 crore, which matches the consolidated turnover reported for Q2 FY26. It was 7.5% below Q1 FY27 revenue of Rs 12,886.27 crore, my calculation.
Why did Oil India profit rise in Q2 FY27?
The reports I read do not give a reason. The year-ago base was weak, with standalone profit down 43.1% after about Rs 1,423 crore of exploration write-offs, per my preview. Realisation, production and refinery profit for Q2 were not found, so I cannot attribute the Oil India Q2 results FY27 rise.
Did Oil India beat Q2 estimates?
I found no analyst estimate or consensus for the quarter, so I cannot say whether it beat or missed one. Compare the result with the year-ago base of Rs 1,428.83 crore profit and Rs 9,175 crore revenue, and with Q1 FY27, as the tables on this page do.
I did not find a dated post-result price. The Investywise page metadata shows about 3:50 PM IST on 12 November 2026, after the 3:30 PM close, so the first trading reaction would be the next session, my reading. Check NSE or BSE for a quote. No brokerage target is used.
Is the Oil India Q2 profit standalone or consolidated?
The Upstox figure of Rs 2,309 crore is consolidated. The board approved both standalone and consolidated results, but I could not find the standalone Q2 FY27 profit. A year earlier standalone profit was Rs 1,044.02 crore, so the two bases differ widely and should not be mixed.
Is this page financial advice about Oil India?
No. This page is not investment advice, a target or a recommendation, and PositionalCalls is not SEBI-registered. It reports company figures and sources with dates, and labels my calculations. Read the exchange filing and consult a registered adviser before any decision.
Sources
- NSE India: corporate announcements: results and dividend notices.
- BSE India: corporate announcements: the results filing.
- Upstox: Q2 results live blog, Oil India entry, 12 November 2026, 3:57 PM IST.
- Investywise: Oil India board approves results, Rs 7 interim dividend, 12 November 2026, about 3:50 PM IST.
- PSU Connect: Oil India board to meet on 12 November, 27 October 2026.
- Indian Masterminds: Oil India Q1 FY27 results, for the Q1 FY27 marks.
- PSU Watch: Oil India Q2 FY26 consolidated turnover and Rs 3.50 dividend, November 2025.
- PositionalCalls: Oil India Q2 results date FY27 preview, 12 November 2026.
Disclosure: PositionalCalls.com is not a SEBI-registered research analyst or investment adviser. Investments in securities markets are subject to market risks. Read all related documents carefully before investing. Returns are never guaranteed. PositionalCalls is an independent research and education site founded by Shubham Chaudhary. Nothing here is a recommendation, target or investment advice. How I researched this: for this page on the Oil India Q2 results FY27 I read Upstox, Investywise, PSU Connect, Indian Masterminds and PSU Watch, noted where sources differ, and marked every derived number as my calculation. I did not open any company filing or exchange document. Figures are as of 12 November 2026, 4:20 PM IST.

Shubham Chaudhary is the founder of PositionalCalls, an independent Indian stock market research website. He writes company fundamentals, quarterly results analysis, IPO analysis and sector research for NSE and BSE listed companies, with a focus on banking stocks, insurance and long-term value investing. Every article is built from primary sources such as RBI, SEBI, NSE and BSE filings and company annual reports, and states its risks plainly in simple language for retail investors.
Coverage areas Our research standards- Numbers checked against NSE, BSE and SEBI filings
- Risks and limits stated in every article
- No paid promotions or broker tie-ups
- Articles updated when new filings arrive