
Energy · Indian Oil
In the IOC Q2 results, a record profit rests on inventory gains and LPG compensation while pump and LPG losses continue. Here is what drove the number and what to watch next.
Quick answer
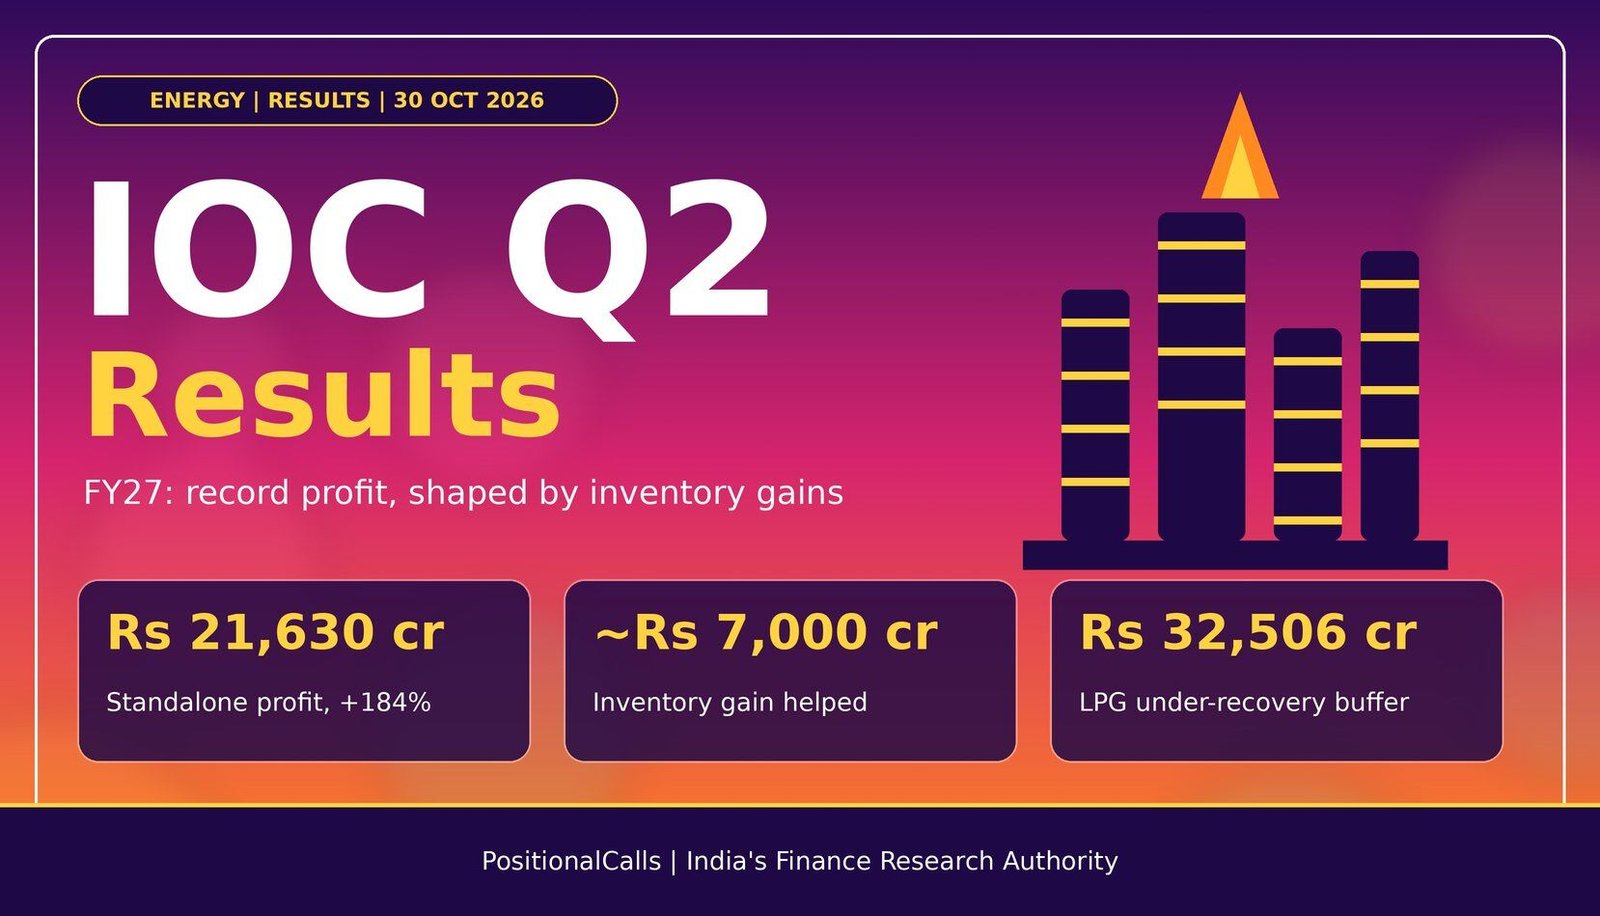
IOC Q2 results: Indian Oil reported a record standalone net profit of Rs 21,630 crore (+184%) for the quarter ended 30 September 2026, with consolidated profit at Rs 22,503 crore. About Rs 7,000 crore came from inventory gains, helped by high refining margins, while LPG under-recoveries stood at Rs 32,506 crore.
Latest update (Wednesday, 4 November 2026, 6:30 PM IST): Indian Oil reported on Friday, 30 October 2026, and the combined oil marketing company results were reported on Sunday, 1 November 2026. A confirmed share price after the results and the Q3 FY27 results date were not found as of the time above.
Key takeaways
- Profit: standalone Rs 21,630 crore (+184%), consolidated Rs 22,503 crore (+174.7%).
- Quality: about Rs 7,000 crore inventory gain and Rs 7,243 crore LPG compensation over the half-year.
- Q1: consolidated loss of Rs 1,141 crore, so the record follows a loss.
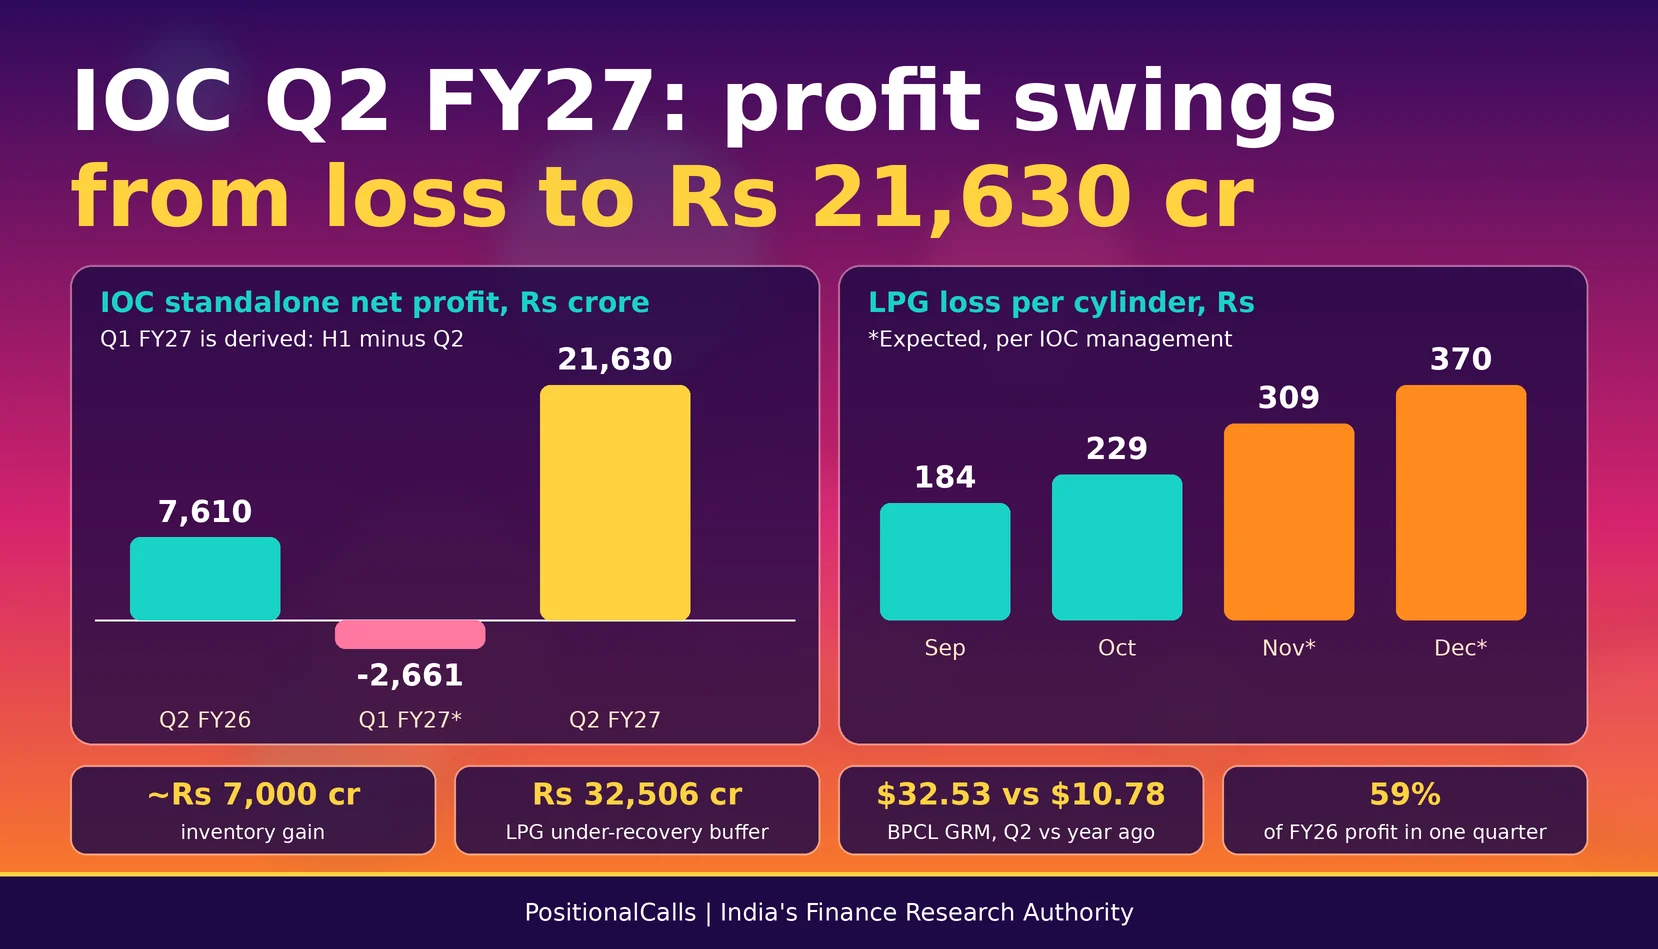
- Losses: LPG buffer Rs 32,506 crore; loss per cylinder rising to Rs 370 by December.
- Peers: BPCL profit -22.5%, HPCL -9%.
- Watch: IOC warned of inventory losses ahead.
In plain words: an inventory gain happens when crude falls while a refiner holds stock bought at higher prices. GRM is gross refining margin, the profit per barrel from turning crude into fuels. Under-recovery is the gap between what LPG costs and what the household pays, which the government is expected to compensate.
Data note: as of Wednesday, 4 November 2026, 6:30 PM IST. Figures come from news reports of IOC’s results, not from the filing itself. Q1 FY27 standalone profit is derived. Year-ago base figures conflict across sources and are shown in the definition-trap table.
IOC Q2 results FY27: what are the key numbers?
Indian Oil Corporation reported a record standalone net profit of Rs 21,630 crore for the quarter ended 30 September 2026, nearly three times the Rs 7,610 crore of a year ago. The board approved the results on Friday, 30 October 2026. The number is real, but it was shaped by an inventory gain of about Rs 7,000 crore, a surge in refining margins and government LPG compensation, while the company kept losing money on petrol, diesel and LPG sales. That is the core of the IOC Q2 results.
| Metric | Q2 FY27 | Q2 FY26 | Change | Why it matters |
|---|---|---|---|---|
| Standalone net profit | Rs 21,630.03 cr | Rs 7,610.45 cr | +184% | Highest quarterly profit on record |
| Consolidated net profit | Rs 22,503 cr | Rs 8,191 cr | +174.7% | Includes subsidiaries and associates |
| Standalone revenue from operations | Rs 2,62,936 cr | Rs 2,02,992 cr | +29.5% | Includes LPG compensation recognised as revenue |
| Consolidated revenue from operations | Rs 2,68,039 cr | Rs 2,06,447 cr | +29.8% | Group scale |
| Petroleum products segment profit | Rs 24,935 cr | Rs 11,269 cr | +121% | Refining and marketing drove the result |
Cite this table: PositionalCalls, “IOC Q2 FY27 key numbers, as of 4 November 2026”.
Data note: figures are as reported by PTI, Business Standard, PSU Connect and Indian Masterminds between 30 October and 1 November 2026. I have not opened the exchange filing, so line items can differ slightly. Base-period conflicts are explained in the definition-trap section.
Where did IOC’s record profit come from, and how much will repeat?
The record came from three things that do not all repeat: an inventory gain of about Rs 7,000 crore, very high refining margins, and Rs 7,243 crore of LPG compensation booked over the half-year. Business Standard reports that IOC recognised Rs 7,243.02 crore of government compensation as revenue from operations for the six-month period.
The inventory gain arose because crude prices fell between mid-June and mid-August. A refiner buys crude at one price, refines it and sells products later. When crude falls fast, products sold in the quarter were made from costlier crude on the books, so the gain shows up in a different quarter, and when crude rises it reverses. IOC itself warned that profitability in the coming quarters may be hurt by inventory losses if crude falls further as the West Asia situation normalises.
| Scenario (own illustration) | Pre-tax change | Net profit (Rs cr) | Versus Q2 FY26 (Rs 7,610 cr) |
|---|---|---|---|
| Reported | none | 21,630 | +184% |
| Without the Rs 7,000 cr inventory gain | -7,000 | about 16,380 | about +115% |
| Also without all Rs 7,243 cr LPG compensation (upper bound) | -7,243 | about 10,950 | about +44% |
Cite this table: PositionalCalls, “IOC Q2 FY27 profit-quality scenarios, as of 4 November 2026”.
Assumptions: a flat 25% tax rate on each adjustment, no other line changing, and the whole Rs 7,243 crore of compensation falling in Q2 (the reports give it for the half-year, so this is a deliberate upper bound). This is an illustration of scale, not the company’s adjusted profit and not a forecast.
In plain words: IOC earned a record profit partly because crude prices fell while it held stock, and partly because the government compensated it for LPG losses. Neither is guaranteed in the next quarter.
Why did IOC swing from a loss in Q1 to a record in Q2?
Because crude was above USD 100 a barrel in Q1 while pump prices were frozen, and then crude fell and refining margins surged in Q2. IOC booked a consolidated loss of Rs 1,141 crore in Q1 FY27.
| Period | IOC standalone profit | IOC consolidated profit | Comment |
|---|---|---|---|
| Q2 FY26 | Rs 7,610 cr | Rs 8,191 cr | Base quarter |
| Q1 FY27 | about -Rs 2,661 cr (derived) | -Rs 1,141 cr | West Asia conflict, crude above USD 100 |
| Q2 FY27 | Rs 21,630 cr | Rs 22,503 cr | Record, inventory gain and margins |
| H1 FY27 | Rs 18,969 cr | not found | H1 FY26 was Rs 13,299 cr (+42.6%) |
Cite this table: PositionalCalls, “IOC Q1 and Q2 FY27 comparison, as of 4 November 2026”.
The Q1 FY27 standalone figure is my derivation: the reported half-year standalone profit of Rs 18,968.66 crore minus Rs 21,630.03 crore for Q2 leaves a loss of about Rs 2,661 crore. I could not find the Q1 standalone number in the sources reviewed, so please treat it as derived. One outlet labelled the same Rs 18,969 crore as a consolidated half-year figure, which conflicts with other reports that call it standalone.
Across the three state-run fuel retailers, the combined standalone profit was Rs 30,106 crore in Q2 against a combined loss of about Rs 18,150 crore in Q1. The Q2 total is 68.3% above last year’s Q2 and equals about 39% of their combined FY26 profit of Rs 77,281 crore.
How do IOC, BPCL and HPCL compare in Q2 FY27?
IOC delivered the bulk of the profit, while BPCL and HPCL profits fell despite equally strong refining margins. The difference lies in mix and other businesses.
| Company | Q2 FY27 standalone profit | Change vs Q2 FY26 | GRM per barrel (Q2 FY27 vs year ago) | LPG and fuel under-recovery buffer |
|---|---|---|---|---|
| IOC | Rs 21,630 cr | +184% | not found | Rs 32,505.69 cr |
| BPCL | Rs 4,993 cr | -22.5% | USD 32.53 vs 10.78 | Rs 17,334.40 cr |
| HPCL | Rs 3,483 cr | -9% | USD 32.15 vs 8.80 | Rs 18,048.82 cr |
| Combined | Rs 30,106 cr | +68.3% | not applicable | about Rs 67,900 cr |
Cite this table: PositionalCalls, “IOC BPCL HPCL Q2 FY27 comparison, as of 4 November 2026”.
GRM is gross refining margin, the money earned on turning a barrel of crude into products. BPCL and HPCL earned over USD 32 a barrel, roughly three to four times a year ago. IOC’s own GRM was not in the reports I reviewed, so I have not shown one. IOC attributed its record to refining, petrochemicals and gas.
In the IOC Q2 results, IOC alone supplied about 72% of the three companies’ combined Rs 30,106 crore (my calculation: 21,630 divided by 30,106). Its Q2 profit also equals about 59% of its full-year FY26 profit of Rs 36,802 crore. That concentration is why the sector headline and the IOC headline can point in different directions: the group number rose 68.3%, yet two of the three companies reported lower profit.
PositionalCalls WhatsApp channel
Get energy results alerts first
- IOC, BPCL, HPCL and ONGC results in plain language
- Fast updates on LPG compensation and pump price news
- Inventory-gain and margin decoders for every energy result
How big are the LPG and fuel losses behind the headline?
Losses on LPG, petrol and diesel are large and still growing, and IOC’s net LPG under-recovery buffer stood at Rs 32,505.69 crore on 30 September 2026. Petrol and diesel prices have been unchanged since May and domestic LPG prices since March, according to the PTI report.
| Item | Figure | Source note |
|---|---|---|
| LPG loss per cylinder, September 2026 | Rs 184 | IOC Director (Finance), investor call on Saturday, 31 October 2026 |
| LPG loss per cylinder, October 2026 | Rs 229 | same call |
| Expected, November 2026 | Rs 309 | same call, expectation |
| Expected, December 2026 | Rs 370 | same call, expectation |
| Petrol loss per litre (until September) | Rs 4 to Rs 5 | industry sources |
| Diesel loss per litre (until September) | Rs 18 to Rs 20 | industry sources |
Cite this table: PositionalCalls, “IOC LPG and fuel loss per unit, as of 4 November 2026”.
LPG is a regulated product, so the government is expected to make good the gap between the retail price and the actual cost. Petrol and diesel are deregulated, so any loss on those sells falls on the companies. Because compensation has come in slowly, the three companies carried unpaid under-recoveries of about Rs 67,900 crore at the end of September, of which IOC’s share is Rs 32,505.69 crore.
A Business Standard headline of 23 September 2026 cites Icra saying high crude was leaving oil marketing companies with losses of about Rs 530 crore a day on fuel sales. I have not read the full report, so I note it only as a pointer. If LPG losses per cylinder reach the expected Rs 370 in December, the gap that needs compensation widens each month.
What do the operating numbers say about demand and refining?
Refinery throughput and domestic sales both grew, while exports fell about 11%. Volumes were healthy, so the profit swing is mostly margin and inventory, not demand.
| Operating metric | Q2 FY27 | Q2 FY26 | Change |
|---|---|---|---|
| Refinery throughput | 18.108 MMT | 17.609 MMT | +2.8% |
| Domestic sales | 23.977 MMT | 22.851 MMT | +4.9% (one report: +4.8%) |
| Exports | 1.251 MMT | 1.411 MMT | -11.3% |
| H1 throughput | 37.273 MMT | 36.292 MMT | +3% (105.8% utilisation) |
| H1 cross-country pipeline throughput | 53.896 MMT | 50.343 MMT | +7% |
Cite this table: PositionalCalls, “IOC Q2 FY27 operating metrics, as of 4 November 2026”.
Capacity utilisation of 105.8% over the half-year means refineries ran above their rated capacity. That helps in a high-margin period because each extra barrel earns the margin, but it also means growth from existing assets is limited without new projects.
Why do IOC Q2 results show different profit figures?
Because standalone and consolidated profit are different, and several outlets show different year-ago bases. Use standalone Rs 21,630 crore for the company itself and consolidated Rs 22,503 crore for the group.
| Item | Reported figure | Where it conflicts |
|---|---|---|
| Standalone Q2 FY26 profit | Rs 7,610.45 cr | One summary shows Rs 6,753.77 cr; I use Rs 7,610.45 cr as reported by most outlets |
| Consolidated Q2 FY26 profit | Rs 8,191 cr | Last year’s reports showed Rs 7,705 cr and Rs 7,817 cr; the newer base may be restated or on a different basis |
| H1 FY27 profit | Rs 18,968.66 cr (standalone) | One outlet calls it consolidated |
| Domestic sales growth | +4.9% (23.977 vs 22.851 MMT) | Business Standard says 4.8% |
| Profit growth | +184% standalone, +174.7% consolidated | Not comparable with each other |
Cite this table: PositionalCalls, “IOC Q2 FY27 definition trap, as of 4 November 2026”.
Correction note: some pages still describe last year’s Q2 FY26 results of Rs 7,610 crore as the latest quarter. This page covers the quarter ended 30 September 2026, with results approved on 30 October 2026.
What is the outlook after the IOC Q2 results?
IOC warned that profit in the coming quarters may be hurt by inventory losses if crude falls as West Asia normalises, and industry sources say crude firmed in October. That means the next quarter’s result depends on crude direction, product margins and the pace of LPG compensation.
- Crude direction: a fall after a rise creates inventory losses; a further rise helps inventory but widens pump losses.
- LPG compensation: loss per cylinder is expected to rise to Rs 309 in November and Rs 370 in December.
- Refining margins: BPCL and HPCL earned over USD 32 per barrel; the question is how much of that lasts.
- Pump prices: petrol and diesel have been unchanged since May, so any revision would change the loss per litre.
- Q3 FY27 date: the board meeting date was not confirmed as of Wednesday, 4 November 2026, 6:30 PM IST.
There is no dividend announcement in the reports I reviewed, and I do not have a confirmed share price after the results. Check the exchange filing for any corporate action. This page does not give ratings or price targets, because PositionalCalls.com is not a SEBI-registered research analyst or investment adviser.
How to read the IOC Q2 results: a decoder table
Look past the headline to five lines: inventory effect, refining margin, LPG compensation, pump losses and cash. The table gives what to read and the question to ask.
| What to read | Q2 FY27 | Mark to compare | Question to ask |
|---|---|---|---|
| Inventory gain | ~Rs 7,000 cr | Q1 inventory effect | Does it reverse if crude falls? |
| Refining margin | BPCL USD 32.53 | USD 10.78 a year ago | How long do margins stay this high? |
| LPG compensation | Rs 7,243 cr (H1) | Net buffer Rs 32,506 cr | When is the rest paid? |
| Petrol and diesel losses | Rs 4-5 and Rs 18-20 per litre | Zero in normal times | When do prices change? |
| Standalone profit | Rs 21,630 cr | Rs 7,610 cr a year ago | How much is core and how much one-off? |
Cite this table: PositionalCalls, “IOC results-day decoder, as of 4 November 2026”.
Peers and context: Reliance Q2 results for the energy giant, ONGC Q2 results for crude producers, Coal India Q2 results and Power Grid Q2 results for other public sector energy names, plus the Q2 results calendar.
What this means for investors, LPG users and drivers
For investors the question is how much of Rs 21,630 crore is repeatable; for households, pump and LPG prices have not yet changed. The numbers do not by themselves signal a price revision.
- What you need: nothing to act on. This is analysis, not a call to buy or sell.
- Dividend: none found in the reports reviewed. Check the filing.
- Tax angle: gains and any dividend follow the rules in our capital gains tax on shares guide. Confirm current rates with an adviser.
- LPG users: domestic LPG prices have been unchanged since March per PTI; the company, not the household, is bearing the gap for now.
- Scam warning: fake messages about LPG subsidy credit, KYC or dividend payments are common. Verify only on official sites.
What most people miss in the IOC Q2 results
Analyst’s note
The points below are my reasoning from the reported numbers. They are not a recommendation.
- What stands out: a record profit made while the company still loses money on every litre of diesel and every LPG cylinder.
- Easy to miss: H1 profit growth of 42.6% is a better yardstick than 184%.
- What would change the view: a clear timetable for LPG compensation, or a pump price revision.
- Caution: inventory gains reverse when crude falls, as the company itself warned.
- Reader action: compare the three scenarios in the profit-quality table with your own assumptions.
Bottom line
Bottom line
The IOC Q2 results show a record Rs 21,630 crore standalone profit, but about Rs 7,000 crore came from inventory gains and Rs 7,243 crore of LPG compensation was booked over the half-year. Pump and LPG losses persist, and the company warned of inventory losses ahead.
Next read: ONGC Q2 results for the crude producer, or the Q2 results calendar.
Part of the Energy cluster under Earnings coverage. Last year’s IOC results are covered in our IOC Q3 results post.
PositionalCalls WhatsApp channel
Follow the rest of the Q2 results season
- Daily results calendar with confirmed and tentative dates
- Profit-quality checks, not just headline numbers
- New tax and dividend explainers as they publish
IOC Q2 results FAQs
What was IOC’s net profit in the IOC Q2 results?
IOC reported a standalone net profit of Rs 21,630 crore for Q2 FY27, up 184% from Rs 7,610 crore, and a consolidated profit of Rs 22,503 crore.
When were the IOC Q2 results announced?
The board approved the Q2 FY27 results on Friday, 30 October 2026 for the quarter ended 30 September 2026.
Why did IOC profit jump in the IOC Q2 results?
Mainly refining and petrochemical margins and an inventory gain of about Rs 7,000 crore as crude fell from mid-June to mid-August, plus LPG compensation of Rs 7,243 crore booked over the half-year.
Did IOC make a loss in Q1 FY27?
Yes. IOC booked a consolidated loss of Rs 1,141 crore in Q1 FY27. The standalone Q1 loss works out to about Rs 2,661 crore by my calculation.
What is IOC’s LPG under-recovery?
IOC’s net negative buffer from LPG under-recoveries was Rs 32,505.69 crore on 30 September 2026, after recognising compensation during the half-year.
How much is IOC losing per LPG cylinder?
IOC’s Director (Finance) said the loss was Rs 184 in September and Rs 229 in October, and expected Rs 309 in November and Rs 370 in December.
How did BPCL and HPCL do compared with IOC?
BPCL’s standalone profit fell 22.5% to Rs 4,993 crore and HPCL’s fell 9% to Rs 3,483 crore, even though both earned over USD 32 per barrel in refining.
What is the risk to IOC profit in coming quarters?
The company warned of inventory losses if crude falls as the Middle East situation normalises, which could hurt profit in the coming quarters.
Did IOC announce a dividend with Q2 FY27 results?
I found no dividend announcement in the reports reviewed. Check the exchange filing for corporate actions before relying on this.
Are IOC standalone and consolidated profits the same?
No. Standalone profit was Rs 21,630 crore and consolidated profit Rs 22,503 crore. Always check which one a headline uses.
Sources
- Indian Oil Corporation Q2 FY27 results and press release on the NSE and BSE announcement pages (primary; to be checked by the reader).
- Business Standard, “Indian Oil posts 174% increase in net profit amid high refining margins”, 30 October 2026.
- PTI via Business Standard, “IOC, BPCL, HPCL clock Rs 30,106 cr Q2 profit, nearly 39% of FY26 earnings”, 1 November 2026.
- PSU Connect, “IOC Q2 PAT surges 184% to Rs 21,630 cr”, October 2026.
- Indian Masterminds, IOC Q2 FY27 results, 30 October 2026.
- Free Press Journal and PSU Watch, IOC Q2 FY27 reports, 30 October 2026.
- Business Today and Quartr, IOC Q2 FY26 reports, for the year-ago base.
Editorial disclosure: PositionalCalls.com is an independent research and education site founded by Shubham Chaudhary. PositionalCalls.com is not a SEBI-registered research analyst or investment adviser. Investments in securities markets are subject to market risks. Read all related documents carefully before investing. Returns are never guaranteed. How I researched this: I read the company’s results as reported by PTI, Business Standard and PSU Connect, compared figures across sources, recalculated every derived number shown as my calculation, and listed disagreements instead of choosing the more exciting number.

Shubham Chaudhary is the founder of PositionalCalls, an independent Indian stock market research website. He writes company fundamentals, quarterly results analysis, IPO analysis and sector research for NSE and BSE listed companies, with a focus on banking stocks, insurance and long-term value investing. Every article is built from primary sources such as RBI, SEBI, NSE and BSE filings and company annual reports, and states its risks plainly in simple language for retail investors.
Coverage areas Our research standards- Numbers checked against NSE, BSE and SEBI filings
- Risks and limits stated in every article
- No paid promotions or broker tie-ups
- Articles updated when new filings arrive