
Results analysis · Pharma
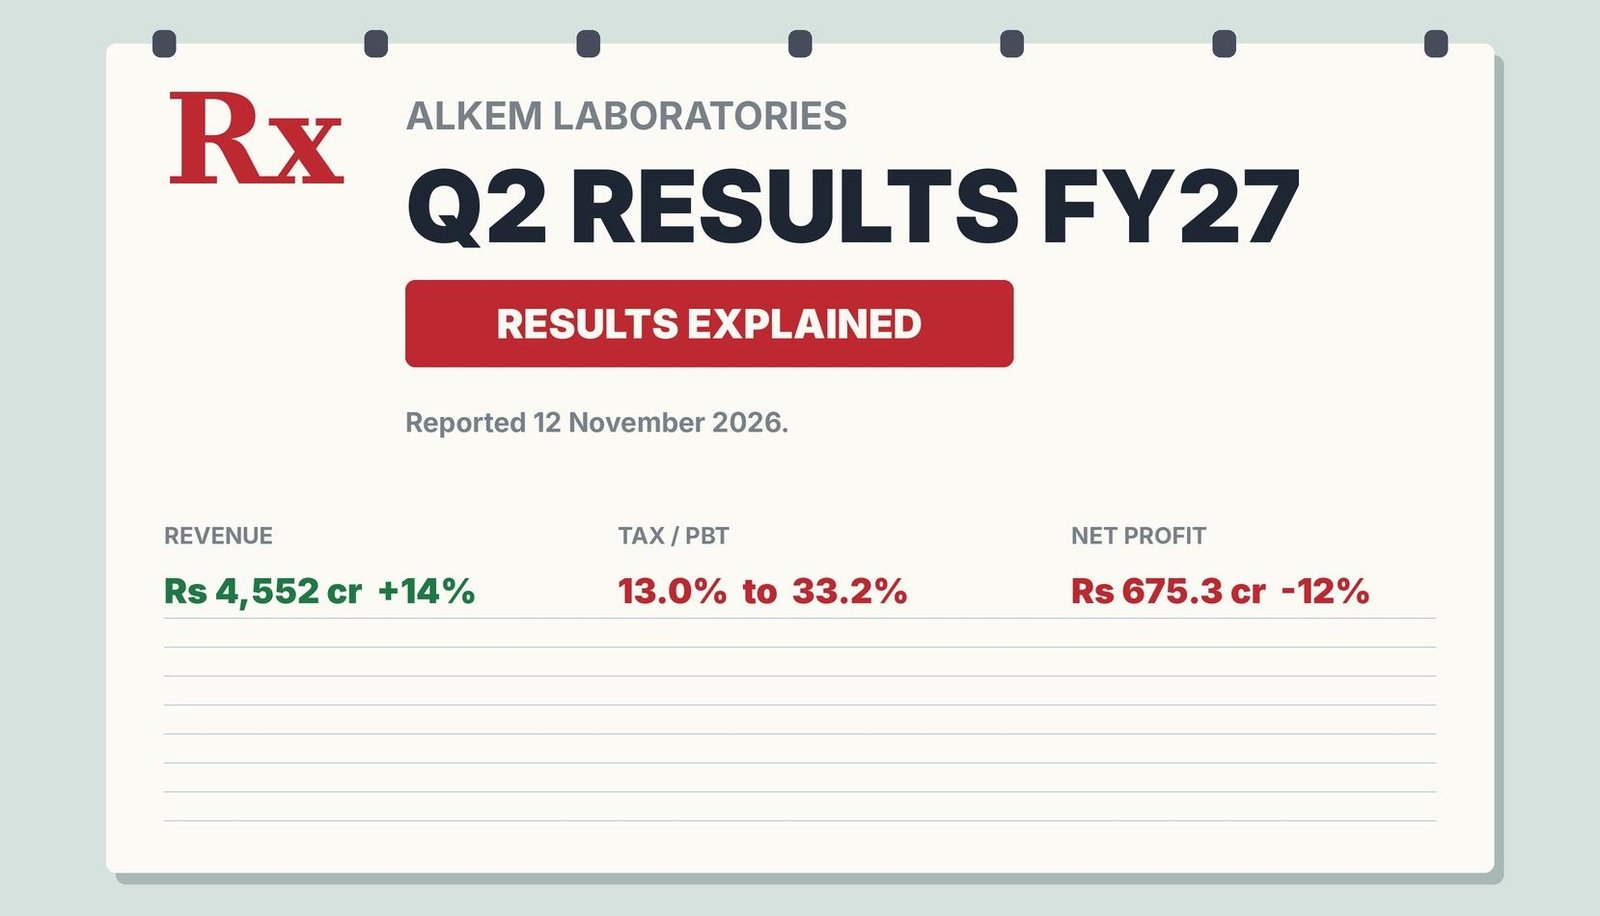
Looking for the Alkem Laboratories Q2 results FY27? Alkem reported on 12 November 2026: revenue up 14%, profit before tax up 12%, net profit down 12% on a much higher tax charge. This page lays out the figures, the tax arithmetic, the segments, where sources disagree and what to check in the filing.
Quick answer
Alkem Laboratories Q2 results FY27: revenue rose 13.8% to Rs 4,552 crore and profit before tax rose 11.6%, but net profit fell 11.7% to Rs 675.3 crore because tax jumped to about 33% of profit before tax from about 13%. EBITDA margin was 22.5%. This page gives no target or call.
Latest update (Thursday, 12 November 2026, 3:50 PM IST): Alkem reported Q2 FY27 consolidated results on Thursday, 12 November 2026, with the first reports at about 2:00 PM IST during market hours. I did not find a dividend announcement, an analyst consensus, an official closing price or a call summary, and I have not opened the exchange filing.
Key takeaways
- Revenue: revenue from operations was Rs 4,551.99 crore, up 13.8% from Rs 4,000.99 crore and up 21.7% on Q1 FY27, per Upstox and Multibagg.
- Profit: net profit was Rs 675.34 crore, down 11.7% from Rs 765.06 crore; a second report shows Rs 667.1 crore against Rs 779.1 crore on what looks like a different basis.
- Tax: tax was Rs 331.9 crore on profit before tax of Rs 999.7 crore, about 33.2% against about 13.0% a year earlier (my calculation from Free Press Journal figures).
- Margin: EBITDA was Rs 1,025.2 crore at 22.5% against 23.0%; EBITDA grew 11.3%, not the 22.5% one headline states.
- Segments: India sales Rs 3,027.5 crore (+9.5%), international Rs 1,454 crore (+22.3%), US Rs 783 crore (+2.4%), non-US international Rs 671 crore (+58%).
- Price: the NSE low was Rs 5,173, down as much as 5.05%, on 12 November; I found no official close and no dividend.
In plain words: Alkem Laboratories is an Indian drug maker that sells branded medicines in India, generics in the US and other markets, and has smaller biotech and medical-device businesses. Its profit depends on sales mix, research spending and the tax it pays.
Data note: Figures are as of 12 November 2026, 3:50 PM IST and are consolidated. They follow Upstox, Free Press Journal and two Multibagg summaries of the investor presentation, which agree on revenue but differ on profit, EBITDA growth and some segment lines. I could not open the exchange filing. Derived numbers are my calculation. Estimates and guidance quoted from a source are that source’s, not mine.
In this post
- What did Alkem report in Q2 FY27?
- What was the Q2 FY26 base?
- Why did profit fall when profit before tax rose?
- Which profit figure is right?
- What happened to the margin?
- Segments: India, US and the rest
- What do Q1 and H1 show?
- Preview marks against the result
- Cash, R&D and the Daman plant
- What did the price do?
- Dividend and the new CFO
- What did the preview say?
- What does the tax arithmetic show?
- Next-filing decoder
- How to read the filing
- What most people miss
- FAQs
- Sources
What did Alkem report in the Alkem Laboratories Q2 results FY27, and how big was the change?
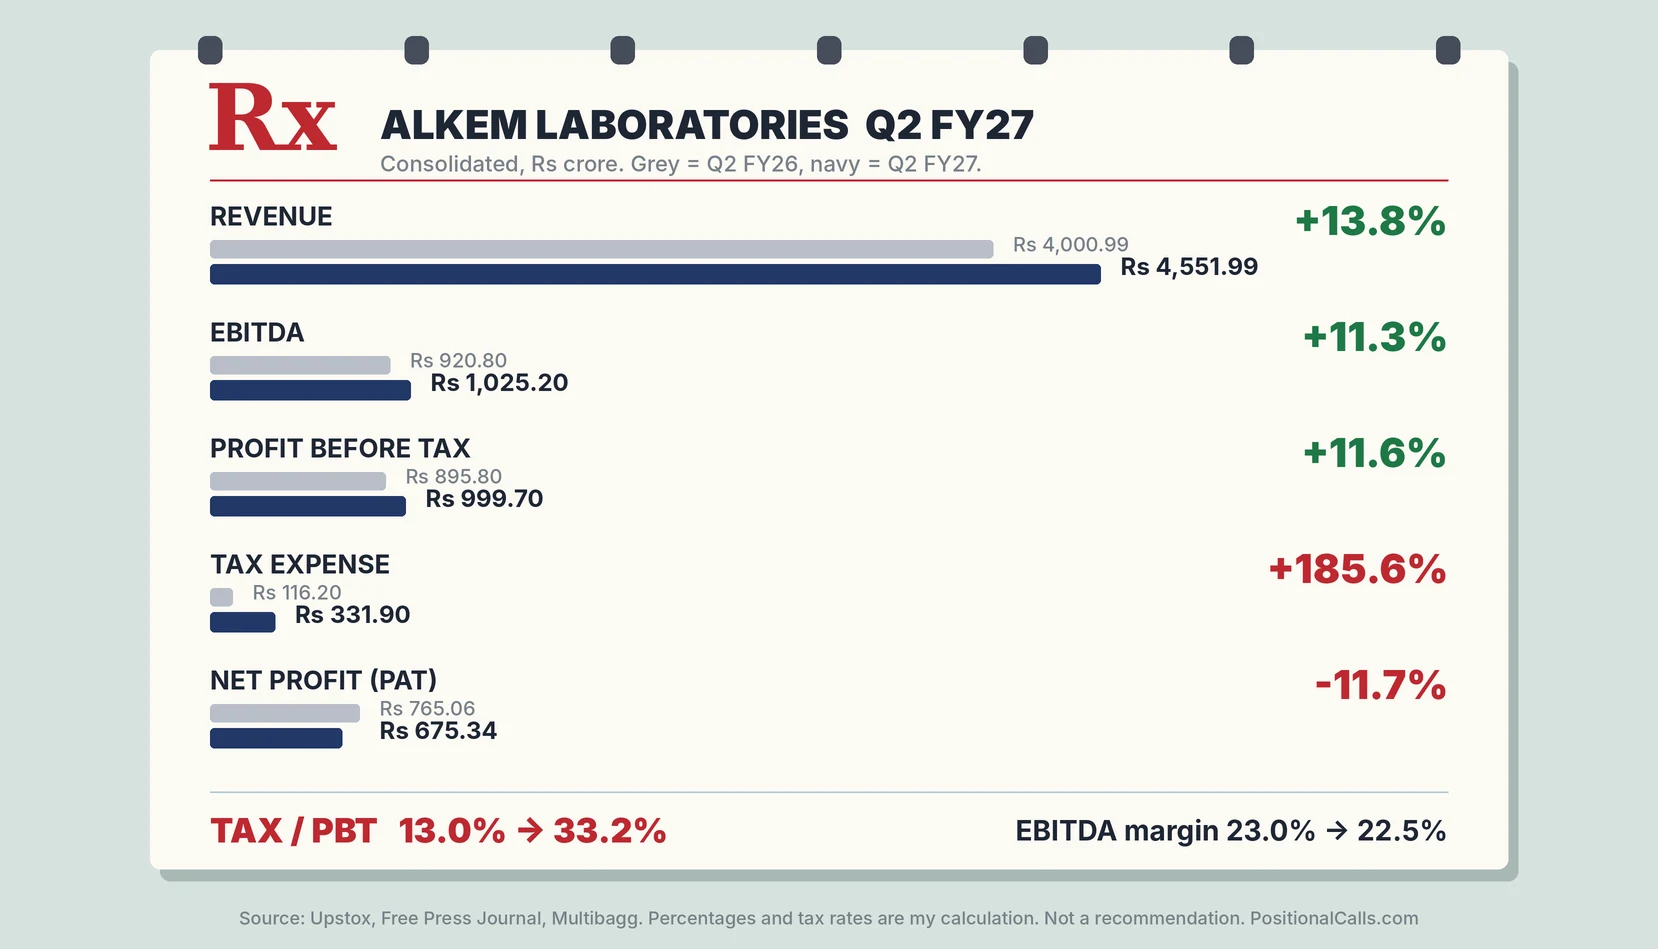
In the Alkem Laboratories Q2 results FY27, consolidated revenue from operations was Rs 4,551.99 crore, up 13.8% from Rs 4,000.99 crore. EBITDA was Rs 1,025.2 crore, up 11.3%, and net profit was Rs 675.34 crore, down 11.7% from Rs 765.06 crore, per Upstox and Multibagg.
The results covered the quarter to 30 September 2026. Reports appeared from about 2:00 PM IST on Thursday, 12 November 2026, while the market was open (Multibagg 2:00 PM, Upstox updated 3:01 PM, Free Press Journal 3:07 PM). The figures below are consolidated. I have not opened the filing, so every number is as reported by the sources named.
| Reported figures (quarter to 30 Sep 2026) | Q2 FY27 | Q2 FY26 | Change |
|---|---|---|---|
| Revenue from operations | Rs 4,551.99 crore | Rs 4,000.99 crore | +13.8% |
| Total income | Rs 4,686 crore | Rs 4,105 crore | +14.2% |
| Total expenses | Rs 3,722 crore | Rs 3,209 crore | +16.0% (my calculation) |
| EBITDA | Rs 1,025.2 crore | Rs 920.8 crore | +11.3% (my calculation) |
| Profit before tax | Rs 999.7 crore | Rs 895.8 crore | +11.6% |
| Tax expense | Rs 331.9 crore | Rs 116.2 crore | +185.6% (my calculation) |
| Net profit (Multibagg, Upstox) | Rs 675.34 crore | Rs 765.06 crore | -11.7% |
| Earnings per share | Rs 56.48 | Rs 63.99 | -11.7% |
Cite this table: Alkem Q2 FY27 consolidated results per Upstox, Free Press Journal and Multibagg; derived changes calculated by PositionalCalls.
These tie in an interesting way. Total income of Rs 4,686 crore less expenses of Rs 3,722 crore is Rs 964 crore, and adding the Rs 35 crore exceptional gain Free Press Journal reports gives Rs 999 crore, matching profit before tax of Rs 999.7 crore. Profit before tax less tax is Rs 667.8 crore, close to the Rs 667.1 crore in the same report (my calculation). The Rs 675.34 crore figure is a different measure, discussed below. Total income less revenue gives about Rs 134 crore against about Rs 104 crore a year earlier; I read that as other income, but the source does not label it.
Which basis does the Alkem Laboratories Q2 results FY27 headline use?
Upstox and Multibagg quote a profit of Rs 675.34 crore, down 11.7%, with earnings per share of Rs 56.48 (down 11.7%). Free Press Journal quotes consolidated net profit of Rs 667.1 crore, down 14.4% from Rs 779.1 crore. The sources do not explain the difference, so I do not pick one as the only correct figure; see the section on which profit figure is right.
What was the Q2 FY26 base, and does it tie to the Alkem Laboratories Q2 results FY27?
The Q2 FY26 base was revenue of Rs 4,001 crore, EBITDA of Rs 920.8 crore at a 23.0% margin and net profit of Rs 765.1 crore, reported on 13 November 2025. The Q2 FY27 growth rates tie to that base within rounding.
| Q2 FY26 base (earlier preview) | Figure | Q2 FY27 figure | Ties? |
|---|---|---|---|
| Revenue from operations | Rs 4,001 crore | Rs 4,551.99 crore | Yes: +13.8% |
| EBITDA | Rs 920.8 crore; margin 23.0% | Rs 1,025.2 crore; 22.5% | Yes: +11.3%; one headline says 22.5% |
| Net profit | Rs 765.1 crore (Outlook: Rs 779 crore) | Rs 675.34 crore (Rs 667.1 crore) | Yes on each basis: -11.7% and -14.4% |
| India sales | Rs 2,766 crore | Rs 3,027.5 crore | Yes: +9.5% (my calculation) |
| International sales | Rs 1,189 crore | Rs 1,454 crore | Yes: +22.3% |
| US sales | Rs 764.9 crore | Rs 783 crore | Yes: +2.4% |
Cite this table: Alkem Q2 FY26 base per my earlier preview page; Q2 FY27 comparison by PositionalCalls.
My earlier preview had already noted that last year’s profit appears as Rs 765.1 crore in some reports and Rs 779 crore in Outlook, and recorded Q1 FY27 tax of Rs 251 crore against Rs 103 crore. The two Q2 FY26 profit figures differ by about Rs 14 crore and the two Q2 FY27 figures by about Rs 8 crore, in the opposite direction, which suggests a consistent difference of basis, not an error (my reading).
Why did Alkem profit fall in the Alkem Laboratories Q2 results FY27 when profit before tax rose?
Tax expense rose from Rs 116.2 crore to Rs 331.9 crore. That is about 33.2% of profit before tax against about 13.0% a year earlier (my calculation), so profit before tax rose 11.6% while net profit fell. Free Press Journal attributes the fall to the higher tax charge.
| Tax arithmetic (my calculation) | Q2 FY27 | Q2 FY26 | Change |
|---|---|---|---|
| Profit before tax | Rs 999.7 crore | Rs 895.8 crore | +11.6% |
| Tax expense | Rs 331.9 crore | Rs 116.2 crore | +185.6% |
| Tax as % of profit before tax | 33.2% | 13.0% | +20.2 points |
| Profit before tax less tax | Rs 667.8 crore | Rs 779.6 crore | -14.3% |
| Net margin on revenue (total profit basis) | 14.7% | 19.5% | -4.8 points |
| Q1 FY27 tax rate (my earlier preview) | About 32.6% | About 13.4% (Q1 FY26) | Same step-up in Q1 |
Cite this table: Alkem tax lines per Free Press Journal and my earlier preview; ratios calculated by PositionalCalls.
The reports I read do not explain why the rate rose so sharply, and I will not guess. Q1 FY27 also had a rate near 32.6% (my calculation from my earlier preview), so this is not a one-quarter event. The preview recorded a company expectation of a 30 to 32% tax rate for FY27, through CompoundingAI and unverified; Q2 at about 33.2% is above that range. The line to find in the filing is the tax note, which reconciles the statutory rate to the effective rate.
One more detail separates operations from the exceptional gain. Free Press Journal reports an exceptional gain of Rs 35 crore from a recovery against a previously impaired investment. Taking it out, profit before tax would be about Rs 964.7 crore, up about 7.7% on Rs 895.8 crore (my calculation), which is slower than revenue growth of 13.8%.
Which profit figure is right in the Alkem Laboratories Q2 results FY27?
Both appear in reports: Rs 675.34 crore (Upstox, Multibagg) and Rs 667.1 crore (Free Press Journal). The gap of Rs 8.24 crore matches a reversed gap of Rs 14.04 crore a year earlier. I read it as a basis difference, probably the share attributable to minority holders, but no source says so.
| Profit figure | Q2 FY27 | Q2 FY26 | Growth | Source |
|---|---|---|---|---|
| Net profit (reported PAT) | Rs 675.34 crore | Rs 765.06 crore | -11.7% | Upstox; Multibagg |
| Consolidated net profit | Rs 667.1 crore | Rs 779.1 crore | -14.4% | Free Press Journal |
| Difference, my calculation | Rs 8.24 crore | Minus Rs 14.04 crore | Sign reverses | My calculation |
| Earnings per share | Rs 56.48 | Rs 63.99 | -11.7% | Free Press Journal |
| Implied share count | About 11.96 crore | About 11.96 crore | Unchanged | My calculation: profit over EPS |
Cite this table: Alkem profit versions as reported; not reconciled to the filing. Differences calculated by PositionalCalls.
The earnings per share of Rs 56.48 divides into Rs 675.34 crore at about 11.96 crore shares, so the per-share figure follows the Rs 675.34 crore version (my calculation). The biotech and medical-device segments reported losses (Rs 114.1 crore and Rs 49.6 crore per Free Press Journal), and part of such losses can fall to minority holders when a company owns less than all of a subsidiary, such as the 55% stake in Occlutech. That is a plausible reading and I could not confirm it. Use the filing’s split of profit between owners and minorities.
What happened to the margin in the Alkem Laboratories Q2 results FY27?
EBITDA was Rs 1,025.2 crore, up 11.3%, and the margin was 22.5% against 23.0%, down about 50 basis points. Gross margin rose 220 basis points to 67.2%, so the squeeze came below the gross line, where research spending rose 50%, per Multibagg.
| Margin lines | Q2 FY27 | Q2 FY26 or Q1 FY27 | Change |
|---|---|---|---|
| EBITDA margin | 22.5% | 23.0% (Q2 FY26) | -50 basis points |
| EBITDA margin against Q1 FY27 | 22.5% | 20.5% (Q1 FY27) | +2.0 points |
| Gross margin | 67.2% | About 65.0% (my calculation) | +220 basis points (Multibagg) |
| Research and development | Rs 195.3 crore | Rs 130.2 crore | +50.0% (my calculation) |
| R&D as % of revenue | 4.3% | 3.3% | +1.0 point |
| Total expenses growth against revenue growth | +16.0% | +13.8% | Costs faster than sales |
Cite this table: Alkem margin lines per Multibagg and Free Press Journal; calculations by PositionalCalls.
Two things are worth separating. First, the EBITDA growth: Upstox and its headline say EBITDA grew 22.5%, but Rs 1,025.2 crore against Rs 920.8 crore is 11.3%, and 22.5% is the margin, so the growth figure appears to be an error; Multibagg gives 11.3%. Second, the margin against the preview mark: my earlier preview recorded a company expectation of an EBITDA margin of 20 to 21% for FY27 (CompoundingAI, unverified), and Q2 at 22.5% was above it.
What do the segments say about the Alkem Laboratories Q2 results FY27?
India sales were Rs 3,027.5 crore, up 9.5%, and international sales Rs 1,454 crore, up 22.3%. Within international, the US was Rs 783 crore (+2.4%) and non-US Rs 671 crore (+58%). The chronic portfolio grew 22.4% against 16.0% for the market, per Multibagg.
| Segment (Rs crore) | Q2 FY27 | Q2 FY26 | Change | Share of Q2 FY27 sales |
|---|---|---|---|---|
| India sales | 3,027.5 | 2,766 | +9.5% | About 68% |
| International sales | 1,454 | 1,189 | +22.3% | About 32% |
| of which US | 783 | 764.9 | +2.4% | About 17% |
| of which non-US international | 671 | About 424 (my calculation) | +58% | About 15% |
| Biotech sales | 70.4 (129.8 in another report) | About 108 (my calculation) | -35% | About 2% |
| MedTech sales (with Occlutech) | 133.1 | Not stated | n/a | About 3% |
Cite this table: Alkem segment lines per Upstox, Multibagg and Free Press Journal; shares and gaps calculated by PositionalCalls.
India sales of Rs 3,027.5 crore divided by Rs 2,766 crore is 9.5% (my calculation), which ties to Multibagg. Multibagg also says overall India growth matched the Indian pharmaceutical market at 13.8%, which is the consolidated revenue growth and not the India sales growth, so I treat that line as unreliable. Biotech sales are Rs 70.4 crore in one summary and Rs 129.8 crore in the Free Press Journal segment table; the second may be segment revenue before eliminations, but I could not tell. The chronic portfolio grew 22.4% against 16.0% for the market, anti-diabetics 27.2% and pain and analgesics 23.9%, while acute therapies grew 12.1% against 12.3% (Multibagg).
PositionalCalls WhatsApp channel
The results, then the tax check
- The revenue, tax and profit lines as soon as they appear
- Segment and plant updates explained
- Links to the updated page
Non-US international sales of Rs 671 crore are up 58% including Occlutech, the Swiss medical-device business in which Alkem completed a 55% stake in July 2026 and consolidated from 16 July; excluding it, growth was 29% on a year earlier and 14% on Q1 (Multibagg). The US grew only 2.4%, described as largely volume-led.
What do Q1 FY27 and the first half show about the Alkem Laboratories Q2 results FY27?
First-half revenue was Rs 8,292 crore, up 12.5% from Rs 7,372 crore, and first-half profit was about Rs 1,188 crore, down 17.9% from Rs 1,447 crore, per Free Press Journal. Q2 revenue was 21.7% above Q1 FY27 and profit 29.9% above it.
| Period view | FY27 | FY26 | Change |
|---|---|---|---|
| H1 revenue | Rs 8,292 crore | Rs 7,372 crore | +12.5% |
| H1 net profit (Free Press Journal basis) | Rs 1,188 crore | Rs 1,447 crore | -17.9% |
| Q2 revenue against Q1 FY27 | Rs 4,551.99 crore | Rs 3,740.15 crore (Q1 FY27) | +21.7% |
| Q2 net profit against Q1 FY27 | Rs 675.34 crore | Rs 519.96 crore (Q1 FY27) | +29.9% |
| Q2 EBITDA against Q1 FY27 | Rs 1,025.2 crore | Rs 766.1 crore (Q1 FY27) | +33.8% (my calculation) |
| H1 EBITDA margin | About 21.7% | Rs 1,791 crore on Rs 8,292 crore | My calculation |
Cite this table: Alkem H1 and sequential figures per Free Press Journal, Multibagg and my earlier preview; ratios by PositionalCalls.
Revenue ties exactly: Rs 3,740.15 crore plus Rs 4,551.99 crore is Rs 8,292.14 crore. Profit ties on the Free Press Journal basis: about Rs 521 crore plus Rs 667.1 crore is Rs 1,188 crore, while Rs 519.96 crore plus Rs 675.34 crore is Rs 1,195 crore (my calculation), another sign the two sources use different profit bases. Q1 EBITDA is Rs 766.1 crore in Multibagg and Rs 766.6 crore in my earlier preview. Q2 was much stronger than Q1 on every line, partly because Q1 had the same high tax rate on a smaller profit before tax.
How do the Alkem Laboratories Q2 results FY27 compare with the marks quoted in the preview?
My earlier preview recorded unverified FY27 marks from CompoundingAI: EBITDA margin 20 to 21%, gross margin 66.5 to 67%, tax 30 to 32% and India growth 100 to 150 basis points above the market. Q2 was above the first two, above the tax range, and I cannot test the last.
| Mark (CompoundingAI, unverified) | Mark range | Q2 FY27 actual | Reading, my calculation |
|---|---|---|---|
| FY27 EBITDA margin | 20 to 21% | 22.5% | Above the range |
| FY27 gross margin | 66.5 to 67% | 67.2% (Multibagg) | Slightly above |
| FY27 tax rate | 30 to 32% | About 33.2% | Above the range |
| India growth against the market | +100 to 150 basis points | Chronic +640 basis points; India total not tied | Cannot test |
Cite this table: Alkem marks as recorded in my earlier preview from a single source; Q2 comparison by PositionalCalls. Not verified against management statements.
What do cash, research spending and the Daman plant add to the Alkem Laboratories Q2 results FY27?
Multibagg reports net cash of Rs 4,905.4 crore at 30 September 2026, research spending of Rs 195.3 crore, 193 US ANDA filings with 170 approvals and none in Q2, and Daman formulations facility status of OAI, with remediation in progress and no completion date given.
| Item | Reported | Source | Comment |
|---|---|---|---|
| Net cash, 30 Sep 2026 | Rs 4,905.4 crore | Multibagg | Definition not given |
| Research and development | Rs 195.3 crore, 4.3% of revenue | Multibagg | Rs 130.2 crore, 3.3% a year earlier |
| US ANDA filings and approvals | 193 and 170 (18 tentative) | Multibagg | No ANDA approvals in Q2 |
| NDAs and BLA | Two NDAs approved; one NDA and one BLA filed | Multibagg | Timing not stated |
| Daman formulations plant | OAI status; remediation in progress | Multibagg | No completion date given |
| Products launched, H1 FY27 | 26 | Multibagg | About 14,500 medical representatives |
Cite this table: Alkem balance sheet and pipeline lines per Multibagg; not verified against the filing.
Upstox reports the shares fell as much as 5.05% on 12 November 2026 to an NSE low of Rs 5,173, with a market capitalisation of Rs 62,891.19 crore. The time of the low is not given, and I did not find the official close.
| Price item | Figure | Source or basis |
|---|---|---|
| Intraday low, 12 Nov 2026 | Rs 5,173 (-5.05%) | Upstox, NSE; time not stated |
| Implied previous close | About Rs 5,448 | My calculation: 5,173 divided by 0.9495 |
| Market capitalisation | Rs 62,891.19 crore | Upstox, NSE, 12 Nov 2026 |
| Price on 13 Nov 2025 (Q2 FY26 day) | Rs 5,722.20 | My earlier preview; stale |
| Low against that price | -9.6% | My calculation: 5,173 / 5,722.20 – 1 |
Cite this table: Alkem price figures as reported on 12 November 2026; the official close was not found.
Was a dividend announced with the Alkem Laboratories Q2 results FY27, and who is the new CFO?
I did not find a dividend announcement with the Q2 result. The board appointed Gopal Kothari as Chief Financial Officer and key managerial personnel, effective 2 December 2026, per Upstox. Check the exchange announcements for any dividend and its record date.
| Item | Reported | Status |
|---|---|---|
| Dividend with Q2 FY27 | Not found in reports | Check NSE and BSE announcements |
| Record date | Not found | No date to quote |
| New Chief Financial Officer | Gopal Kothari, effective 2 Dec 2026 | Upstox, 12 Nov 2026 |
| Management comment | Continued momentum in India across acute and chronic portfolios | Sandeep Singh, MD, as quoted by Upstox |
Cite this table: Alkem payout and management status as of the time stated; not verified against filings.
A dividend does not change the results, but it moves cash out of the company and appears in the price on the ex-date. If you hold Alkem, the tax treatment of any dividend is covered in dividend tax in India; sales are covered in capital gains tax on shares.
What did the preview say, and how did the Alkem Laboratories Q2 results FY27 compare?
The Alkem Laboratories Q2 results date FY27 preview named Rs 4,001 crore revenue, Rs 920.8 crore EBITDA and Rs 765.1 crore profit as marks, and flagged the tax step-up seen in Q1. Revenue and EBITDA went above them; profit went below them.
| Preview mark | Preview figure | Reported in Q2 FY27 | Outcome |
|---|---|---|---|
| Revenue | Rs 4,001 crore | Rs 4,551.99 crore | Above, +13.8% |
| EBITDA | Rs 920.8 crore | Rs 1,025.2 crore | Above, +11.3% |
| EBITDA margin | 23.0% | 22.5% | Below |
| Net profit | Rs 765.1 crore | Rs 675.34 crore | Below, -11.7% |
| Sequential mark: Q1 FY27 profit | Rs 520 crore | Rs 675.34 crore | Above, +29.9% |
| Tax rate mark (Q1) | About 32.6% | About 33.2% | Slightly higher |
Cite this table: Preview marks against reported figures; outcomes calculated by PositionalCalls.
The preview flagged the tax charge as the line to watch because Q1 profit had fallen 21.7% on a tax rate near 32.6% against 13.4%; Q2 repeated that pattern. The preview made no call on direction and this page makes none either; it records what was reported.
What does the tax arithmetic on the Alkem Laboratories Q2 results FY27 show?
At profit before tax of Rs 999.7 crore, each percentage point of tax rate is worth about Rs 10 crore of profit, about 1.5% of profit. At last year’s 13.0% rate, profit would have been about Rs 870 crore. This is my arithmetic, not a forecast.
| Tax rate applied to Rs 999.7 crore | Profit after tax, Rs crore | Against reported about Rs 667 crore |
|---|---|---|
| 13.0% (Q2 FY26 rate) | 870 | +203 |
| 25.0% | 750 | +83 |
| 30.0% (lower end of the quoted FY27 range) | 700 | +33 |
| 32.0% (upper end) | 680 | +13 |
| 33.2% (reported) | 668 | +1 |
Cite this table: Alkem tax sensitivity, my calculation on fixed profit before tax; ignores minorities and associates. Illustrations, not forecasts.
How do I read the next Alkem results after the Alkem Laboratories Q2 results FY27?
On the next results read, in this order: revenue against Rs 4,552 crore, profit before tax against Rs 999.7 crore, the tax rate against 33.2%, EBITDA margin against 22.5%, India and US sales, and the Daman plant status.
| Order | Line to read | Mark to compare | Why it comes first |
|---|---|---|---|
| 1 | Revenue | Rs 4,552 crore; H1 Rs 8,292 crore | Growth of the business |
| 2 | Profit before tax | Rs 999.7 crore; ex exceptional about Rs 965 crore | Before the tax line |
| 3 | Tax rate | 33.2%; Q2 FY26 13.0% | Drove the profit fall |
| 4 | Net profit and basis | Rs 675.34 crore or Rs 667.1 crore | Check which basis |
| 5 | EBITDA margin | 22.5%; gross 67.2% | Operating strength |
| 6 | India and US sales | Rs 3,027.5 crore; Rs 783 crore | Segment growth |
| 7 | Daman plant and dividend | OAI status; no dividend found | Risk and payout |
Cite this table: Alkem reading order, PositionalCalls.
For any summary or target you read elsewhere, compare its assumptions with these lines: the tax rate, the profit basis and the exceptional gain. If it does not state them, you cannot check it.
How do I read the Alkem filing and avoid fake tips?
Open the NSE or BSE announcement for Alkem Laboratories Limited, not a link in a message, and read the consolidated results table first. Treat any tip that asks for an OTP, payment or login, or promises a target, as fake.
- Open the exchange announcement page for Alkem Laboratories Limited.
- Read the unaudited results for the quarter and half year ended 30 September 2026, consolidated and standalone.
- Note revenue, other income, expenses, exceptional items, profit before tax, tax and profit.
- Compare with Rs 4,552 crore, Rs 999.7 crore and Rs 675.34 crore, and note the split between owners and minorities.
- Read the tax note and the segment note.
- Check the dividend announcement and the record date.
PositionalCalls is not SEBI-registered, gives no buy or sell calls and never asks for payment. Nothing here is investment advice.
What do most people miss in the Alkem Laboratories Q2 results FY27?
Most readers see profit down 12% and miss that profit before tax rose 11.6%, that tax tripled, that a Rs 35 crore exceptional gain helped, that two profit figures circulate and that one headline overstates EBITDA growth.
Analyst’s note. What stands out: operating profit grew, so the profit fall comes almost entirely from the tax line (my reading). What is easy to miss: the exceptional gain of Rs 35 crore flatters profit before tax, and the tax rate was already high in Q1. What would change the view: a filing that explains the tax rate or splits profit differently. Caution: figures come from media reports and I did not open the filing. Reader action: read profit before tax, then tax, then the basis of profit.
Bottom line
Alkem reported revenue of Rs 4,552 crore (+13.8%), EBITDA of Rs 1,025 crore (+11.3%), profit before tax of Rs 999.7 crore (+11.6%) and net profit of Rs 675.34 crore (-11.7%), with tax at about 33% of profit before tax. There is no target or call on this page. I will update this page when the filing is read or the next results appear. See our earnings coverage.
PositionalCalls WhatsApp channel
Never miss an update
- Results dates and payout dates
- Numbers explained without tips or targets
- Updated posts as they go live
Alkem Laboratories Q2 results FY27: frequently asked questions
What did Alkem report in the Alkem Laboratories Q2 results FY27?
In the Alkem Laboratories Q2 results FY27, consolidated revenue from operations was Rs 4,551.99 crore, up 13.8%, and net profit was Rs 675.34 crore, down 11.7%, reported on 12 November 2026. EBITDA was Rs 1,025.2 crore at a 22.5% margin. Figures are from Upstox and Multibagg; check the filing.
What was Alkem net profit in Q2 FY27?
Net profit was Rs 675.34 crore against Rs 765.06 crore a year earlier, down 11.7%, per Upstox and Multibagg. Free Press Journal shows consolidated net profit of Rs 667.1 crore against Rs 779.1 crore, down 14.4%, which looks like a different basis. First-half profit was about Rs 1,188 crore.
Why did Alkem profit fall when revenue rose 14%?
Tax expense rose to Rs 331.9 crore from Rs 116.2 crore, about 33.2% of profit before tax against about 13.0%, my calculation from Free Press Journal figures. Profit before tax itself rose 11.6%. A Rs 35 crore exceptional gain helped. The reports do not explain the tax rise.
What was Alkem EBITDA margin in Q2 FY27?
EBITDA was Rs 1,025.2 crore against Rs 920.8 crore, up 11.3%, and the margin was 22.5% against 23.0%, down about 50 basis points, per Multibagg. One Upstox headline says EBITDA grew 22.5%, which is the margin and not the growth. Gross margin was 67.2%.
How did Alkem India and US sales do in Q2 FY27?
India sales were Rs 3,027.5 crore, up 9.5%, and US sales were Rs 783 crore, up 2.4%, per Upstox. International sales were Rs 1,454 crore, up 22.3%, with non-US up 58% including Occlutech. The chronic portfolio grew 22.4% against 16.0% for the market.
Did Alkem announce a dividend with Q2 results?
I did not find a dividend announcement with the Q2 result. The board appointed Gopal Kothari as Chief Financial Officer, effective 2 December 2026, per Upstox. Check NSE and BSE announcements for any dividend and its record date for the Alkem Laboratories Q2 results FY27.
Upstox reported the shares fell as much as 5.05% on 12 November 2026 to an NSE low of Rs 5,173, with a market capitalisation of Rs 62,891.19 crore. The time of the low is not given and I did not find the official close. Brokerage targets are not used here.
What is the Q2 FY26 base for Alkem?
The Q2 FY26 base was revenue of Rs 4,001 crore, EBITDA of Rs 920.8 crore and net profit of Rs 765.1 crore, with Outlook showing Rs 779 crore, per my earlier preview. The Q2 FY27 growth rates tie to that base within rounding, per my calculation.
What is the Daman plant issue at Alkem?
Multibagg reports that Alkem’s Daman formulations facility has OAI status after a US inspection, with remediation in progress and no completion date given. There were no US ANDA approvals in Q2, and US sales grew 2.4%. Check the filing and call for how the status affects supply.
Is this page financial advice about Alkem?
No. This page is not investment advice, a target or a recommendation, and PositionalCalls is not SEBI-registered. It reports company figures and sources with dates. Read the exchange filing for the Alkem Laboratories Q2 results FY27 and consult a registered adviser before any decision.
Sources
- NSE India: corporate announcements: results and dividend notices.
- BSE India: corporate announcements: the results filing.
- Upstox: Alkem Laboratories Q2 profit falls 12%, 12 November 2026, updated 3:01 PM IST.
- Free Press Journal: Alkem Laboratories Q2 profit falls 14%, 12 November 2026, 3:07 PM IST.
- Multibagg: Alkem Q2 revenue rises 13.8%, profit drops 11.7%, 12 November 2026, 2:00 PM IST.
- Multibagg: Alkem chronic portfolio outpaced the market, 12 November 2026, 2:00 PM IST.
- PositionalCalls: Alkem Laboratories Q2 results date FY27 preview, 12 November 2026.
Disclosure: PositionalCalls.com is not a SEBI-registered research analyst or investment adviser. Investments in securities markets are subject to market risks. Read all related documents carefully before investing. Returns are never guaranteed. PositionalCalls is an independent research and education site founded by Shubham Chaudhary. Nothing here is a recommendation, target or investment advice. How I researched this: for this page on the Alkem Laboratories Q2 results FY27 I read Upstox, Free Press Journal and Multibagg, noted where sources differ, and marked every derived number as my calculation. I did not open any company filing or exchange document. Figures are as of 12 November 2026, 3:50 PM IST.

Shubham Chaudhary is the founder of PositionalCalls, an independent Indian stock market research website. He writes company fundamentals, quarterly results analysis, IPO analysis and sector research for NSE and BSE listed companies, with a focus on banking stocks, insurance and long-term value investing. Every article is built from primary sources such as RBI, SEBI, NSE and BSE filings and company annual reports, and states its risks plainly in simple language for retail investors.
Coverage areas Our research standards- Numbers checked against NSE, BSE and SEBI filings
- Risks and limits stated in every article
- No paid promotions or broker tie-ups
- Articles updated when new filings arrive