
Earnings · Oil and Gas · Q2 FY27 results declared
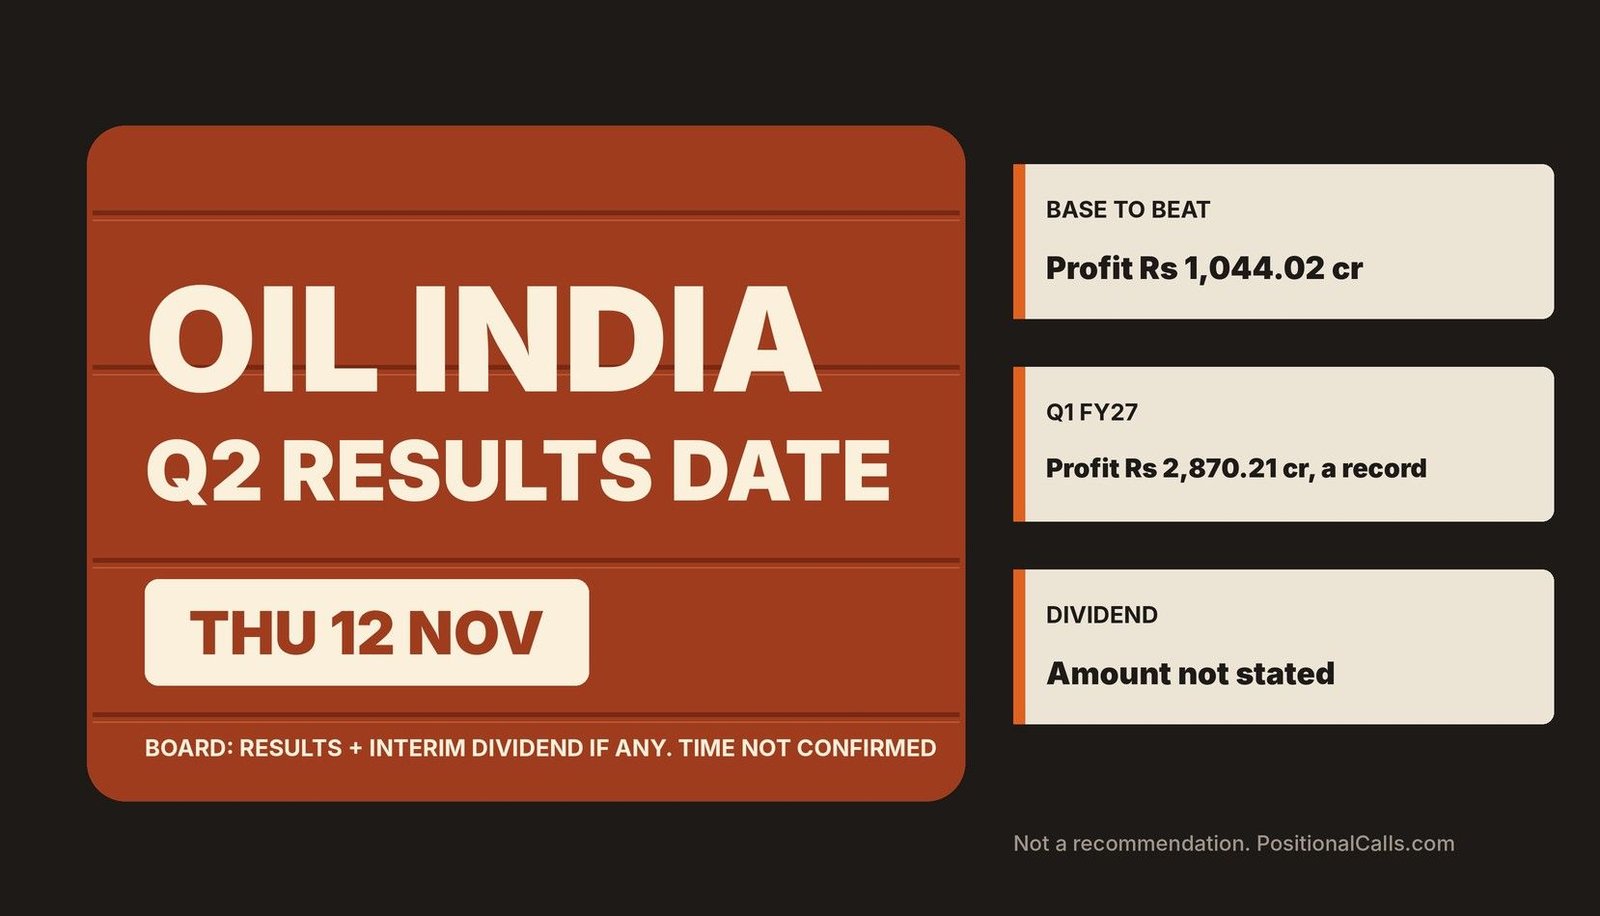
The Oil India Q2 results date was Thursday, 12 November 2026, and the numbers are out: consolidated profit up 61.6% to Rs 2,309 crore, revenue up 29.9% to Rs 11,915 crore and an interim dividend of Rs 7 a share. This page keeps the date, the base and the refinery marks, and links to the full Oil India Q2 results FY27 analysis.
Quick answer
The Oil India Q2 results date was Thursday, 12 November 2026. Consolidated profit was Rs 2,309 crore, up 61.6% from Rs 1,428.83 crore, on revenue of Rs 11,915 crore, per the Upstox live blog. The board declared a Rs 7 interim dividend, record date 20 November, per Investywise.
Latest update (Thursday, 12 November 2026, 4:30 PM IST): Oil India reported Q2 FY27 results on Thursday, 12 November 2026; the Upstox live blog carried the consolidated figures at 3:57 PM IST and Investywise the dividend notice at about 3:50 PM IST. I found no standalone figures, realisation, analyst consensus or post-result price, and I have not opened the exchange filing. The earlier preview marks are kept below so the result can be checked against them.
Key takeaways
- Date: the board met on Thursday, 12 November 2026, as PSU Connect had reported; the first reports came at about 3:50 PM IST, after the market close.
- Result: consolidated profit Rs 2,309 crore (+61.6%) and revenue Rs 11,915 crore (+29.86%); the revenue growth ties to the Rs 9,175 crore consolidated base.
- Against Q1 FY27: profit was 42.7% below the Rs 4,026.83 crore of Q1 and revenue 7.5% below Rs 12,886.27 crore (my calculation).
- Dividend: Rs 7 a share, double last year’s Rs 3.50; record date 20 November 2026, payment by 12 December (Investywise).
- Standalone base: the Rs 1,044.02 crore Q2 FY26 standalone profit on this page has no Q2 FY27 standalone figure to set against it yet.
- Still open: realisation, refinery profit, write-offs and the royalty note need the filing.
In plain words: Oil India finds and sells crude oil and natural gas in India, and owns most of Numaligarh Refinery. Its profit moves with the crude price it realises, how much it produces and what the refinery earns.
Data note: Figures are as of 12 November 2026, 4:30 PM IST. Q2 FY27 figures come from the Upstox live blog and Investywise; earlier figures from Business Standard, Millennium Post, Free Press Journal, PSUWatch, Sahi, FilingReader and Cofacto Research via CompoundingAI. I could not open the company filings, so figures are headline-level and some are from summaries. Derived numbers are my calculation.
In this post
- What did Oil India report?
- When was the results date and time?
- What was the base to beat?
- What did Q1 FY27 show?
- Dividend and record date
- What drives the quarter?
- How did the result compare with the scenarios?
- Decoder: what the result answered
- How to read the filing
- What most people miss
- FAQs
- Sources
What did the company report on the Oil India Q2 results date?
On the Oil India Q2 results date, 12 November 2026, the company reported consolidated profit of Rs 2,309 crore (+61.6%) and revenue of Rs 11,915 crore (+29.86%), and declared an interim dividend of Rs 7 a share, per the Upstox live blog and Investywise.
| Line | Q2 FY27 reported | Q2 FY26 base | Q1 FY27 | Outcome |
|---|---|---|---|---|
| Consolidated revenue (Rs crore) | 11,915 | About 9,175 | 12,886.27 | +29.86% on the base; -7.5% on Q1 |
| Consolidated net profit (Rs crore) | 2,309 | 1,428.83 | 4,026.83 | +61.6% on the base; -42.7% on Q1 |
| Net margin on revenue | 19.4% | 15.6% | 31.3% | Above the base, below Q1 |
| Standalone net profit (Rs crore) | Not found | 1,044.02 | 2,870.21 | No comparison yet |
| Interim dividend a share | Rs 7 | Rs 3.50 | None | Doubled on the base |
| Record date | 20 November 2026 | 21 November 2025 | None | Friday |
Cite this table: Oil India Q2 FY27 against the preview marks, as of 12 November 2026, 4:30 PM IST, PositionalCalls; Q2 FY27 per Upstox live blog and Investywise.
The full line-by-line analysis, with the margin arithmetic, the first half and the dividend cash cost, is in Oil India Q2 results FY27. Here I keep the date, the base, the refinery marks and the dividend record that the preview raised. The preview asked whether the record Q1 FY27 profit would hold. Consolidated profit did not hold at that level: it was 42.7% below Q1, though 61.6% above the year-ago base (my calculation). The figures are as reported by news sources and I have not opened the exchange filing.
When was the Oil India Q2 results date and time?
The board met on Thursday, 12 November 2026 to approve standalone and consolidated results for the quarter and half-year ended 30 September 2026, as PSU Connect had reported on 27 October. The first reports appeared at about 3:50 PM IST, after the 3:30 PM close.
Investywise’s page metadata shows about 3:50 PM IST (10:20 UTC) and the Upstox live blog entry is stamped 3:57 PM. I did not find the exact filing time and could not open the exchange intimation, so the first trading session after the result would be Friday, 13 November (my reading). Companies must report within 45 days of the quarter-end, which made Saturday, 14 November the limit; the company reported on day 43 (my calculation). Last year the Q2 results came on 17 November 2025, so this year’s date was earlier.
| Item | What was reported | Source and date | Status |
|---|---|---|---|
| Board meeting | 12 November 2026 | PSU Connect, 27 Oct 2026 | Held |
| Agenda | Standalone and consolidated results; interim dividend | PSU Connect | Done |
| Results | Consolidated profit Rs 2,309 crore; revenue Rs 11,915 crore | Upstox live blog, 3:57 PM IST | Reported |
| Dividend | Rs 7 a share; record 20 November; payment by 12 December | Investywise, about 3:50 PM IST | Declared |
| Results time | First reports about 3:50 PM IST | Investywise metadata | Filing time not found |
| Analyst consensus | None found | Searches | Not available |
Cite this table: Oil India Q2 results date status, as of 12 November 2026, 4:30 PM IST, PositionalCalls.
See the Q2 results hub for the other reporters, and ONGC and IOC for the other oil names.
What was the profit and revenue base Oil India had to beat in Q2 FY27?
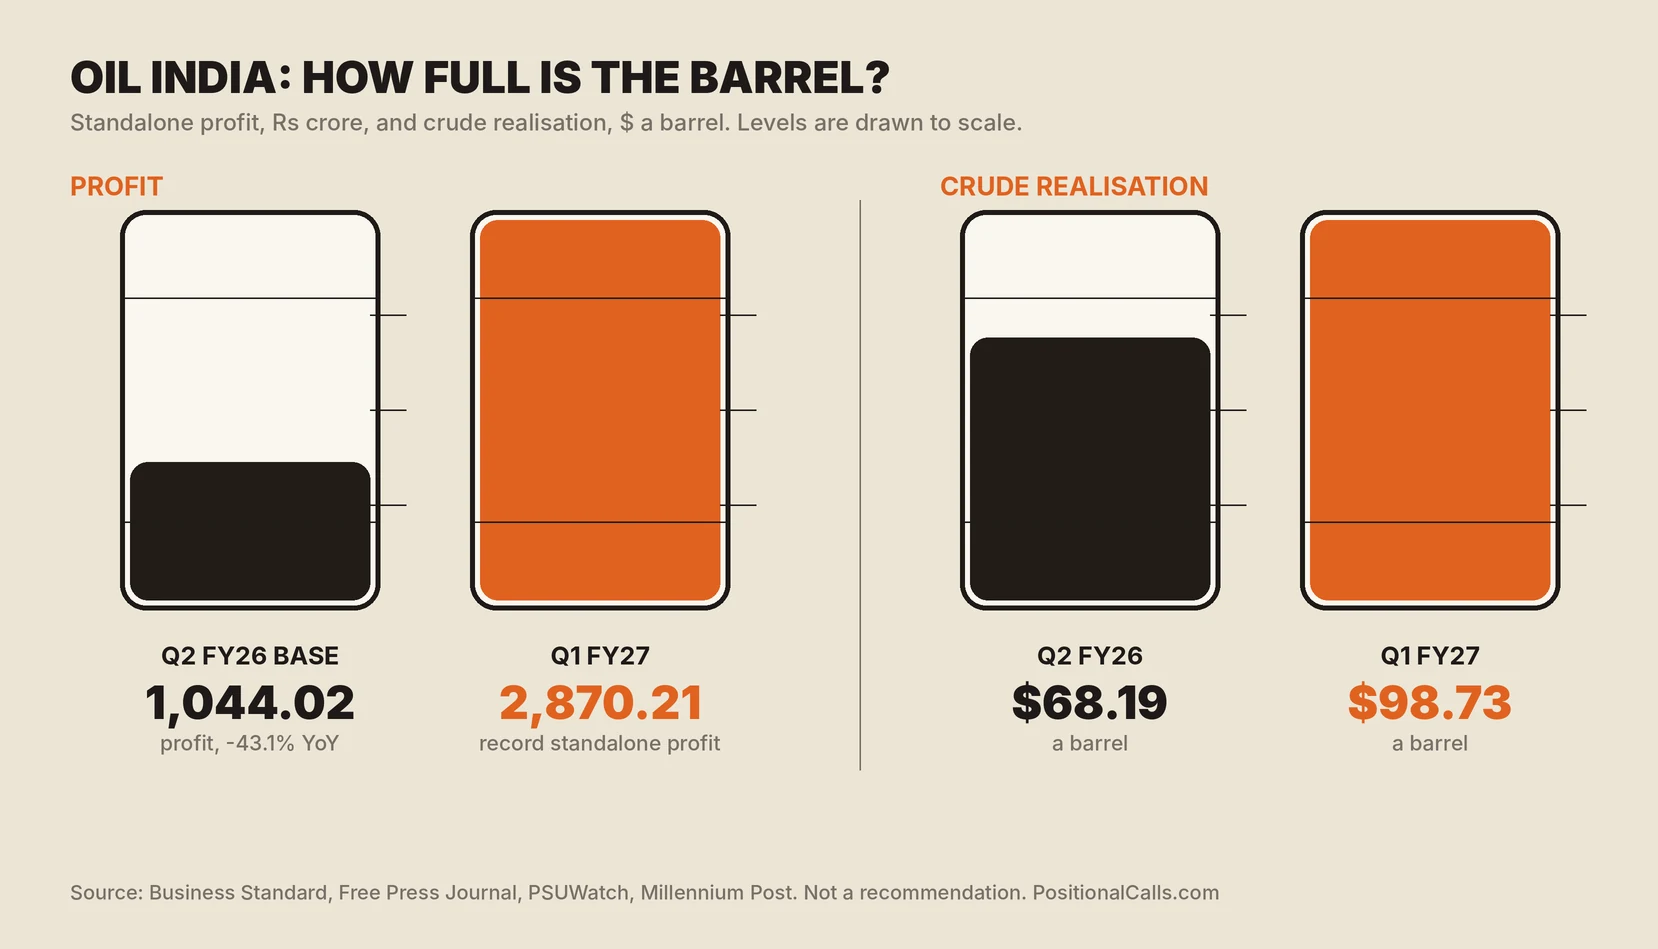
The Q2 FY26 base was standalone revenue of Rs 5,456.64 crore and profit of Rs 1,044.02 crore, down 43.1%. Crude realisation was $68.19 a barrel against $79.33 a year earlier, and operating margin fell to 13.69% from 30.43%.
| Q2 FY26 (quarter to 30 Sep 2025), standalone | Figure | Change | Source |
|---|---|---|---|
| Revenue from operations | Rs 5,456.64 crore | +4.01% | Business Standard |
| Profit after tax | Rs 1,044.02 crore | -43.1% (from Rs 1,834.07 crore) | Business Standard |
| Profit before tax | Rs 1,317.59 crore | -42.85% (from Rs 2,305.36 crore) | Business Standard |
| Operating margin | 13.69% | From 30.43% | Business Standard |
| Crude realisation | $68.19 a barrel | -14.0% from $79.33 (my calculation) | Millennium Post |
| Production, oil and gas | 1.652 million tonnes of oil equivalent | From 1.674 | Millennium Post |
| Interim dividend | Rs 3.50 a share | Record date 21 Nov 2025 | Business Standard |
Cite this table: Oil India Q2 FY26 base, standalone, as reported; change in realisation by PositionalCalls.
Two sources disagree on the fall in realisation: Millennium Post gives 14%, FilingReader’s summary says 18.11%. $68.19 against $79.33 is 14.0% (my calculation), so I use 14%. Consolidated Q2 FY26 revenue was Rs 9,175 crore, against Rs 8,136 crore a year earlier (Millennium Post). FilingReader’s AI-written summary shows consolidated profit of Rs 1,640 crore; I could not check that against the filing, so treat it as unconfirmed.
What held down the Q2 FY26 profit
Q2 FY27 consolidated profit of Rs 2,309 crore was 61.6% above the consolidated base of Rs 1,428.83 crore, and consolidated revenue of Rs 11,915 crore was 29.86% above about Rs 9,175 crore (Upstox live blog). I found no standalone Q2 FY27 figure, so the standalone base above has no result to set against it here. Cofacto Research, via CompoundingAI, lists exploration write-offs of about Rs 1,423 crore in Q2 FY26, made up of about Rs 700 crore for Bangladesh and Gabon and Rs 723 crore for the Vijayapuram-2 well. Adding that to the Rs 1,317.59 crore profit before tax gives about Rs 2,740.6 crore (my calculation, before any tax effect), which shows how much the write-offs weighed. The write-off figure is a third-party summary and I did not check it against the filing.
What did Oil India report in Q1 FY27, the nearest mark?
In Q1 FY27 Oil India reported standalone profit of Rs 2,870.21 crore, its highest ever, on revenue of Rs 7,958.14 crore. Consolidated profit was Rs 4,026.83 crore, up 96.76%, on revenue of Rs 12,886.27 crore. Realisation was $98.73 a barrel.
| Q1 FY27 (quarter to 30 June 2026) | Figure | Comparison | Source |
|---|---|---|---|
| Standalone revenue | Rs 7,958.14 crore | Q2 FY26 base: Rs 5,456.64 crore | Free Press Journal |
| Standalone profit | Rs 2,870.21 crore | Q1 FY26: Rs 813 crore (PSUWatch) | Free Press Journal; PSUWatch |
| Consolidated revenue | Rs 12,886.27 crore | +47.28% from Rs 8,749.94 crore | Free Press Journal |
| Consolidated profit | Rs 4,026.83 crore | +96.76% from Rs 2,046.51 crore | Free Press Journal |
| Consolidated profit before tax | Rs 5,322.17 crore | +112.46% | Free Press Journal |
| Consolidated EPS | Rs 22.32 | From Rs 11.66 | Free Press Journal |
| Crude production | 0.950 million tonnes | From 0.853 (+11.4%, my calculation) | PSUWatch |
| Crude realisation | $98.73 a barrel | Q2 FY26: $68.19 | PSUWatch |
Cite this table: Oil India Q1 FY27 as reported; growth calculations by PositionalCalls where marked.
Q1 FY27 standalone profit is 2.75 times the Q2 FY26 base (my calculation, Rs 2,870.21 crore against Rs 1,044.02 crore). PSUWatch calls the rise from Rs 813 crore a “2.5-fold” increase, but Rs 2,870 crore is 3.53 times Rs 813 crore (my calculation), so the wording and the figures differ; I use the figures. A Sahi summary compares Q1 with the previous quarter, Rs 2,870 crore against Rs 1,790 crore (converted from Rs 28.7 billion and Rs 17.9 billion).
Numaligarh Refinery in Q1 FY27
| Numaligarh Refinery | Q1 FY27 | Q2 FY26 | Source |
|---|---|---|---|
| Profit after tax | Rs 1,305 crore (+167%) | Not found | PSUWatch |
| Gross refining margin | $35.95 a barrel | $10.56 a barrel | PSUWatch; FilingReader |
| Distillate yield | 87.58% | Not found | PSUWatch |
| Revenue | Not found | Rs 6,442 crore | FilingReader |
| Crude throughput | Not found | 753 thousand tonnes | Millennium Post |
Cite this table: Numaligarh Refinery, a material subsidiary of Oil India; summaries I could not check against filings.
Numaligarh contributed about 32% of Oil India’s Q1 FY27 consolidated profit (Rs 1,305 crore of Rs 4,026.83 crore, my calculation), a share that depends on a refinery margin that Cofacto calls far above the typical level of $7 to $8 a barrel.
Against these Q1 marks, Q2 FY27 consolidated revenue of Rs 11,915 crore was 7.5% lower than Rs 12,886.27 crore and consolidated profit of Rs 2,309 crore was 42.7% lower than Rs 4,026.83 crore (my calculation). The Q2 numbers for Numaligarh Refinery were not found, so the refinery share of profit cannot be updated.
PositionalCalls WhatsApp channel
The results, then the margin check
- The profit, realisation and dividend lines as soon as they appear
- Record date and ex-date explained
- Links to the updated page
Did Oil India declare an interim dividend, and what is the record date?
The board declared an interim dividend of Rs 7 a share, with record date Friday, 20 November 2026 and payment on or before 12 December 2026, per Investywise. Last year it was Rs 3.50 with a record date of 21 November 2025 and payment by 14 December 2025.
| Dividend | Amount per share | Record date | Payment | Source |
|---|---|---|---|---|
| Interim, FY26 (Nov 2025) | Rs 3.50 (35%) | 21 Nov 2025 | By 14 Dec 2025 | Business Standard |
| Interim, FY27 (declared 12 Nov 2026) | Rs 7 (70% as stated) | 20 Nov 2026 | By 12 Dec 2026 | Investywise |
Cite this table: Oil India dividend history as reported; the Rs 7 figure is per Investywise and I did not open the filing.
The share price was Rs 172.30 on the BSE after last year’s Q2 results (Business Standard, 17 November 2025). I did not find a post-result close, so check the exchange for a current quote. On about 162.6 crore shares, a Rs 7 dividend is about Rs 1,138 crore, double the roughly Rs 569 crore of last year (my calculation). Dividends are taxed in the investor’s hands; see dividend tax in India.
What drives Oil India’s Q2 numbers: crude, gas, refinery and one-offs?
Four lines drive Oil India: the crude price it realises, production and gas volumes, the Numaligarh refinery margin and one-off items such as exploration write-offs or the GST-on-royalty disclosure. The Q2 FY27 reports I found give none of these lines, so the table below stays the checklist for the filing.
| Driver | Q2 FY26 | Q1 FY27 | What to read in the filing |
|---|---|---|---|
| Crude realisation | $68.19 a barrel | $98.73 a barrel | Where Q2 landed against both |
| Crude production | 0.848 million tonnes | 0.950 million tonnes | Whether Q1 output held |
| Gas price | $6.78 per million BTU | Capped nomination gas at $7.00 (Cofacto) | Volume and price after the APM reset |
| Numaligarh margin | $10.56 a barrel | $35.95 a barrel | Level versus the typical $7 to $8 |
| One-offs | About Rs 1,423 crore write-offs (Cofacto) | None reported | Write-offs and the royalty disclosure |
Cite this table: Oil India driver checklist, PositionalCalls; figures from the sources above.
Cofacto Research says average imported crude was about $96 a barrel in Q2 FY27 against about $101 in Q1, and roughly 37% above a year earlier, and that about 30 wells were shut in on average because of evacuation limits. Oil India’s own Q1 realisation was $98.73. These are third-party figures that I could not check against Oil India’s filing.
How did the Oil India result compare with the scenario tables?
The tables below are standalone illustrations, and the reported Rs 2,309 crore is consolidated, so it cannot be placed in them. Taken on its own base, consolidated profit was 61.6% above Rs 1,428.83 crore and 42.7% below Q1 FY27. The tables were arithmetic illustrations, not forecasts.
| Standalone profit level, Rs crore | Change vs Q2 FY26 base (1,044.02) | Change vs Q1 FY27 (2,870.21) |
|---|---|---|
| 1,500 | +43.7% | -47.7% |
| 2,000 | +91.6% | -30.3% |
| 2,500 | +139.5% | -12.9% |
| 2,870.21 | +174.9% | 0.0% |
Cite this table: Oil India Q2 FY27 profit arithmetic, my calculation. Levels are illustrations, not forecasts.
| Crude realisation, $ a barrel | Change vs Q2 FY26 ($68.19) |
|---|---|
| 80 | +17.3% |
| 90 | +32.0% |
| 96 | +40.8% |
| 98.73 (Q1 FY27) | +44.8% |
Cite this table: Realisation arithmetic, my calculation; the Q2 FY27 realisation is not yet known.
What did the result answer? Oil India results-day decoder
On results day the reading order was: standalone profit against Rs 1,044.02 crore and Rs 2,870.21 crore, crude realisation against $68.19 and $98.73, consolidated profit, the refinery margin, then the dividend and the royalty note.
| Order | Line to read | Mark to compare | Why it comes first |
|---|---|---|---|
| 1 | Standalone profit | Rs 1,044.02 crore; Rs 2,870.21 crore | The headline |
| 2 | Crude realisation | $68.19; $98.73 | Main driver |
| 3 | Consolidated profit | Rs 4,026.83 crore (Q1) | Includes Numaligarh |
| 4 | Refinery margin | $35.95 a barrel (Q1) | Swing factor |
| 5 | Write-offs and royalty note | About Rs 1,423 crore (Q2 FY26) | One-offs |
| 6 | Dividend | Rs 3.50 last year | Cash returned |
Cite this table: Oil India results-day reading order, PositionalCalls.
| Decoder question | Answer from the reports (12 Nov 2026) | Status |
|---|---|---|
| Standalone profit against Rs 1,044.02 and Rs 2,870.21 crore? | Not found | Open |
| Crude realisation against $68.19 and $98.73? | Not found | Open |
| Consolidated profit against Rs 4,026.83 crore (Q1)? | Rs 2,309 crore, -42.7% | Below Q1 |
| Consolidated profit against Rs 1,428.83 crore (year ago)? | Rs 2,309 crore, +61.6% | Above |
| Refinery margin against $35.95? | Not found | Open |
| Dividend against Rs 3.50? | Rs 7, record 20 Nov | Doubled |
Cite this table: PositionalCalls, Oil India decoder answers, as of 12 November 2026, 4:30 PM IST; figures as reported, filing not opened.
Compare like with like: the Q2 FY26 profit above is standalone, so use the standalone lines, and use the consolidated lines against the consolidated marks.
How do I read the Oil India filing and avoid fake alerts?
To check the results, open the NSE or BSE announcement for Oil India, not a link in a message, and read the results table first. Treat any tip that asks for an OTP, payment or login as fake.
- Open the exchange announcement page for Oil India Limited.
- Read the unaudited standalone and consolidated results for the quarter ended 30 September 2026.
- Note revenue, profit and any exceptional items.
- Compare with Rs 1,044.02 crore and Rs 2,870.21 crore.
- Read the dividend decision and record date.
- Check the investor presentation for production and realisation.
PositionalCalls is not SEBI-registered, gives no buy or sell calls and never asks for payment. Nothing here is investment advice.
What do most people miss about the Oil India Q2 results date?
Around the Oil India Q2 results date, most readers see profit up 61.6% and miss that it was 42.7% below Q1 FY27, that the figure is consolidated, that the year-ago base was cut by write-offs and that no source gave realisation or standalone numbers.
A last point on sources. Several figures here come from news summaries and an AI-written filing summary, and these can differ from the filing: the fall in realisation is 14% in one report and 18.11% in another, and a year-ago consolidated profit of about Rs 1,640 crore in one summary does not match the Rs 1,428.83 crore that ties to the reported 61.6%. Before using any number from the Oil India Q2 results date in a decision, open the exchange filing, check whether it is standalone or consolidated and note the date of the report. I list each source below so the comparison can be repeated, and the inputs for my own calculations are in the tables.
One more check on the Oil India Q2 results date numbers: the preview marks on this page are mostly standalone while the headline result is consolidated, so every percentage marked as my calculation uses like-for-like figures and can be rebuilt from the table inputs.
Crude oil and gas companies report in tonnes, barrels and cubic metres, so unit mix-ups are common. One million tonnes of crude is a different quantity from one million barrels, and gas is quoted per million British thermal units in price and in billion cubic metres in volume. When you compare a news summary with the filing, check the unit first, then the period and then whether the figure is standalone or consolidated. A wrong unit can make a correct number look like a mistake, and a consolidated figure set against a standalone base can make a normal quarter look extraordinary.
Another habit worth keeping is to write down the three or four numbers you care about before the filing appears, such as profit, realisation and the dividend, so you can read the result against your own checklist and not against the headline. Headlines tend to pick the largest percentage change, which for a company with a low base can look dramatic even when the rupee change is modest. The rupee figure and the base it is measured against tell the fuller story.
Bottom line
The Oil India Q2 results date was 12 November 2026. The company reported consolidated profit of Rs 2,309 crore (+61.6%), revenue of Rs 11,915 crore (+29.86%) and an interim dividend of Rs 7 a share, with profit 42.7% below Q1 FY27 and no standalone figure found. There is no target or call here. See the full Oil India Q2 results FY27 analysis and our energy coverage.
PositionalCalls WhatsApp channel
Never miss a results update
- Results dates and dividend dates
- Numbers explained without tips or targets
- Updated posts as they go live
Oil India Q2 results date: frequently asked questions
When was the Oil India Q2 results date?
The Oil India Q2 results date was Thursday, 12 November 2026, when the board met to approve results for the quarter and half-year ended 30 September 2026, per PSU Connect. The first reports appeared at about 3:50 PM IST, after the market close. I did not find the exact filing time; check the exchange announcement.
What was Oil India profit in Q2 FY27?
Consolidated net profit was Rs 2,309 crore against Rs 1,428.83 crore a year earlier, up 61.6%, on revenue of Rs 11,915 crore, up 29.86%, per the Upstox live blog. It was 42.7% below Q1 FY27. I did not find the standalone profit, so the Oil India Q2 results date standalone base of Rs 1,044.02 crore has no comparison.
How much dividend did Oil India declare on the results date?
The board declared an interim dividend of Rs 7 a share, with record date Friday, 20 November 2026 and payment on or before 12 December 2026, per Investywise. Last year it was Rs 3.50 with a 21 November 2025 record date. Check the exchange notice for the ex-date.
What was the Oil India profit base for Q2 FY27?
The Q2 FY26 standalone base was profit of Rs 1,044.02 crore, down 43.1%, on revenue of Rs 5,456.64 crore, with crude realisation of $68.19 a barrel. The consolidated base was profit of Rs 1,428.83 crore and revenue of about Rs 9,175 crore. Use like-for-like bases when you compare the Oil India Q2 results date numbers.
How did Q2 FY27 compare with Q1 FY27 for Oil India?
Consolidated profit of Rs 2,309 crore was 42.7% below Q1 FY27’s Rs 4,026.83 crore, and revenue of Rs 11,915 crore was 7.5% below Rs 12,886.27 crore, my calculation. Q1 had a record standalone profit of Rs 2,870.21 crore and a realisation of $98.73 a barrel. Q2 realisation was not found.
Why did Oil India profit rise in Q2 FY27?
The reports I read do not give a reason. The year-ago base was weak, with standalone profit down 43.1% after about Rs 1,423 crore of exploration write-offs, per Cofacto Research via CompoundingAI. Realisation, production and refinery profit for Q2 were not found, so I cannot attribute the rise.
Did Oil India beat Q2 estimates?
I found no analyst estimate or consensus for the quarter, so I cannot say whether it beat or missed one. Compare the result with the year-ago base of Rs 1,428.83 crore consolidated profit and with Q1 FY27, as the Oil India Q2 results date tables on this page do.
I did not find a dated post-result price. The latest I found is Rs 172.30 on the BSE after last year’s Q2 results, per Business Standard on 17 November 2025. The result came after the 3:30 PM close, so the first reaction would be the next session, my reading. Check NSE or BSE.
Is the Oil India Q2 profit standalone or consolidated?
The Upstox figure of Rs 2,309 crore is consolidated. The board approved both standalone and consolidated results, but I could not find the standalone Q2 FY27 profit. A year earlier standalone profit was Rs 1,044.02 crore, so the two bases differ widely and should not be mixed.
Is this financial advice about Oil India?
No. This page is not investment advice, a target or a recommendation, and PositionalCalls is not SEBI-registered. It reports company figures and sources with dates, and labels my calculations. Read the exchange filing and consult a registered adviser before any decision.
Sources
- Upstox: Q2 results live blog, Oil India entry, 12 November 2026, 3:57 PM IST.
- Investywise: Oil India board approves results, Rs 7 interim dividend, 12 November 2026, about 3:50 PM IST.
- PositionalCalls: Oil India Q2 results FY27 analysis
- NSE India: corporate announcements: where the results appeared.
- BSE India: corporate announcements: the results filing.
- PSU Connect: Oil India board to meet on 12 November, 27 October 2026.
- Business Standard: Oil India Q2 PAT drops 43%, 17 November 2025.
- Millennium Post: OIL Q2 FY26 standalone PAT, November 2025.
- Free Press Journal: Oil India consolidated Q1 profit, 2026.
- PSUWatch: Oil India record Q1 standalone profit, 2026.
- Sahi: Oil India Q1 standalone profit: secondary summary.
- CompoundingAI: Oil India Q2 FY27 preview: Cofacto Research commentary.
- FilingReader: Oil India Q2 earnings: AI-written summary, unverified.
Disclosure: PositionalCalls.com is not a SEBI-registered research analyst or investment adviser. Investments in securities markets are subject to market risks. Read all related documents carefully before investing. Returns are never guaranteed. PositionalCalls is an independent research and education site founded by Shubham Chaudhary. Nothing here is a recommendation, target or investment advice. How I researched this: for the Oil India Q2 results date I read the Upstox live blog, Investywise, PSU Connect, Business Standard, Millennium Post, Free Press Journal, PSUWatch, Sahi, FilingReader and Cofacto via CompoundingAI, noted where sources differ, and marked every derived number as my calculation. I did not open any company filing or exchange document. Figures are as of 12 November 2026, 4:30 PM IST.

Shubham Chaudhary is the founder of PositionalCalls, an independent Indian stock market research website. He writes company fundamentals, quarterly results analysis, IPO analysis and sector research for NSE and BSE listed companies, with a focus on banking stocks, insurance and long-term value investing. Every article is built from primary sources such as RBI, SEBI, NSE and BSE filings and company annual reports, and states its risks plainly in simple language for retail investors.
Coverage areas Our research standards- Numbers checked against NSE, BSE and SEBI filings
- Risks and limits stated in every article
- No paid promotions or broker tie-ups
- Articles updated when new filings arrive