
Results analysis · Innerwear
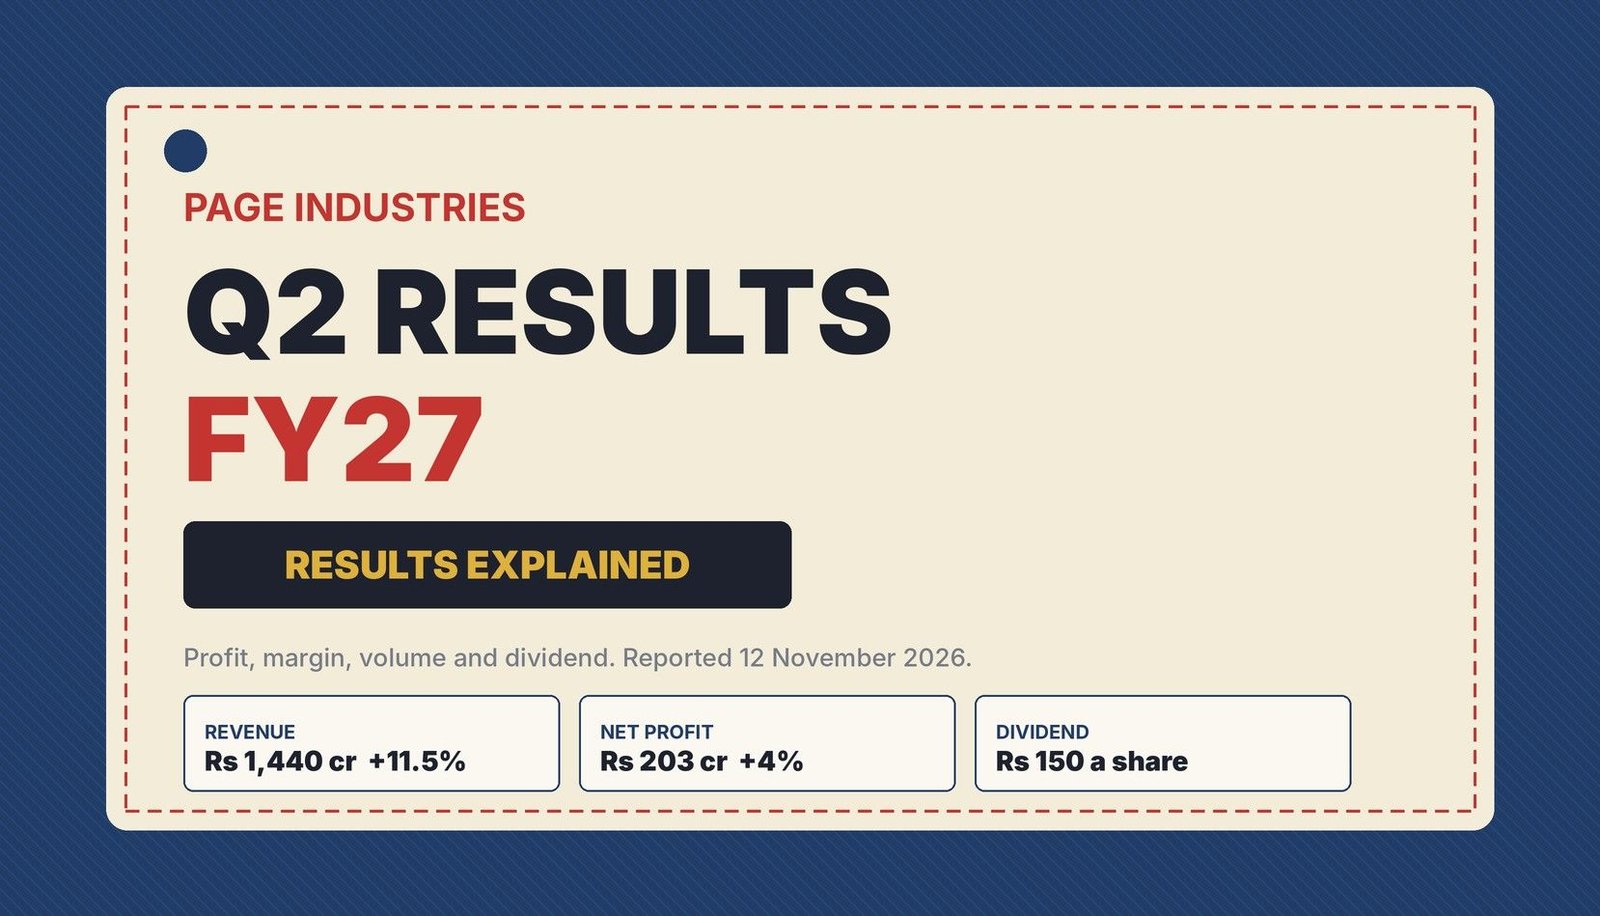
Looking for the Page Industries Q2 results FY27? The Jockey maker reported on 12 November 2026: revenue up 11.5%, profit up 4%, margin down and a Rs 150 dividend. This page sets out the figures, the base, where sources differ and what to check in the filing.
Quick answer
Page Industries Q2 results FY27: revenue rose 11.5% to Rs 1,440 crore and net profit rose 4% to Rs 203 crore, but EBITDA margin slipped to 20.8% from about 21.7%. Volume was 59.7 million pieces, up 5.5%, and a Rs 150 second interim dividend was declared. This page gives no target or call.
Latest update (Thursday, 12 November 2026, 2:30 PM IST): Page Industries reported Q2 FY27 results on Thursday, 12 November 2026, with the first reports at about 2:42 PM IST, and declared a second interim dividend of Rs 150 a share with record date 18 November 2026. I found no official closing price or management call summary at the time of writing, and I have not opened the exchange filing.
Key takeaways
- Profit: net profit was about Rs 202.5 crore, up 4.0% from Rs 194.76 crore; Upstox rounds it to Rs 203 crore.
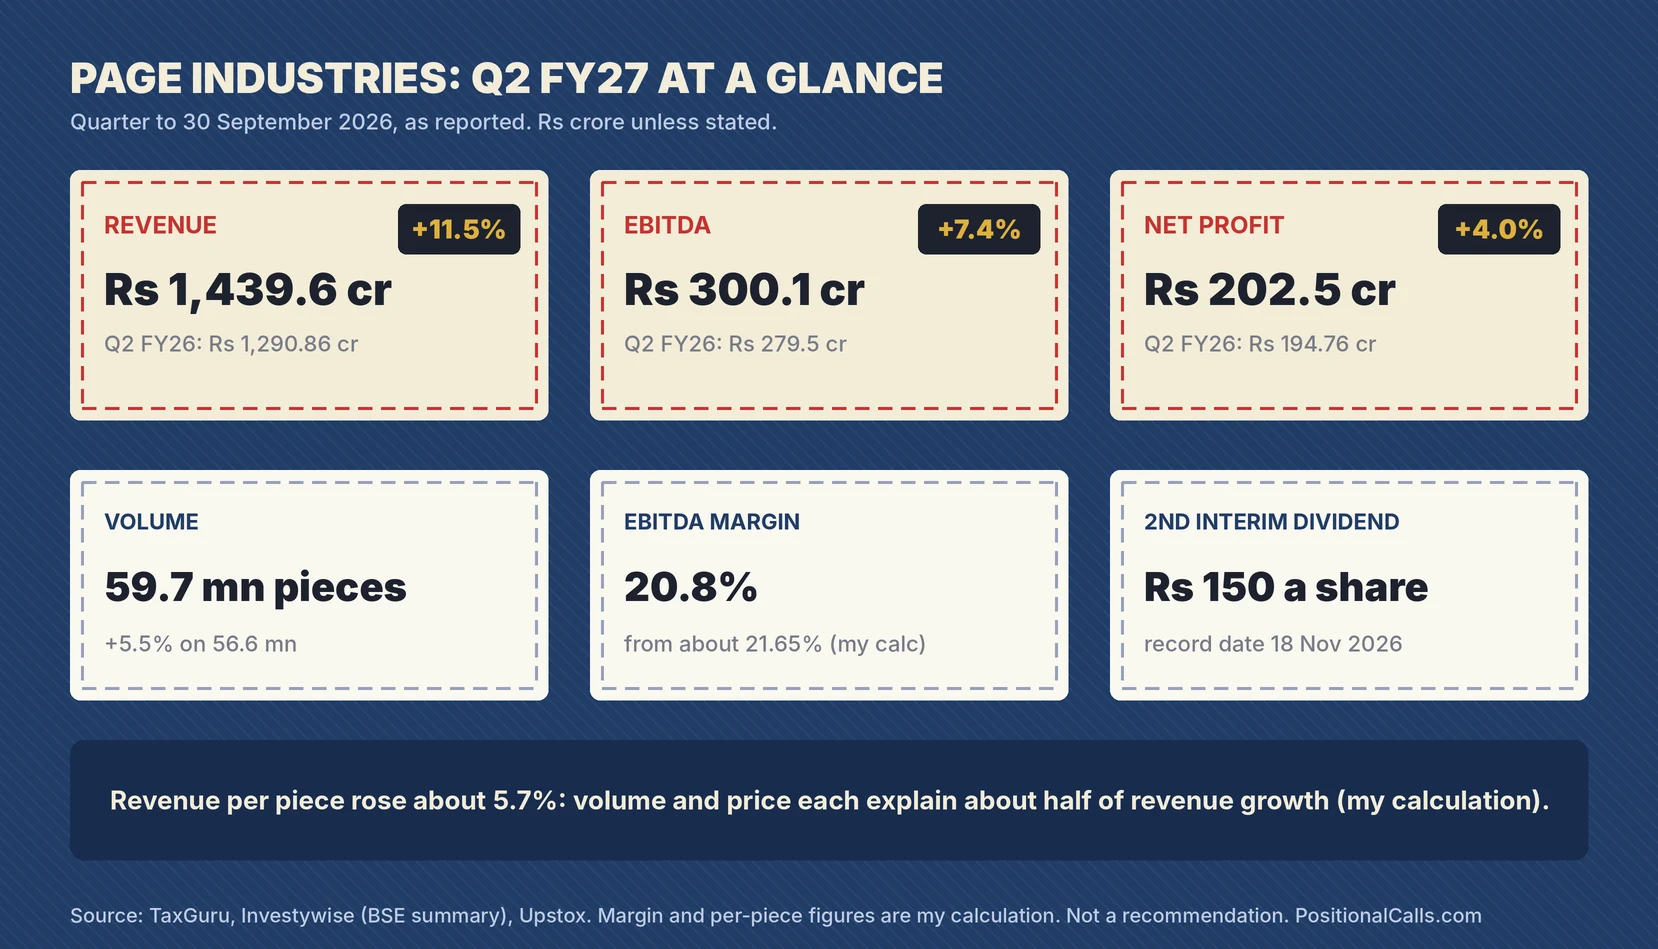
- Revenue and volume: revenue was Rs 1,439.6 crore (+11.5%) on volume of 59.7 million pieces (+5.5%), so revenue per piece rose about 5.7% (my calculation).
- Margin: EBITDA was Rs 300.1 crore (+7.4%) and the margin 20.8%, below about 21.7% a year earlier, so costs grew faster than sales.
- Dividend: second interim dividend of Rs 150 a share, record date 18 November 2026, payable by 11 December 2026; Rs 350 declared in FY27 so far (my calculation).
- First half: H1 profit was Rs 395.35 crore; H1 revenue growth was 9.7% and volume growth 5.6%, below the double-digit volume target quoted in a secondary source.
- Estimates: a Zee Business preview headline expected revenue up 14% and profit up 8%; reported growth was lower on both. I did not open that page.
In plain words: Page Industries makes and sells Jockey innerwear and loungewear in India. Its profit depends on how many pieces it sells, the price it gets per piece and the cost of cotton, yarn and labour.
Data note: Figures are as of 12 November 2026, 2:30 PM IST. They follow Investywise (summarising the BSE filing), TaxGuru, Upstox and Kotak Neo. The pages I read do not state whether the figures are standalone or consolidated; last year’s base I use is standalone. I could not open the exchange filing, so figures are headline-level. EBITDA and volume come from one source. Derived numbers are my calculation. Estimates quoted from a source are that source’s, not mine.
In this post
- What did Page Industries report?
- What was the Q2 FY26 base?
- Volume and price per piece
- Why did the margin slip?
- Did it beat estimates?
- What do Q1 and H1 show?
- Management comments and targets
- The Rs 150 dividend
- What did the price do?
- What does the arithmetic show?
- Next-filing decoder
- How to read the filing
- What most people miss
- FAQs
- Sources
What did Page Industries report in the Page Industries Q2 results FY27?
In the Page Industries Q2 results FY27, revenue was Rs 1,439.6 crore, up 11.5% from Rs 1,290.86 crore. EBITDA was Rs 300.1 crore, up 7.4%, and net profit was about Rs 202.5 crore, up 4.0% from Rs 194.76 crore, per TaxGuru, Investywise and Upstox.
The results covered the quarter to 30 September 2026. The board approved the results on Thursday, 12 November 2026, and the first reports appeared in the Upstox live blog at 2:42 PM IST. I could not open the exchange filing. Net profit of Rs 20,254.41 lakh, profit before tax of Rs 27,095.15 lakh and earnings per share of Rs 181.59 come from Investywise’s summary of the BSE filing; revenue, EBITDA and volume come from TaxGuru and are single-source.
| Page Industries Q2 results FY27 (quarter to 30 Sep 2026) | Q2 FY27 | Q2 FY26 | Change |
|---|---|---|---|
| Revenue | Rs 1,439.6 crore | Rs 1,290.86 crore | +11.5% |
| Volume | 59.7 million pieces | 56.6 million pieces | +5.5% |
| EBITDA | Rs 300.1 crore | Rs 279.5 crore | +7.4% |
| EBITDA margin | 20.8% (20.85% by my arithmetic) | About 21.65% (my calculation) | About -0.8 points |
| Net profit | Rs 202.54 crore (BSE summary) | Rs 194.76 crore | +4.0% |
| Profit before tax | Rs 270.95 crore | Not found | No year-ago line |
| Earnings per share | Rs 181.59 | Not found | No year-ago line |
| Total income | Rs 1,453.19 crore | Not found | Revenue plus about Rs 13.6 crore other income (my calculation) |
Cite this table: Page Industries Q2 FY27 per TaxGuru, Investywise and Upstox; year-ago figures from my earlier preview page; derived lines calculated by PositionalCalls.
These tie. Rs 1,439.6 crore over Rs 1,290.86 crore is 11.5%, Rs 300.1 crore over Rs 1,439.6 crore is 20.85%, and Rs 202.54 crore over Rs 194.76 crore is 4.0% (my calculation). Net profit is 14.1% of revenue, which also ties to TaxGuru’s PAT margin. Total income of Rs 1,453.19 crore less revenue of Rs 1,439.6 crore leaves about Rs 13.6 crore, which I read as other income; that reading is mine.
What was the Q2 FY26 base, and does it tie to the Page Industries Q2 results FY27?
The Q2 FY26 base was revenue of Rs 1,290.86 crore, EBITDA of about Rs 279.5 crore, net profit of Rs 194.76 crore and volume of 56.6 million pieces, reported in November 2025. Q2 FY27 growth rates tie to it within rounding.
| Q2 FY26 (reported November 2025) | Figure | Q2 FY27 figure | Ties? |
|---|---|---|---|
| Revenue | Rs 1,290.86 crore (+4%) | Rs 1,439.6 crore | Yes: +11.5% |
| EBITDA | Rs 279.5 crore (-0.7%); margin about 21.65% | Rs 300.1 crore; 20.8% | Yes: +7.4% |
| Net profit | Rs 194.76 crore (-0.3%) | Rs 202.54 crore | Yes: +4.0% |
| Volume | 56.6 million pieces (+2.5%) | 59.7 million pieces | Yes: +5.5% |
| Second interim dividend | Rs 125 (record date 19 Nov 2025) | Rs 150 | +20.0% (my calculation) |
Cite this table: Page Industries Q2 FY26 base per my earlier preview page; Q2 FY27 comparison by PositionalCalls.
The base was weak: profit was almost flat in Q2 FY26 and revenue grew only about 4%, so growth this year starts from a low point. One report put last year’s revenue growth at 3.6% and another at 4%, a rounding difference. For this quarter, the quoted growth rates match this base, and the profit growth of 4.0% is the same on Upstox’s rounded Rs 203 crore (4.2%) and the BSE figure of Rs 202.54 crore (4.0%) only after rounding, so use the BSE number.
How much of the Page Industries Q2 results FY27 growth came from volume and how much from price?
Revenue rose 11.5% while volume rose 5.5%, so revenue per piece rose about 5.7%, from about Rs 228 to about Rs 241 (my calculation). Roughly half of the revenue growth came from volume and half from price, mix and premiumisation.
| Volume and price arithmetic (my calculation) | Q2 FY27 | Q2 FY26 | Change |
|---|---|---|---|
| Revenue | Rs 1,439.6 crore | Rs 1,290.86 crore | +11.5% |
| Volume | 59.7 million pieces | 56.6 million pieces | +5.5% |
| Revenue per piece | About Rs 241 | About Rs 228 | +5.7% |
| Q1 FY27 volume | 61.2 million pieces | – | Q2 is 2.5% lower than Q1 |
| H1 volume | About 120.9 million pieces | About 114.5 million pieces | +5.6% (ties to the reported 5.6%) |
Cite this table: Page Industries volume and price per piece calculated by PositionalCalls from TaxGuru and preview-page figures.
The split matters because price-led growth depends on the company’s ability to keep raising prices or selling richer products; the secondary source I read mentions a 2.2% price rise in mid-May, though I did not verify it. Volume rose 5.5% after rising 2.5% a year earlier, so the volume trend improved. Q2 volume was 2.5% below Q1, which is normal for this business in my reading of the two quarters, but I did not check earlier years.
Why did the margin slip in the Page Industries Q2 results FY27?
Operating costs, revenue less EBITDA, rose about 12.7% while revenue rose 11.5%, so EBITDA grew only 7.4% and the margin fell about 0.8 points to 20.8%. This is my arithmetic. The reports quote management as saying raw material costs were elevated.
| Margin arithmetic (my calculation) | Q2 FY27 | Q2 FY26 | Change |
|---|---|---|---|
| Revenue | Rs 1,439.6 crore | Rs 1,290.86 crore | +11.5% |
| Operating costs (revenue less EBITDA) | Rs 1,139.5 crore | Rs 1,011.4 crore | +12.7% |
| EBITDA | Rs 300.1 crore | Rs 279.5 crore | +7.4% |
| EBITDA margin | 20.85% | 21.65% | -0.80 points |
| Net profit margin on revenue | 14.1% | 15.1% | -1.0 point |
| Q1 FY27 EBITDA margin | 20.3% | – | Q2 is 0.5 points higher than Q1 |
Cite this table: Page Industries margin lines calculated by PositionalCalls from TaxGuru and preview-page figures; not company disclosures.
Net profit grew less than EBITDA (4.0% against 7.4%), so something below EBITDA also moved: depreciation, interest or tax. Tax was Rs 68.41 crore on a profit before tax of Rs 270.95 crore, a rate of about 25.2% (my calculation), but I do not have the year-ago tax line, so I cannot say which item explains the gap. A reader comparing this quarter with last year should check depreciation and finance costs in the filing.
Did the Page Industries Q2 results FY27 beat estimates?
A Zee Business preview headline said revenue might rise 14% and profit 8%, with margin under pressure. Reported growth of 11.5% and 4.0% was lower on both, by about 2.2% and 3.7% on the implied levels (my calculation). I did not open the page, and it is not a consensus.
| Preview (as reported) | Growth seen | Implied level (my calculation) | Reported | Gap |
|---|---|---|---|---|
| Zee Business headline (page not opened) | Revenue +14% | About Rs 1,471.6 crore | Rs 1,439.6 crore | -2.2% |
| Zee Business headline (page not opened) | Profit +8% | About Rs 210.3 crore | Rs 202.54 crore | -3.7% |
Cite this table: Estimate as quoted in a headline; not verified. Gaps calculated by PositionalCalls.
I found no second estimate and no named brokerage, so I do not treat the headline as the market view. The preview did say margin would stay under pressure, and the reported margin fell about 0.8 points, which agrees with that part. Estimates are third-party opinions, and a single headline cannot tell you whether the market expected more or less.
What do Q1 FY27 and the first half show about the Page Industries Q2 results FY27?
Q2 revenue of Rs 1,439.6 crore was 1.4% above Q1 FY27 and net profit of about Rs 202.5 crore was about 5% above Q1. First-half net profit was Rs 395.35 crore, and first-half revenue grew 9.7% with volume up 5.6%.
| Period view | Figure | Comparison | Note |
|---|---|---|---|
| Q2 FY27 against Q1 FY27: revenue | Rs 1,439.6 crore | Q1 FY27 Rs 1,420.4 crore | +1.4% (my calculation) |
| Q2 FY27 against Q1 FY27: net profit | Rs 202.54 crore | Q1 FY27 about Rs 193 crore | +5.0% (my calculation) |
| Q2 against Q1: EBITDA | Rs 300.1 crore | Q1 FY27 Rs 289 crore | +3.8% (my calculation) |
| H1 FY27 net profit | Rs 395.35 crore | Q1 plus Q2 derived: about Rs 192.8 crore plus Rs 202.54 crore | Ties to Q1 reported near Rs 193 crore |
| H1 FY27 revenue | About Rs 2,860 crore (my calculation) | H1 growth reported 9.7% | Implies H1 FY26 of about Rs 2,607 crore; ties |
| H1 FY27 earnings per share | Rs 354.45 | Q2 Rs 181.59 | Implies Q1 EPS of about Rs 172.86 (my calculation) |
Cite this table: Page Industries H1 and sequential figures per Investywise, TaxGuru and my earlier preview page; ties and ratios by PositionalCalls.
The numbers tie: Q1 profit near Rs 193 crore plus Q2 Rs 202.54 crore is Rs 395.4 crore against Rs 395.35 crore reported. Q1 FY27 profit had fallen about 4% from Rs 201 crore, so Q2’s 4% rise reverses that direction. The first half still shows profit about even on the year (my reading: Q1 down 4%, Q2 up 4%), while volume is up 5.6%.
What did management say, and how does it compare with the Page Industries Q2 results FY27?
Managing director V.S. Ganesh, quoted by TaxGuru, credited revenue growth to healthy volume, premiumisation and new launches, and said profitability stayed within the planned range despite elevated raw material costs. A secondary source quotes a double-digit volume target and a 19 to 21% margin range.
PositionalCalls WhatsApp channel
The results, then the margin check
- The volume, margin and profit lines as soon as they appear
- Dividend dates explained
- Links to the updated page
| Item | Quoted | Source | Reported result |
|---|---|---|---|
| Revenue growth drivers | Volume, premiumisation, new launches | TaxGuru, 12 Nov 2026 | Revenue +11.5%; volume +5.5% |
| Profitability | Within planned range despite raw material costs | TaxGuru, 12 Nov 2026 | EBITDA margin 20.8% |
| Full-year volume growth | Double-digit target | Sahi, secondary, undated | H1 volume +5.6%: below |
| EBITDA margin range | 19 to 21% | Sahi, secondary, undated | Q2 20.8%: inside the range |
| Price increase | 2.2% in mid-May | Sahi, secondary, undated | Revenue per piece +5.7% |
| Festive demand | Expected to rise; capacity expanded | TaxGuru, 12 Nov 2026 | Management expectation, not a result |
Cite this table: Page Industries management commentary as reported; comparisons by PositionalCalls; not verified against a transcript.
The volume target is the main gap: at 5.6% in the first half, volume growth is well below double digits (my comparison), so the second half would have to be much stronger to reach it. I do not know the basis of the target, and the source is undated and secondary, so I treat both lines as unverified. I found no call transcript and did not open the filing.
What is the Rs 150 dividend with the Page Industries Q2 results FY27?
The board declared a second interim dividend of Rs 150 a share for FY27, with record date 18 November 2026 and payment on or before 11 December 2026, per the Investywise summary of the BSE filing. With the Rs 200 first interim, Rs 350 is declared this year so far (my calculation).
| Dividend item | Reported | Comparison | Note |
|---|---|---|---|
| Second interim dividend FY27 | Rs 150 a share | Rs 125 a year earlier: +20.0% | My calculation |
| Record date | 18 November 2026 | 19 November 2025 a year earlier | Per Investywise; filing not opened |
| Payment | On or before 11 December 2026 | – | Per Investywise |
| First interim FY27 | Rs 200 (record date 19 August 2026) | – | From my earlier preview |
| Declared in FY27 so far | Rs 350 a share | – | My calculation |
| Approximate cash outgo | About Rs 167 crore | 82.6% of Q2 net profit | My calculation, about 1.115 crore shares implied by profit over EPS |
Cite this table: Page Industries dividend as reported; outgo and ratios calculated by PositionalCalls.
The Rs 150 payout is about 83% of the quarter’s profit (my calculation), which shows how much of Page’s earnings it pays out. A dividend does not change the results; it moves cash from the company to holders and appears in the price around the record date. If you hold Page Industries, see dividend tax in India for how it is taxed, and capital gains tax on shares for sales. Confirm the dates on the exchange notice.
I did not find a price reaction or an official close for 12 November 2026 in the reports I read. My earlier preview recorded about Rs 34,500 on 30 October 2026 (Kotak Neo). Check the NSE page for the actual move, and do not use that old price as a current one.
| Price item | Figure | Status |
|---|---|---|
| Price on 30 October 2026 | About Rs 34,500 | From my earlier preview; Kotak Neo; not current |
| Price after Q2 FY27 results | Not found | No source with a dated price |
| Brokerage targets after results | Not found | None used here |
Cite this table: Page Industries price information as of the time stated; no current price found.
A share price reflects expectations, and the results can look strong or weak against them. I have no dated post-result price, so I do not describe a reaction. A target from a third party is an opinion, and I do not quote one.
What does the arithmetic on the Page Industries Q2 results FY27 show about each point of margin?
At Q2 FY27 revenue of Rs 1,439.6 crore, each point of EBITDA margin is worth about Rs 14.4 crore. Had the margin stayed at last year’s 21.65%, EBITDA would have been about Rs 311.7 crore, about Rs 11.6 crore above the reported Rs 300.1 crore. This is my arithmetic, not a forecast.
| EBITDA margin applied to Rs 1,439.6 crore | EBITDA, Rs crore | Against reported Rs 300.1 crore |
|---|---|---|
| 19.0% (low end of quoted range) | 273.5 | -26.6 |
| 20.3% (Q1 FY27) | 292.2 | -7.9 |
| 20.85% (Q2 FY27) | 300.1 | 0 |
| 21.65% (Q2 FY26) | 311.7 | +11.6 |
| 22.4% (Q1 FY26, from my preview) | 322.5 | +22.4 |
Cite this table: Page Industries margin sensitivity, my calculation on fixed revenue. Illustrations, not forecasts.
The table holds revenue fixed to isolate margin, which real quarters do not. A 0.8-point margin gap is Rs 11.6 crore of EBITDA, or about 5.7% of Q2 net profit (my calculation), which shows why a small margin move matters for a company with a 14% net margin.
Three worked examples on margin
Example 1, reported margin. Revenue of Rs 1,439.6 crore at 20.85% gives EBITDA of about Rs 300.1 crore.
Example 2, last year’s margin. The same revenue at 21.65% gives about Rs 311.7 crore, 3.9% more than Example 1 (my calculation).
Example 3, Q1 margin. At 20.3% the figure is about Rs 292.2 crore, 2.6% below Example 1 (my calculation).
How do I read the next Page Industries results after the Page Industries Q2 results FY27?
On the next results read, in this order: volume against 59.7 million pieces, revenue per piece, EBITDA margin against 20.8%, net profit against Rs 202.5 crore, then the dividend and management commentary.
| Order | Line to read | Mark to compare | Why it comes first |
|---|---|---|---|
| 1 | Volume | 59.7 million pieces (+5.5%) | The demand signal |
| 2 | Revenue per piece | About Rs 241 | Price and mix |
| 3 | EBITDA margin | 20.8%; 19 to 21% range | Cost pressure |
| 4 | Net profit | Rs 202.54 crore | The headline |
| 5 | Depreciation, interest and tax | Tax about 25.2% | Why profit lagged EBITDA |
| 6 | Dividend | Rs 150; Rs 350 so far | Cash returned |
Cite this table: Page Industries reading order, PositionalCalls.
For any summary or target you read elsewhere, compare its assumptions with these lines: volume, price per piece and margin. If it does not state them, you cannot check it.
How do I read the Page Industries filing and avoid fake tips?
Open the NSE or BSE announcement for Page Industries Limited, not a link in a message, and read the statement of results first. Treat any tip that asks for an OTP, payment or login, or promises a target, as fake.
- Open the exchange announcement page for Page Industries Limited.
- Read the unaudited results for the quarter and half year ended 30 September 2026 and note whether they are standalone or consolidated.
- Note revenue, other income, expenses, profit before tax and profit.
- Compare with Rs 1,439.6 crore, Rs 270.95 crore and Rs 202.54 crore.
- Read the dividend announcement for the amount, record date and payment date.
- Check the investor presentation for volume, EBITDA and management remarks.
PositionalCalls is not SEBI-registered, gives no buy or sell calls and never asks for payment. Nothing here is investment advice.
What do most people miss in the Page Industries Q2 results FY27?
Most readers see 11.5% revenue growth and miss that half of it came from price and mix, that EBITDA and profit grew less, that the margin slipped and that H1 volume growth is below the quoted double-digit target.
Analyst’s note. What stands out: revenue per piece rose about 5.7%, so about half of the 11.5% revenue growth is price and mix (my reading). What is easy to miss: net profit grew 4.0% on a base that was almost flat a year earlier, so the growth starts from a weak point. What would change the view: a filing that shows different EBITDA, depreciation or volume figures. Caution: EBITDA and volume are single-source and I did not open the filing. Reader action: read volume, revenue per piece and margin first.
A last point on sources. Several figures here come from news reports and a BSE-filing summary, and these can differ from the filing: Upstox rounds profit to Rs 203 crore, EBITDA and volume come from one source, and the basis (standalone or consolidated) is not stated in the pages I read. Before using any number in a decision, open the exchange filing, check the definition of each line and note the date of the report. I list each source below so the comparison can be repeated.
Another habit worth keeping is to write down the three or four numbers you care about before a filing appears, such as volume, margin and net profit, so you can read the result against your own checklist and not against the headline. Headlines tend to pick the largest percentage change, and the base it is measured against tells the fuller story.
If a figure on this page changes after the filing is read or the next results, the Updated date at the top will change too, and the Latest update line will say what moved. Tables are kept so the earlier figures stay visible next to the new ones.
Bottom line
The latest quarter shows revenue of Rs 1,439.6 crore (+11.5%), volume of 59.7 million pieces (+5.5%), EBITDA margin of about 20.8% and net profit of about Rs 202.5 crore (+4.0%), with a Rs 150 second interim dividend. There is no target or call on this page. I will update this page when the filing is read or the next results appear. See our earnings coverage.
PositionalCalls WhatsApp channel
Never miss an update
- Results dates and payout dates
- Numbers explained without tips or targets
- Updated posts as they go live
Page Industries Q2 results FY27: frequently asked questions
What did Page Industries report in the Page Industries Q2 results FY27?
Revenue was Rs 1,439.6 crore, up 11.5%, and net profit about Rs 202.5 crore, up 4.0%, reported on 12 November 2026. EBITDA was Rs 300.1 crore at about 20.8%. Figures are from TaxGuru, Investywise and Upstox for the quarter to 30 September 2026; check the filing.
What was Page Industries net profit in Q2 FY27?
Net profit was Rs 20,254.41 lakh, about Rs 202.54 crore, against Rs 194.76 crore a year earlier, up 4.0%, per Investywise’s summary of the BSE filing. Upstox rounds it to Rs 203 crore. First-half profit was Rs 395.35 crore. Check the filing.
How much dividend did Page Industries declare?
Page Industries declared a second interim dividend of Rs 150 a share for FY27, with record date 18 November 2026 and payment on or before 11 December 2026, per Investywise. With the Rs 200 first interim, Rs 350 is declared so far, my calculation. Confirm on the exchange notice.
Did Page Industries volume grow in Q2 FY27?
Yes. Volume was 59.7 million pieces, up 5.5% from 56.6 million, per TaxGuru. Revenue rose 11.5%, so revenue per piece rose about 5.7%, my calculation. First-half volume growth was 5.6%, below a double-digit target quoted by a secondary source. See the Page Industries Q2 results FY27.
What was Page Industries EBITDA margin in Q2 FY27?
EBITDA was Rs 300.1 crore, up 7.4%, at a margin of 20.8%, against about 21.65% a year earlier, my calculation, and about 20.3% in Q1 FY27. Operating costs grew about 12.7% while revenue grew 11.5%. EBITDA comes from one source, so check the filing.
Did Page Industries beat Q2 estimates?
A Zee Business preview headline expected revenue up 14% and profit up 8%. Reported growth of 11.5% and 4.0% was lower, by about 2.2% and 3.7% on the implied levels, my calculation. I did not open the page, and it is not a consensus. Estimates differ by source.
Why did Page Industries profit grow less than EBITDA?
Profit grew 4.0% and EBITDA 7.4%, so something below EBITDA moved: depreciation, interest or tax. Tax was about 25.2% of profit before tax, my calculation, but I have no year-ago tax line. The reports I read do not explain it. Check the filing for the breakdown.
I did not find a dated post-result price or official close for 12 November 2026. An earlier price of about Rs 34,500 from 30 October 2026 is not current. Check the NSE page. Share prices move on expectations as well as results. Brokerage targets are not used here.
No. This page gives no target, price zone or buy or sell call, and PositionalCalls is not SEBI-registered. A target from a third party is an opinion, and I do not quote one for the Page Industries Q2 results FY27. The page reports company figures with sources, labels my own calculations and gives no recommendation.
Is this page financial advice about Page Industries?
No. This page is not investment advice, a target or a recommendation, and PositionalCalls is not SEBI-registered. It reports company figures and sources with dates. Read the exchange filing and consult a registered adviser before any decision, because this page does not say what to buy or sell.
Sources
- NSE India: corporate announcements: results and dividend notices.
- BSE India: corporate announcements: the results filing.
- TaxGuru: Page reports 11.5% revenue growth for Q2 FY27, 12 November 2026.
- Investywise: Page Industries Q2 FY27 results and Rs 150 interim dividend, 12 November 2026.
- Upstox: Q2 results live blog, 12 November 2026, entry at 2:42 PM IST.
- Zee Business: Page Industries Q2 preview (headline only; page not opened).
- Kotak Neo: Page Industries board meeting and dividend decision, 30 October 2026.
- PositionalCalls: Page Industries Q2 results date FY27 preview, 12 November 2026.
Disclosure: PositionalCalls.com is not a SEBI-registered research analyst or investment adviser. Investments in securities markets are subject to market risks. Read all related documents carefully before investing. Returns are never guaranteed. PositionalCalls is an independent research and education site founded by Shubham Chaudhary. Nothing here is a recommendation, target or investment advice. How I researched this: for this page on the Page Industries Q2 results FY27 I read Upstox, Business Upturn, Sahi and Whalesbook, noted where sources differ, and marked every derived number as my calculation. I did not open any company filing or exchange document. Figures are as of 12 November 2026, 2:30 PM IST.

Shubham Chaudhary is the founder of PositionalCalls, an independent Indian stock market research website. He writes company fundamentals, quarterly results analysis, IPO analysis and sector research for NSE and BSE listed companies, with a focus on banking stocks, insurance and long-term value investing. Every article is built from primary sources such as RBI, SEBI, NSE and BSE filings and company annual reports, and states its risks plainly in simple language for retail investors.
Coverage areas Our research standards- Numbers checked against NSE, BSE and SEBI filings
- Risks and limits stated in every article
- No paid promotions or broker tie-ups
- Articles updated when new filings arrive