
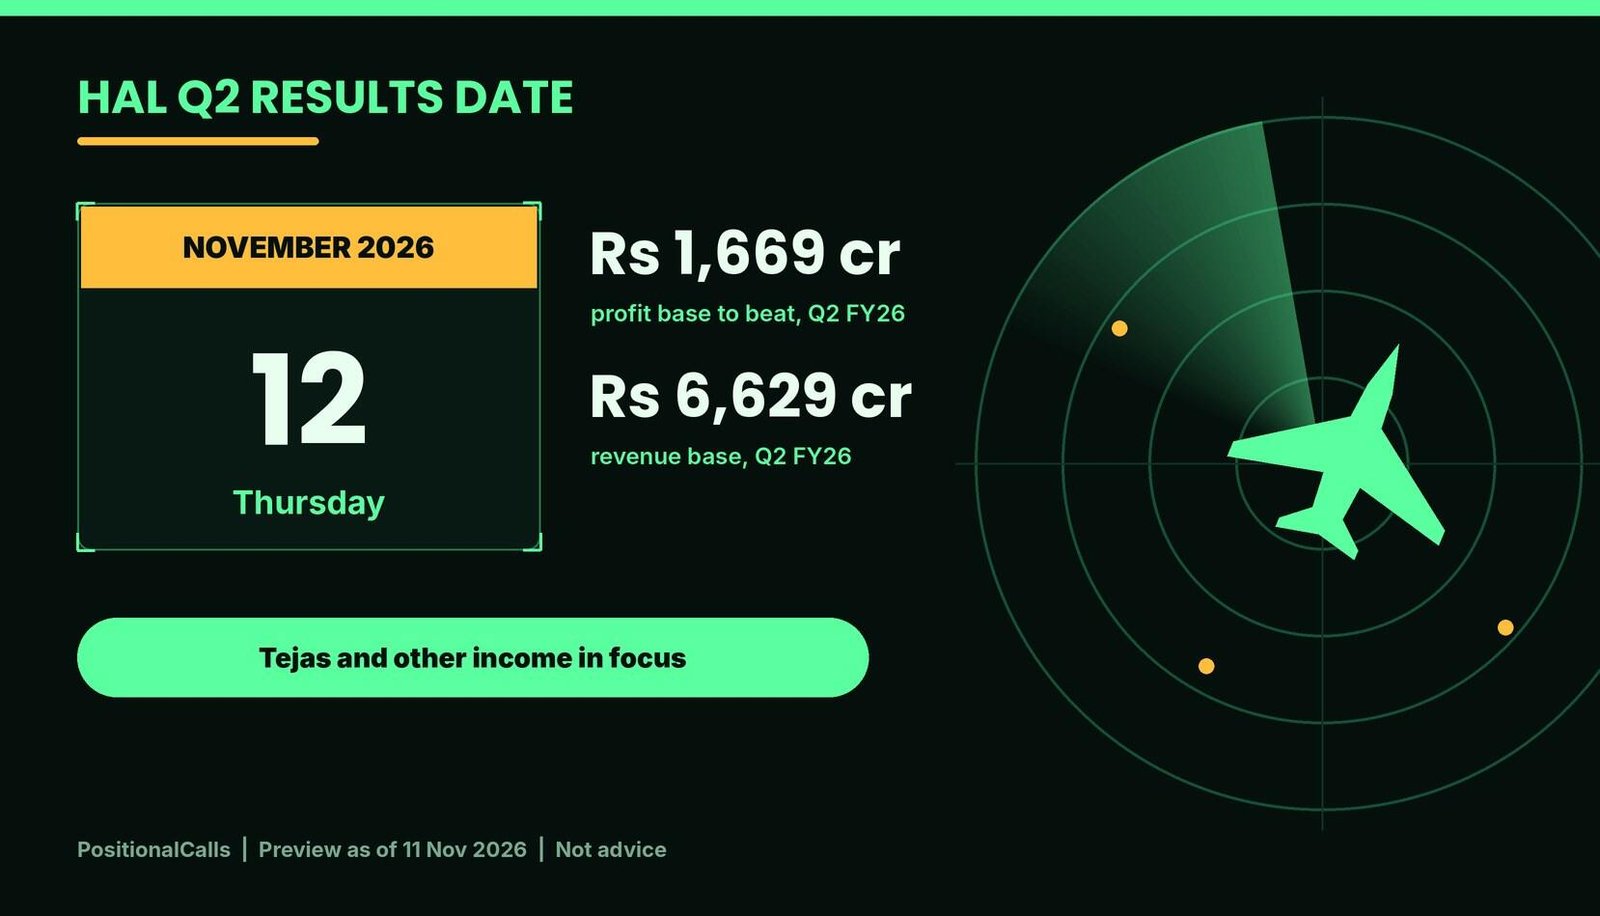
Earnings · Defence · HAL · Q2 FY27 results declared
The HAL Q2 results date was Thursday, 12 November 2026, and the numbers are out: consolidated net profit of Rs 1,936 crore (+16%), revenue of Rs 7,613 crore (+15%) and an EBITDA margin of 22.85%, down from 23.51%. This page keeps the date, the profit base and the data conflicts, and links to the full HAL Q2 results FY27 analysis.
Quick answer
The HAL Q2 results date was Thursday, 12 November 2026, and HAL reported consolidated net profit of Rs 1,936 crore, up 16% from Rs 1,669 crore, on revenue of Rs 7,613 crore, up about 15%. EBITDA margin was 22.85% against 23.51%, per Upstox and Business Upturn, as of 12 November 2026, 3:00 PM IST.
Latest update (Thursday, 12 November 2026, 3:00 PM IST): HAL reported Q2 FY27 consolidated results on Thursday, 12 November 2026, with the first reports at about 1:29 PM IST during market hours. I have not opened the exchange filing, and I did not find a dividend announcement or an official closing price. The earlier preview marks below are kept so the result can be checked against them.
Key takeaways
- Date: The HAL Q2 results date was Thursday, 12 November 2026; the first reports appeared at about 1:29 PM IST, per Business Upturn, Sahi and Upstox.
- Result: Consolidated net profit was Rs 1,936 crore (+16.0%) and revenue Rs 7,613 crore (+14.8%), against the Rs 1,669 crore and Rs 6,629 crore base on this page.
- Margin: EBITDA was Rs 1,739 crore (+11.6%) and the margin 22.85%, below 23.51% a year earlier and the 25.7% in one reported estimate.
- Preview marks: Revenue and profit were above the year-ago base and the Zee headline of about 12% growth; the margin did not hold above 25%.
- Conflicts remain: The order book is about Rs 2.5 lakh crore (Upstox) against Rs 2.54 lakh crore at 31 March 2026 and over Rs 2.45 lakh crore in July, and Q1 FY27 EBITDA still has two bases.
- Price: The NSE price was Rs 4,835.10 at 1:40 PM, down 2.3% (Upstox); I did not find the official close.
In plain words: Hindustan Aeronautics Limited (HAL) is the state-owned maker of fighter jets, helicopters and aero-engines, and it earns most of its revenue by delivering aircraft, so profit swings with delivery timing. It also earns a large amount of other income on its cash. This page gives the date, the profit base, the reported Q2 FY27 numbers and the open conflicts.
Data note: as of 12 November 2026, 3:00 PM IST. Q2 FY27 figures are consolidated and come from Upstox, Business Upturn and Sahi (12 November 2026); the date from Stockport and MyAlgoMate calendars. Q1 FY27 figures come from Kotak Neo, Business World, NiftyTrader and PSU Connect (12 to 14 August 2026); Q2 FY26 figures from Upstox, Bajaj Broking and MyAlgoMate (12 November 2025); Tejas and share-price context from Business Standard (6 October 2026), StockGro, Whalesbook and 5paisa. I did not open the BSE or NSE filings. Sources disagree on some labels; each version is shown with its source. Derived figures are marked “my calculation”. If the filing differs from a source quoted here, the filing governs, and I will correct this page with a visible note.
What did HAL report on the HAL Q2 results date?
On the HAL Q2 results date, 12 November 2026, HAL reported consolidated revenue of Rs 7,613 crore (+14.8%), EBITDA of Rs 1,739 crore (+11.6%), an EBITDA margin of 22.85% and net profit of Rs 1,936 crore (+16.0%), per Upstox, Business Upturn and Sahi.
| Line (consolidated, Rs crore) | Q2 FY27 reported | Q2 FY26 base | Q1 FY27 | Outcome |
|---|---|---|---|---|
| Revenue from operations | 7,613 | 6,628.61 | 5,515.17 | Above the base, +14.8%; +38.0% on Q1 (my calculation) |
| EBITDA | 1,739 | 1,558 (Upstox: 1,559) | 1,527 or 1,526 | Above the base, +11.6% |
| EBITDA margin | 22.85% | 23.5% | 27.7% | Below both marks |
| Net profit | 1,936 | 1,669.05 | 1,589.66 | Above the base, +16.0%; +21.8% on Q1 (my calculation) |
| Implied other income (total income less revenue) | About 989 | About 887 | About 903 (standalone) | Higher, +11.5% on the year (my calculation) |
Cite this table: PositionalCalls, “HAL Q2 FY27 Results Against Preview Marks, as of 12 November 2026”; Q2 FY27 per Upstox, Business Upturn and Sahi.
The full line-by-line analysis, with estimates, the margin arithmetic, the order book and the share price, is in HAL Q2 results FY27. Here I keep the date, the base and the conflicts that the preview raised. Upstox does not define its “net income” line (Rs 8,602 crore against Rs 7,516 crore); I read it as total income, which is how I derive other income, and that reading is mine. The results are as reported by news sources: I have not opened the exchange filing, so please confirm on the BSE or NSE page.
When was the HAL Q2 results date and time?
The HAL Q2 results date was Thursday, 12 November 2026, for the quarter ended 30 September 2026. The first reports appeared at about 1:29 PM IST, while the market was open: Business Upturn 1:29 PM, Sahi 1:38 PM and Upstox 1:51 PM.
Stockport’s results calendar, updated on 10 November 2026, had said Hindustan Aeronautics told NSE on Tuesday, 27 October that the board would meet on 12 November, and MyAlgoMate listed the same date with the agenda “to consider and approve the financial results for the period ended September 30, 2026”. I could not open the exchange intimation, and I did not find the exact filing time, so the times above are the news reports’ timestamps, not the filing’s. I found no conflicting date for the HAL Q2 results date. The SEBI listing rules set a deadline of 14 November 2026, 45 days after quarter end, and Stockport notes HAL reported 43 to 45 days after quarter end in each of the last eight quarters; this time it reported on day 43 (my calculation).
HAL Q2 results date: what was confirmed and what was not
| Event | Date | Weekday | Status |
|---|---|---|---|
| Q2 FY26 results | 12 November 2025 | Wednesday | Filed; this was the year-ago base |
| Q3 FY26 results | 12 February 2026 | Thursday | Filed (Stockport list) |
| Q4 FY26 results | 14 May 2026 | Thursday | Filed (Stockport list) |
| Q1 FY27 results | 12 August 2026 | Wednesday | Filed; the run-rate before Q2 |
| HAL notice to NSE | 27 October 2026 | Tuesday | Per Stockport; I did not open it |
| Q2 FY27 results | 12 November 2026 | Thursday | Reported; first news reports from 1:29 PM IST; filing not opened |
| SEBI deadline for Q2 results | 14 November 2026 | Saturday | Legal limit; met |
Cite this table: PositionalCalls, “HAL Q2 Results Date Table, as of 12 November 2026”.
See the Q2 results calendar for other dates. For how other state-run companies reported, see Coal India Q2 results FY27 and ONGC Q2 results FY27.
HAL profit base: what mark did Q2 FY27 have to clear?
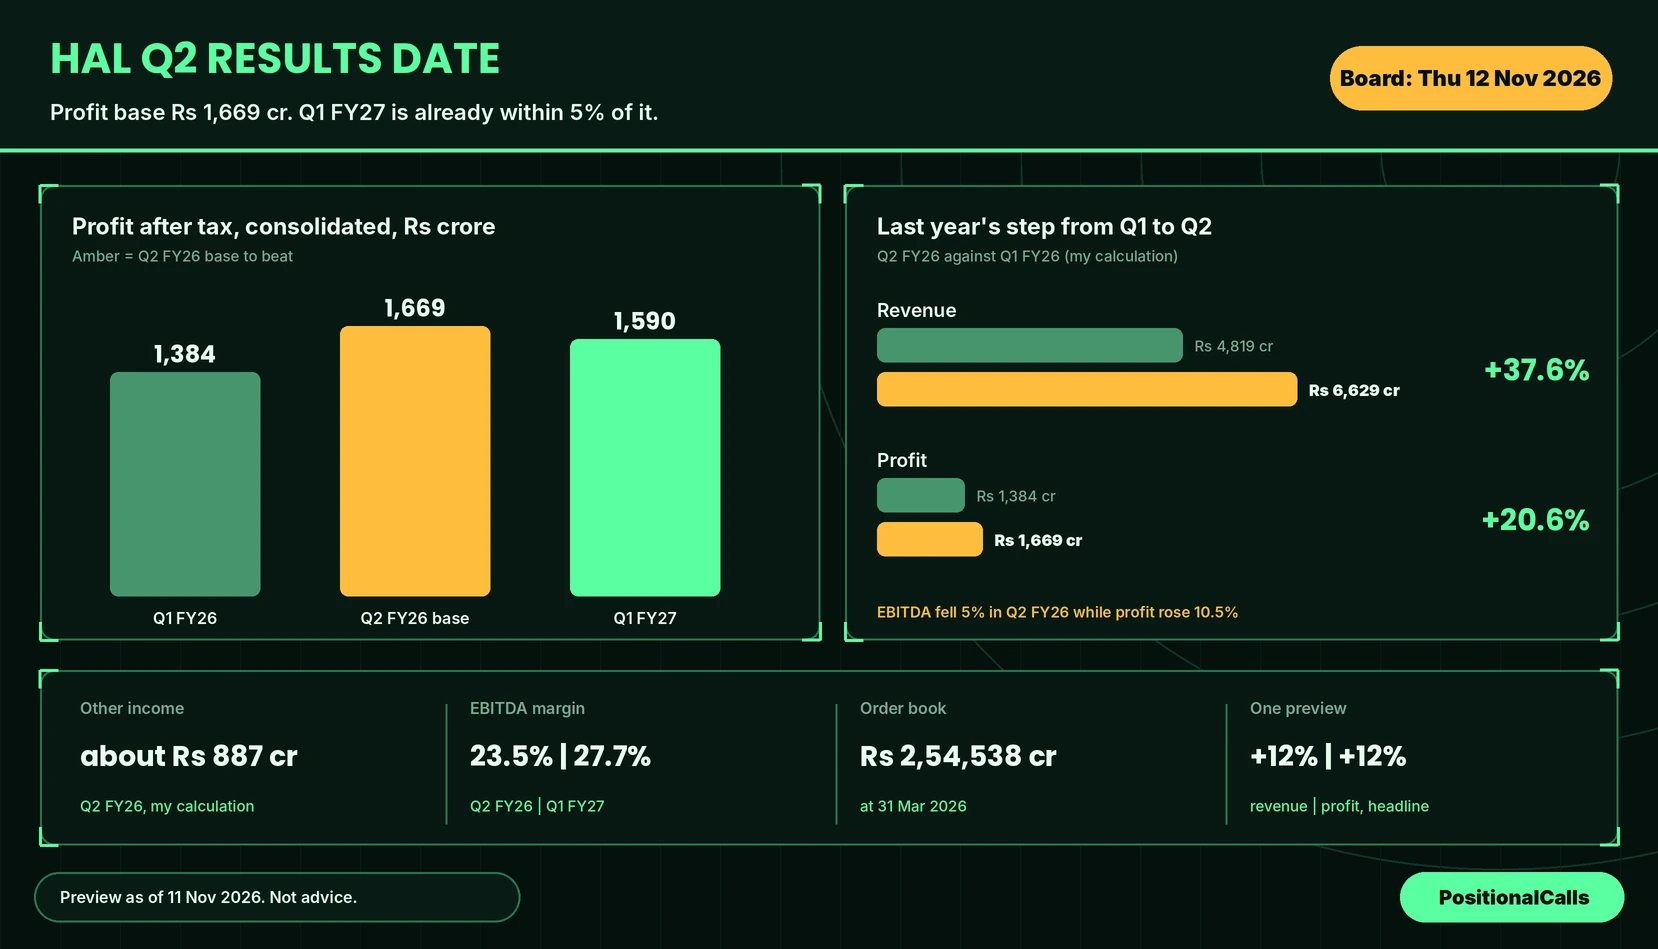
The HAL profit base was the Q2 FY26 consolidated profit of Rs 1,669 crore on revenue from operations of Rs 6,629 crore and EBITDA of Rs 1,558 crore, with Q1 FY27 at Rs 1,590 crore profit on Rs 5,515 crore of revenue. Q2 FY27 profit of Rs 1,936 crore cleared it by 16.0%.
| Consolidated, Rs crore | Q1 FY26 | Q2 FY26 (base) | Q1 FY27 | Source note |
|---|---|---|---|---|
| Revenue from operations | 4,819.01 | 6,628.61 | 5,515.17 | MyAlgoMate; Upstox |
| EBITDA | 1,284 or 1,039 | 1,558 | 1,527 or 1,526 | Q1 bases conflict, see next section |
| EBITDA margin | 26.64% or 21.6% | 23.5% | 27.67% | Reported; ties to my division |
| Profit after tax | 1,383.77 | 1,669.05 | 1,589.66 | MyAlgoMate (NSE filings) |
| EPS, Rs | 20.69 | 24.96 | 23.77 | MyAlgoMate; NiftyTrader |
| Profit growth on year | – | +10.5% or +7.6% | +14.9% | Q2 FY26 base is in conflict |
Cite this table: PositionalCalls, “HAL Profit Base Table, as of 11 November 2026”.
The HAL profit base was not demanding: Q1 FY27 profit of Rs 1,589.66 crore is only 4.8% below it (my calculation), and Q2 is HAL’s seasonally larger quarter. In Q2 FY26 revenue was 37.6% above Q1 and profit 20.6% above Q1 (my calculation). So a profit above Rs 1,669 crore was normal, and the question was how large the growth would be on the year; it was 16.0%, above the 14.9% of Q1. Revenue growth in Q1 FY27 was 14.4% and profit growth 14.9%.
Which HAL figures are right? EBITDA, profit base and order book
Use one source per quarter and check the base: Q1 FY27 EBITDA growth is 19% on a Rs 1,284 crore base in one report and 46.9% on a Rs 1,039 crore base in others, and the Q2 FY26 profit growth is 10.5% or 7.6% depending on the base.
| Measure | Version A | Version B | What differs |
|---|---|---|---|
| Q1 FY27 EBITDA growth | Rs 1,527 crore, +19% on Rs 1,284 crore (Kotak Neo) | Rs 1,526 crore, +46.9% on Rs 1,039 crore (Business World, NiftyTrader) | Different year-ago EBITDA, hence 26.64% or 21.6% base margin |
| Q2 FY26 profit base | Rs 1,669 crore, +10.5% on Rs 1,510 crore (Upstox) | Rs 1,669.05 crore against Rs 1,551.09 crore, +7.6% (Bajaj Broking table) | Year-ago profit; the Bajaj page also says +10.5% |
| Q1 FY27 profit | Rs 1,590 crore consolidated (Kotak Neo) | Rs 1,589 crore headline, Rs 1,581 crore standalone (PSU Connect) | Rounding and standalone versus consolidated |
| Order book | Rs 2,54,538 crore at 31 March 2026 (NiftyTrader) | About Rs 2.45 lakh crore (StockGro) | Digits look transposed; no as-of date in StockGro (my reading) |
| Q2 FY26 EBITDA | Rs 1,558 crore, margin 23.5% (Upstox) | Not reported (Bajaj Broking) | One source only |
Cite this table: PositionalCalls, “HAL Definitions Table, as of 11 November 2026”.
My calculation: both Q1 EBITDA sets tie to themselves. Rs 1,527 crore over Rs 5,515.17 crore is 27.69%, and Rs 1,284 crore over Rs 4,819.01 crore is 26.64%; Rs 1,039 crore over the same revenue is 21.56%. Because the two bases differ by Rs 245 crore (1,284 less 1,039), only one can be the company’s year-ago figure, and I could not tell which from the sources. For Q2 FY26 the Upstox set also ties: Rs 1,558 crore over Rs 6,628.61 crore is 23.50%, and Rs 1,640 crore over Rs 5,976.29 crore is 27.44%. A drop in EBITDA of 5% (Upstox) happened while profit rose, which points to other income, discussed below. My calculation: on the Rs 1,284 crore base, Q1 FY27 EBITDA rose Rs 243 crore; on the Rs 1,039 crore base it rose Rs 487 crore, a difference of Rs 244 crore that comes only from the year-ago figure. Match every new figure with the base from the same source. The exchange filing settles these questions; I have not opened it.
Another trap, my calculation: Upstox’s “net income” of Rs 7,516 crore for Q2 FY26 is total income, not profit. Less revenue of Rs 6,628.61 crore it leaves about Rs 887 crore, which looks like other income (my reading), and that is 39.9% of the Rs 2,226.98 crore profit before tax that Bajaj Broking reports. Quote the right line, and say whether it is total income, revenue or profit before tax.
PositionalCalls WhatsApp channel
Get the next HAL result note
- Alerts when HAL files results or announces payouts
- The profit basis, margin and other income we check first
- A link when this page is updated after the filing is read
How did the HAL results compare with estimates?
Business Upturn reports revenue 1.7% above, net profit 1.9% above and EBITDA 9.6% below a market estimate. A Zee Business preview headline had expected about 12% growth in both revenue and profit. I did not verify either estimate, and both are third-party opinions.
| Line | Reported estimate | Reported result | Gap (my calculation) | Source of estimate |
|---|---|---|---|---|
| Revenue | Rs 7,483 crore | Rs 7,613 crore | +1.7% | Business Upturn |
| EBITDA | Rs 1,924 crore | Rs 1,739 crore | -9.6%, Rs 185 crore short | Business Upturn |
| EBITDA margin | 25.7% | 22.8% | About -2.9 points | Business Upturn |
| Net profit | Rs 1,899 crore | Rs 1,936 crore | +1.9%, Rs 37 crore above | Business Upturn |
| Revenue (headline, page not opened) | About Rs 7,424 crore (+12%, my calculation) | Rs 7,613 crore | +2.5% | Zee Business |
| Net profit (headline, page not opened) | About Rs 1,869 crore (+12%, my calculation) | Rs 1,936 crore | +3.6% | Zee Business |
Cite this table: PositionalCalls, “HAL Q2 FY27 Estimates Against Results, as of 12 November 2026”; estimates are as reported and not verified.
The two estimate sets differ on profit by Rs 30 crore, which shows how much estimates vary by source; neither is a consensus I can verify. The sources I read do not say why profit beat while EBITDA missed; other income of about Rs 989 crore (derived) is one possible reason, and that inference is mine. The preview’s worked step, applying last year’s Q1 to Q2 seasonal step, gave revenue of about Rs 7,586 crore and profit of about Rs 1,918 crore; the reported figures were about 0.4% and 0.9% higher (my calculation).
One more reported view concerns Tejas: Jefferies, via Business Standard on 6 October 2026, said Tejas Mk1A is 43% of the order book. That is a third-party observation, not mine.
What drives HAL’s results: deliveries, Tejas, order book and other income
HAL’s results depend on deliveries recognised as revenue, with Tejas Mk1A the swing factor, an order book of about Rs 2.54 lakh crore and other income of about Rs 900 crore a quarter that supports profit.
| Driver | Reported fact | Source and date |
|---|---|---|
| Order book | Rs 2,54,538 crore at 31 March 2026; opening Rs 1.89 lakh crore | NiftyTrader, 12 August 2026 |
| FY26 order inflows | Rs 97,028 crore, led by the 97-jet Tejas Mk1A order | StockGro |
| Tejas Mk1A share of order book | 43% | Jefferies via Business Standard, 6 October 2026 |
| GE engines | 10 received; confidence of 10 Tejas Mk1A deliveries this year against Jefferies’ own assumption of 5 | Business Standard, 6 October 2026 |
| Guidance | Double-digit FY27 growth, stable margins (source of guidance unnamed) | StockGro |
Cite this table: PositionalCalls, “HAL Operating Drivers Table, as of 11 November 2026”.
My reading: Tejas Mk1A deliveries are the swing item for revenue recognition in the second half, while Q2 revenue rests on helicopters, engines and repair work, but I do not have a delivery split. StockGro says no Mk1A was formally delivered as of May and that seven GE F404 engines were in with ten more due before November; its article is undated, so I treat those counts as dated by the article only. The HAL Tejas deliveries Q2 FY27 count was the first thing to read on the HAL Q2 results date, before the profit number; the Q2 reports I read carry no delivery count, so I cannot say how many were delivered by September.
HAL shares fell 2.51% to Rs 4,740.50 after the Q2 FY26 results, rose about 3% to Rs 5,055 intraday after Q1 FY27 and traded at Rs 4,835.10 at 1:40 PM on 12 November 2026, down 2.3% after the Q2 FY27 results (Upstox); that is about 6.1% below the 52-week high of Rs 5,149.90 (my calculation).
| Date | Event | Price reaction (as reported) | Source |
|---|---|---|---|
| 12 Nov 2025 | Q2 FY26 results | Rs 4,740.50, down 2.51%; market cap Rs 3.18 lakh crore | Upstox |
| 12 Aug 2026 | Q1 FY27 results | About +3% to Rs 5,055 intraday against a previous close of Rs 4,909 (NiftyTrader says nearly Rs 5,049) | Kotak Neo; NiftyTrader |
| 17 Aug 2026 | 52-week high | Rs 5,149.90 | Business Standard; 5paisa |
| 11 Nov 2026 | Morning of the day before results | Rs 5,018.20 at 9:58 AM, up 0.38% (page not confirmed as live) | 5paisa |
| 12 Nov 2026 | Q2 FY27 results | Rs 4,835.10 at 1:40 PM, down 2.3%; implied previous close about Rs 4,949 (my calculation); official close not found | Upstox |
Cite this table: PositionalCalls, “HAL Share Price Reactions, as of 11 November 2026”.
The reaction on results day has gone both ways in the last three quarters, so the price move is not a guide to the numbers. These are past prices for context and not a view. On dividends, PSU Connect reports a total of Rs 45 a share for the previous year, Rs 35 interim already paid and Rs 10 final recommended and subject to shareholder approval; I found no interim dividend notice for FY27 with the Q2 results. For how dividends are taxed, see our dividend tax in India guide.
How did the actual profit compare with the sensitivity table?
Reported Q2 FY27 profit of Rs 1,936 crore was 1.0% above the top row of my preview sensitivity table (Rs 1,917 crore) and reported revenue of Rs 7,613 crore was 0.4% above the top revenue row (Rs 7,586 crore); EBITDA of Rs 1,739 crore was 2.5% below the grid cell for that revenue at a 23.5% margin (Rs 1,783 crore), my calculation. The table was a sensitivity range, not a forecast.
Assumptions: each row applies a stated change to the Q2 FY26 profit of Rs 1,669.05 crore; row E applies last year’s Q1 to Q2 profit step to Q1 FY27 profit; row F holds Q1 FY27 profit flat.
| Scenario | Profit (Rs crore) | Change on Rs 1,669 | Change on Q1 FY27 Rs 1,590 |
|---|---|---|---|
| A: profit 5% lower on year | 1,586 | -5.0% | -0.3% |
| B: flat on year | 1,669 | +0.0% | +5.0% |
| C: 10% higher on year | 1,836 | +10.0% | +15.5% |
| D: Zee headline, +12% | 1,869 | +12.0% | +17.6% |
| E: last year’s seasonal step | 1,917 | +14.9% | +20.6% |
| F: Q1 FY27 level held flat | 1,590 | -4.8% | 0.0% |
Cite this table: PositionalCalls, “HAL Q2 FY27 Profit Sensitivity, as of 11 November 2026”.
The second table multiplies three revenue levels by three EBITDA margins: the Q2 FY26 margin of 23.5%, a midpoint of 25.0% and the Q1 FY27 margin of 27.7%. Revenue levels are 10% above Q2 FY26, the 12% in the Zee headline, and the full seasonal step (+14.4%).
| Revenue (Rs crore) | EBITDA at 23.5% | EBITDA at 25.0% | EBITDA at 27.7% |
|---|---|---|---|
| 7,291 (+10%) | 1,713 | 1,823 | 2,020 |
| 7,424 (+12%) | 1,745 | 1,856 | 2,056 |
| 7,586 (+14.4%) | 1,783 | 1,897 | 2,101 |
Cite this table: PositionalCalls, “HAL EBITDA Grid, as of 11 November 2026”.
These were not estimates. One percentage point of EBITDA margin on Rs 7,424 crore of revenue is Rs 74.2 crore (my calculation), so margin matters as much as revenue. The actual margin of 22.85% was below the lowest margin I tested (23.5%), so the grid’s margin axis was too high; judge released figures with the margin, not only the growth rate.
HAL Q2 results date decoder: what the filing answered
For the HAL Q2 results, the order to read was revenue and the profit basis, then EBITDA margin, other income, Tejas deliveries, order book and any dividend; the table after the marks shows what the reports answered.
| What to read | Mark to beat | Question to ask |
|---|---|---|
| Profit after tax (consolidated) | Rs 1,669 crore (year-ago); Rs 1,590 crore (Q1) | Is growth above 12% in the headline or 14.9% of Q1? |
| Revenue from operations | Rs 6,629 crore (year-ago); Rs 5,515 crore (Q1) | Is the Q1 to Q2 step near last year’s 37.6%? |
| EBITDA and margin | Rs 1,558 crore and 23.5%; Rs 1,527 crore and 27.7% | Did margin hold above 25%? |
| Other income | About Rs 887 crore (Q2 FY26, my calculation) | Did interest income fall or rise? |
| Tejas Mk1A deliveries | 10 expected this year (Jefferies, reported) | How many were delivered by September? |
| Order book | Rs 2,54,538 crore at 31 March 2026 | What is the latest figure and its date? |
| Dividend | No interim notice found | Is an interim dividend declared? |
Cite this table: PositionalCalls, “HAL Results-Day Decoder, as of 11 November 2026”.
| Decoder question | Answer from the reports (12 Nov 2026) | Status |
|---|---|---|
| Profit growth above 12% or 14.9%? | Rs 1,936 crore, +16.0% | Yes |
| Q1 to Q2 revenue step near last year’s 37.6%? | +38.0% (Rs 5,515.17 crore to Rs 7,613 crore, my calculation) | Yes |
| Margin above 25%? | 22.85% | No |
| Other income up or down? | About Rs 989 crore against Rs 887 crore (derived) | Up, 11.5% |
| Tejas Mk1A deliveries by September? | Not in the reports I read | Not found |
| Latest order book and date? | About Rs 2.5 lakh crore (Upstox, 12 Nov); sources differ | Conflict |
| Interim dividend? | None found in the reports I read | Not found |
Cite this table: PositionalCalls, “HAL Decoder Answers, as of 12 November 2026”; figures as reported, filing not opened.
How to read the HAL Q2 results and what to avoid
To check the HAL Q2 results, use the exchange filing and the company’s press release, and ignore any message that offers a result or a tip early.
- Open the BSE or NSE announcements page for Hindustan Aeronautics and find the results filing.
- Read the consolidated statement first, then the standalone one.
- Find revenue, other income, EBITDA and profit, and compute the margin yourself.
- Check the company’s comments on deliveries and the order book.
- Compare each line with the decoder.
- Note any dividend and the AGM or record dates.
What most people miss about the HAL Q2 results date
Analyst’s note on the HAL Q2 results date and base
- What stands out: the base is a quarter in which EBITDA fell 5% yet profit rose, so the profit line owes much to other income, and the headline growth rate can hide a weaker operating picture.
- Easy to miss: Q1 FY27 profit is only 4.8% below the Q2 FY26 base, and Q2 is seasonally larger, so clearing the base was likely, and profit did clear it by 16.0%; the margin, at 22.85%, and other income decide the quality.
- What would change the view: a filing with a lower other-income line, a different EBITDA base or a Tejas delivery count far from 10.
- Caution: the sensitivity tables are my own arithmetic, not a forecast or target. This note is reasoning from reported figures.
- Reader action: on the HAL Q2 results date, 12 November, match each headline to the consolidated basis and compare margin with 23.5% and 27.7%.
Bottom line
The HAL Q2 results date was Thursday, 12 November 2026. HAL reported consolidated net profit of Rs 1,936 crore (+16%) on revenue of Rs 7,613 crore (+15%), with an EBITDA margin of 22.85% against 23.51%, on the Rs 1,669 crore profit base set out here. There is no target or call on this page; the order book, the Tejas delivery count and the dividend still need the filing. Next read: the full HAL Q2 results FY27 analysis, then the Q2 results calendar for every date this season.
Part of the Earnings series.
PositionalCalls WhatsApp channel
Follow defence results on WhatsApp
- Results calendar changes across defence companies
- Result and base tables for state-run firms
- A link to each analysis when it is updated
HAL Q2 results date: frequently asked questions
When was the HAL Q2 results date?
The HAL Q2 results date was Thursday, 12 November 2026, for the quarter ended 30 September 2026. Stockport, citing HAL’s notice to NSE on 27 October, and MyAlgoMate had listed it. I could not open the exchange letter, so confirm the filing on the BSE or NSE page.
What time did HAL announce Q2 results?
The first reports appeared at about 1:29 PM IST on 12 November 2026, while the market was open: Business Upturn 1:29 PM, Sahi 1:38 PM and Upstox 1:51 PM. These are the reports’ timestamps, not the exchange filing time, which I did not find. The HAL Q2 results date came 43 days after quarter end.
What was HAL net profit in Q2 FY27?
HAL reported consolidated net profit of Rs 1,936 crore, up 16% from Rs 1,669 crore, on revenue of Rs 7,613 crore, up about 15%, per Upstox, Sahi and Business Upturn. First-half profit was Rs 3,535 crore. I have not opened the filing, so check the HAL Q2 results date announcement.
Did HAL beat Q2 estimates?
Business Upturn reports revenue 1.7% above and profit 1.9% above its estimate, but EBITDA 9.6% below. A Zee Business headline had expected about 12% growth in revenue and profit. I did not verify either estimate, and neither is a consensus. Estimates differ by source.
What was HAL EBITDA margin in Q2 FY27?
EBITDA was Rs 1,739 crore and the margin 22.85%, against 23.51% a year earlier and about 27.7% in Q1 FY27 (my calculation). Operating costs grew about 15.9% while revenue grew 14.8%, my arithmetic. Business Upturn quotes an estimated margin of 25.7%, which I did not verify.
Why does HAL profit rise faster than EBITDA?
Profit grew 16% while EBITDA grew about 12%. Total income less revenue suggests other income of about Rs 989 crore against Rs 887 crore, my calculation, mostly interest on cash, which sits outside EBITDA. The reports do not split it, so check the filing for the HAL Q2 results date breakdown.
What is HAL order book after Q2 FY27?
Upstox puts it at about Rs 2.5 lakh crore. NiftyTrader reported Rs 2,54,538 crore at 31 March 2026, and Whalesbook said over Rs 2.45 lakh crore on 23 July 2026. The sources differ, so use the dated filing figure. The reports I read gave no exact number.
Upstox reported the NSE price at Rs 4,835.10 at 1:40 PM on 12 November 2026, down 2.3%, about 6.1% below the 17 August high of Rs 5,149.90 (my calculation). I did not find the official close. A price move on the HAL Q2 results date is not a guide to the numbers.
Did HAL declare an interim dividend with Q2 results?
I did not find an interim dividend announcement in the reports I read for the HAL Q2 results date. For the previous year PSU Connect reports Rs 45 a share in total, Rs 35 interim and Rs 10 final. Only the exchange announcement can confirm a new dividend and its record date.
Does this page give a HAL buy or sell call?
No. This is research and education, not advice. PositionalCalls.com is not a SEBI-registered research analyst or investment adviser. The page reports the HAL Q2 results date figures with sources and labels my own calculations. Speak to a registered adviser before investing.
Sources
- Upstox, HAL Q2 FY27 results (12 November 2026)
- Business Upturn, HAL Q2 results and estimates (12 November 2026)
- Sahi, HAL Q2 consolidated net profit (12 November 2026)
- Whalesbook, HAL Tejas Mk-1A delivery and order book (23 July 2026)
- PositionalCalls, HAL Q2 results FY27 analysis
- Stockport, HAL Q2 FY27 results calendar (updated 10 November 2026)
- MyAlgoMate, HAL Q2 FY27 results calendar and filings table
- Kotak Neo, HAL Q1 FY27 results (12 August 2026)
- Business World, HAL Q1 profit (August 2026)
- NiftyTrader, HAL Q1 FY27 results (12 August 2026)
- PSU Connect, HAL Q1 net profit and dividend
- StockGro, HAL Q1 FY27 Tejas ramp (undated within the article)
- Upstox, HAL Q2 FY26 earnings (12 November 2025)
- Bajaj Broking, HAL Q2 FY26 results
- Business Standard, HAL shares rise on Shakti engine line (6 October 2026)
- Zee Business, HAL Q2 results preview (headline only; page not opened)
- 5paisa, HAL share price page (11 November 2026, 9:58 AM; page not confirmed as live)
- BSE and NSE announcement pages and the HAL investor page: where the filing is published (I did not open them).
Editorial disclosure: PositionalCalls.com is not a SEBI-registered research analyst or investment adviser. Investments in securities markets are subject to market risks. Read all related documents carefully before investing. Returns are never guaranteed. PositionalCalls.com is an independent research and education site founded by Shubham Chaudhary. This page is not investment advice, a recommendation or a price target. How I researched this: I compared twelve press, calendar and data-platform reports of the date, the last two results, the order book and the Tejas deliveries, tied margins and growth rates across them, recalculated every derived figure and listed conflicts openly. I did not open the exchange filings; own calculations are labelled.

Shubham Chaudhary is the founder of PositionalCalls, an independent Indian stock market research website. He writes company fundamentals, quarterly results analysis, IPO analysis and sector research for NSE and BSE listed companies, with a focus on banking stocks, insurance and long-term value investing. Every article is built from primary sources such as RBI, SEBI, NSE and BSE filings and company annual reports, and states its risks plainly in simple language for retail investors.
Coverage areas Our research standards- Numbers checked against NSE, BSE and SEBI filings
- Risks and limits stated in every article
- No paid promotions or broker tie-ups
- Articles updated when new filings arrive