
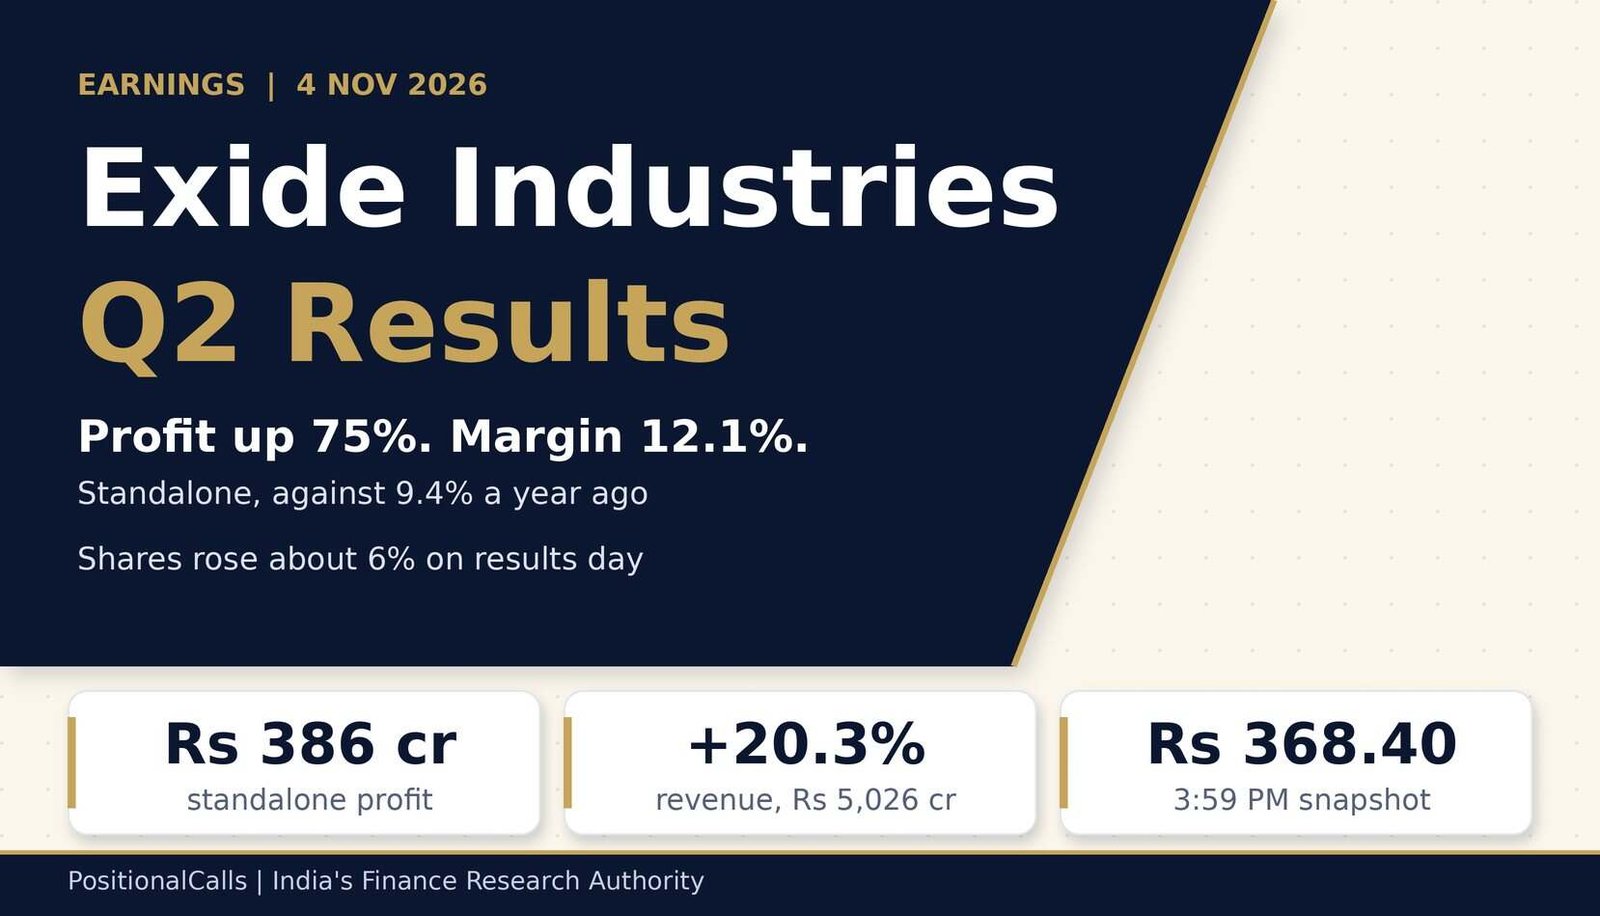
Earnings · Exide Industries Limited
The Exide Industries Q2 results, reported on 4 November 2026, show standalone profit up 75% on a 20% rise in sales. Here is what changed, why margins widened, how the shares moved and what to watch next.
Quick answer
Exide Industries Q2 results: standalone net profit rose 75.1% to Rs 386.45 crore on 4 November 2026, with revenue up 20.3% to Rs 5,026 crore. The EBITDA margin widened to 12.1% from 9.4%. The shares rose about 6.4% on the day, to Rs 368.40 in a 3:59 PM snapshot.
Latest update (Thursday, 5 November 2026, 6:30 AM IST): The results are out and this page is now the full analysis. Standalone profit was Rs 386.45 crore, EBITDA Rs 606 crore and consolidated profit Rs 287.14 crore. Thursday’s trading had not started when I wrote this, and I found no estimate changes yet; both will be added.
Earlier entries:
- Wednesday, 4 November 2026: Exide Industries reported Q2 FY27; shares rose about 6% from Rs 346.25.
- Sunday, 1 November 2026, 4:50 PM IST: Preview published with a base of about Rs 221 crore standalone profit.
Key takeaways
- Profit: the Exide Industries Q2 results show standalone profit of Rs 386.45 crore (+75.1%) and consolidated Rs 287.14 crore (+65.4%).
- Revenue: standalone Rs 5,026 crore, up 20.3% on the GST-hit base, but 5.3% below Q1 FY27 (my calculation).
- Margin: EBITDA Rs 606 crore at 12.1%, against 9.4% a year ago.
- Shares: previous close Rs 346.25, high near Rs 375.75, Rs 368.40 at 3:59 PM (+6.4%).
- Watch: input costs and the rupee, the lithium-ion ramp and the 5 November earnings call.
In plain words: The Exide Industries Q2 results compare with a weak quarter. Last September buyers waited for a tax cut on batteries, so sales and profit fell. This September sales were back, prices were higher and costs were better managed, so each rupee of sales left more profit.
Data note: Figures are as of Thursday, 5 November 2026, 6:30 AM IST. Results come from reports by Upstox, ScanX, Whalesbook, Tradebrains, 5paisa, Groww and multibagg.ai, which quote the company’s press release; I did not open the exchange filing. Update to my preview: the 1 November preview called Q1 FY27 consolidated profit unverified. Multibagg.ai gives Rs 351.30 crore, and this page uses it. The preview’s Q2 FY26 standalone base of about Rs 221 crore matches the Rs 220.74 crore comparative. Derived numbers are my calculation.
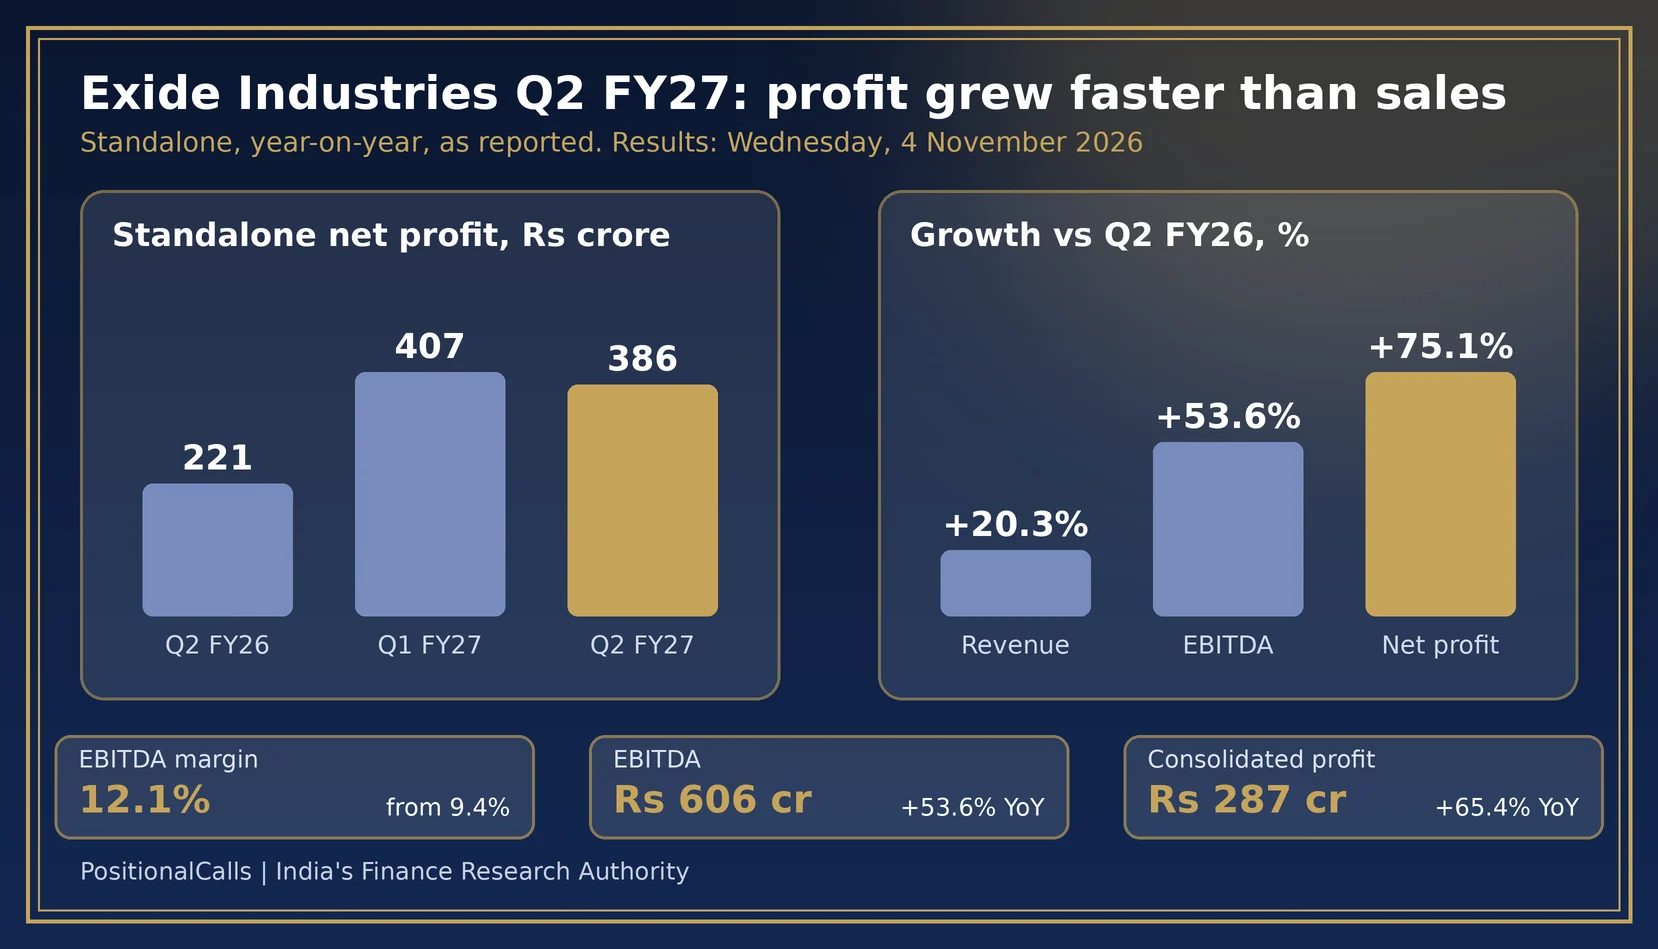
What were the Exide Industries Q2 results for FY27?
Exide Industries reported standalone revenue of Rs 5,026 crore (+20.3%), EBITDA of Rs 606 crore (+53.6%) and net profit of Rs 386.45 crore (+75.1%) for the quarter ended 30 September 2026.
| Measure | Q2 FY26 (Sep 2025) | Q1 FY27 (Jun 2026) | Q2 FY27 (Sep 2026) | Change |
|---|---|---|---|---|
| Standalone revenue, Rs crore | 4,178 | 5,305.05 | 5,026 | +20.3% YoY; -5.3% QoQ |
| Standalone EBITDA, Rs crore | 394.5 (about 395) | Not in sources | 606 | +53.6% YoY |
| Standalone EBITDA margin | 9.4% | Not in sources | 12.1% | +2.7 points (company) |
| Standalone PBT, Rs crore | 297.58 | Not in sources | 522.32 | +75.5% YoY |
| Standalone net profit, Rs crore | 220.74 | 407.26 | 386.45 | +75.1% YoY; -5.1% QoQ |
| Consolidated revenue, Rs crore | 4,364.51 | 5,528.38 | 5,291.87 | +21.2% YoY; -4.3% QoQ |
| Consolidated net profit, Rs crore | 173.64 | 351.30 | 287.14 | +65.4% YoY; -18.3% QoQ |
Cite this table: PositionalCalls, “Exide Industries Q2 FY27 Results Table, as of 5 November 2026”.
The Exide Industries Q2 results date was Wednesday, 4 November 2026, matching the date in Kotak Neo’s weekly list; last year the company reported on 14 November. The preview’s reading was right on one point: growth would look large because the base was low. Revenue is 5.3% below Q1 FY27 and standalone profit 5.1% below it (my calculation), so the quarter is a step down from Q1, not a new high.
The company credits healthy demand, the continued benefit of GST 2.0, a lower base and execution under its “One Exide” operating model. A separate hub of results is on the Q2 results calendar.
Exide Industries net profit Q2 FY27: why did profit jump 75% on 20% sales growth?
In the Exide Industries Q2 results, a 2.6-point wider EBITDA margin added about Rs 131 crore and extra sales added about Rs 80 crore, which together lifted EBITDA by Rs 211.5 crore (my calculation).
Exide Industries EBITDA Q2 FY27: the bridge
| EBITDA bridge, Rs crore | Amount | How I got it |
|---|---|---|
| Q2 FY26 EBITDA | 394.5 | 9.44% of Rs 4,178 crore |
| Sales effect | +80 | Extra revenue of Rs 848 crore at last year’s 9.44% margin |
| Margin effect | +131 | Rs 5,026 crore times the 2.62-point margin gain |
| Q2 FY27 EBITDA | 606 | 394.5 plus 80 plus 131, rounded |
Cite this table: PositionalCalls, “Exide Industries EBITDA Bridge, as of 5 November 2026”.
Operating leverage. Revenue rose 20.3%, EBITDA 53.6% and net profit 75.1%. Profit conversion also improved: net profit was 63.8% of EBITDA this quarter against 56.0% a year ago (my calculation), so costs below EBITDA grew more slowly than EBITDA.
Costs. ScanX reported that cost of materials rose 25.8% to Rs 3,642 crore while total expenses rose 15.9%. On my arithmetic materials were about 72.5% of revenue against about 69.3% a year ago, so material costs took a bigger share of sales and other costs fell. The company says price hikes and cost optimisation lifted the margin, while input costs stayed elevated on geopolitical challenges.
Worked example: what each point of margin is worth
On standalone revenue of Rs 5,026 crore, one percentage point of EBITDA margin is Rs 50.3 crore. The 2.62-point gain is therefore about Rs 131 crore. If the margin had stayed at last September’s 9.44%, EBITDA would have been about Rs 475 crore instead of Rs 606 crore (my calculation).
How did the Exide Industries share price react to the Q2 results?
After the Exide Industries Q2 results, the shares opened at Rs 348.70, touched about Rs 375.75 (+8.5%) and showed Rs 368.40, up 6.4% from the previous close of Rs 346.25, in a 3:59 PM snapshot.
| 4 Nov 2026 | Price, Rs | Move vs Rs 346.25 | Source |
|---|---|---|---|
| Open | 348.70 | +0.7% | Groww |
| Day low | 344.00 | -0.6% | Groww |
| Upstox update (2:04 PM) | 373.00 high | +7.7% | Upstox |
| Day high | 375.75 to 375.90 | +8.5% | Groww; Tradebrains |
| Report at about 4:05 PM | 370.25 | +6.9% | Tradebrains |
| 3:59 PM snapshot | 368.40 | +6.4% | 5paisa |
Cite this table: PositionalCalls, “Exide Industries Results-Day Price Path, as of 5 November 2026”.
Groww shows volume of about 1.08 crore shares. The 52-week range was Rs 287 to Rs 496.40, so Rs 368.40 is 25.8% below the high and 28.4% above the low (my calculation). Upstox said the stock had been muted in 2026 and turned positive for the year, up about 2%, on results day.
The 3:59 PM figure is a data-site snapshot and not the official close. I did not find a 5 November price, any brokerage estimate change or target when I wrote this, and under the Mode A guard this page carries no ratings or targets. This is a description of the move, not a forecast.
Why did the shares jump on a result with a lower margin than Q1?
The stock had been flat in 2026 and the year-ago quarter was weak, so a 75% profit rise and a 12.1% margin gave buyers a strong headline. A move reflects expectations as much as results. Upstox reported a 52-week high of Rs 459.90 on 30 July 2026 after Q1, and data sites now show a 52-week high of Rs 496.40, so the stock has traded well above Rs 368 this year.
Did the Exide Industries Q2 results beat or miss expectations?
I found no Q2 FY27 estimate, so I cannot call a beat or miss. Against my own preview guide, margin and EBITDA scored stronger, and revenue and profit scored in line.
| Mark | Preview guide (stronger / in line / weaker) | Actual Q2 FY27 | Reading |
|---|---|---|---|
| Revenue growth | Above 30% / 20-30% / below 20% | +20.3% | In line, barely |
| EBITDA margin | Above 11.5% / 10-11.5% / below 10% | 12.1% | Stronger |
| EBITDA | Above Rs 600 cr / 500-600 / below 500 | Rs 606 cr | Stronger, by Rs 6 crore |
| Standalone profit | Above Rs 400 cr / 300-400 / below 300 | Rs 386.45 cr | In line |
| OEM and replacement growth | Above 25% / double digits / single digits | OEM 25%; replacement double digit | In line to stronger |
Cite this table: PositionalCalls, “Exide Industries Preview Guide Versus Actual, as of 5 November 2026”.
The preview scenario table had a +20% revenue case at a 12% margin giving EBITDA of Rs 602 crore (+53%). Actual EBITDA of Rs 606 crore (+53.6%) landed almost exactly on it, although the guide’s profit case of +85% (Rs 409 crore) was above the actual +75.1%. Those scenarios were illustrations, not forecasts.
PositionalCalls WhatsApp channel
Exide results, then the next company
- The Exide price reaction as it updates
- Base-to-beat tables for results still due
- Links to every updated Q2 FY27 page
What drove Exide Industries growth in Q2 FY27?
Automotive OEM grew about 25%, two-wheeler and four-wheeler replacement grew in double digits, and home inverters and solar grew above 20% for a second straight quarter, per Upstox.
| Line | Q2 FY27 as reported | Source |
|---|---|---|
| Auto OEM | About 25% growth; new business for Exide auxiliary battery on MG Hector and Tata Aeris | Upstox |
| Replacement (2W and 4W) | Double-digit growth, fourth quarter in a row | Upstox |
| Home inverters and solar | Above 20%, second straight quarter | Upstox |
| Exports | New deal with Germany’s ExCom Energy Solutions | Whalesbook |
| Liquidity | Zero debt; healthy cash flow | Company release via Upstox |
| Lithium-ion subsidiary | 6 GWh facility commissioned 23 Sep 2026 | Upstox |
Cite this table: PositionalCalls, “Exide Industries Segment Marks, as of 5 November 2026”.
Upstox calls the OEM growth the fourth straight year at 25%; in a quarterly release that more likely means the fourth straight quarter, which is my reading and not a stated fact. The company credits GST 2.0 affordability benefits for demand. Last year only the last week of the quarter carried the lower tax rate; this year the whole quarter did.
Which Exide Industries figures differ across sources?
The Exide Industries Q2 results show profit as Rs 386, 386.45 and Rs 287 crore, depending on whether the line is standalone or consolidated. Match each figure to its basis and source.
| Figure | Version A | Version B | What to do |
|---|---|---|---|
| Q2 FY27 profit | Standalone Rs 386.45 crore (+75.1%) | Consolidated Rs 287.14 crore (+65.4%) | Say which one you quote |
| Consolidated profit growth | +65.4% (my calculation; Tradebrains +65.4%) | +75.1% in one summary | The second is the standalone rate |
| Consolidated revenue | Rs 5,291.87 crore (+21.3%) | Rs 5,333.97 crore (5paisa; Investywise) | Use Rs 5,291.87 crore; second differs |
| Consolidated EBITDA | Rs 561.51 crore, 10.6% (Tradebrains) | Rs 561 crore, 11% (Groww snippet) | Margin basis differs; use 10.6% |
| Q1 FY27 consolidated profit | Rs 351.30 crore (multibagg.ai) | About Rs 350 crore in an earlier source | Use Rs 351.30 crore |
| Standalone minus consolidated | Rs 99.3 crore (Q2 FY27) | Rs 47.1 crore (Q2 FY26) | Gap has doubled |
Cite this table: PositionalCalls, “Exide Industries Definition-Trap Table, as of 5 November 2026”.
What changed and when: on 4 November 2026 the consolidated base for Q1 FY27 became Rs 351.30 crore, resolving the open point in my 1 November preview. The Q1 consolidated EBITDA of Rs 621.48 crore (Tradebrains) is a derived figure; it matches Upstox’s Rs 621 crore from July.
Why is the standalone-consolidated gap so wide?
Standalone profit exceeds consolidated by Rs 99.3 crore, up 111% from Rs 47.1 crore a year ago (my calculation). Exide invested Rs 550 crore more in its lithium-ion subsidiary between April and October 2026, and its facility started in September. A gap of this kind usually reflects subsidiary losses, but none of the sources I read says so, so I treat it as my inference.
EBITDA versus profit
EBITDA leaves out interest, depreciation and tax. In Q2 FY27 standalone EBITDA rose 53.6% but profit rose 75.1%, so depreciation, finance cost and tax grew slower than operating profit.
What did Exide management say, and what about the lithium-ion business?
Management said demand held up as GST benefits continued, input costs stayed elevated because of geopolitical challenges, and a weaker rupee blocked the full benefit of softer lead and antimony prices.
The release, as quoted by Upstox, reads that on a year-on-year basis input costs remained elevated, and on a quarter-on-quarter basis the full benefit of softer lead (LME) and antimony prices could not be realised because of a weaker rupee. For a battery maker lead is the main input, so the rupee and lead prices are the lines to watch each quarter. The company also reports zero debt.
| Item | What was reported | Source | Check in the filing |
|---|---|---|---|
| Lithium-ion plant | 6 GWh cell facility commissioned 23 Sep 2026 | Upstox | Start-up costs in subsidiary results |
| Equity invested | Rs 550 crore Apr-Oct 2026; total Rs 5,352 crore | Upstox | Segment note and capital commitments |
| Subsidiary top-up | Rs 99.99 crore investment on 29 Sep 2026 | ScanX headline list | Whether part of the Rs 550 crore |
| Earnings call | Thu 5 Nov 2026, 12:00 PM IST | multibagg.ai | Transcript for margin and capex remarks |
| EPS | Basic Rs 4.55 against Rs 2.60 | ScanX | Standalone, not consolidated |
Cite this table: PositionalCalls, “Exide Industries Management and Lithium-ion Items, as of 5 November 2026”.
How do the Exide Industries Q2 results compare with other results this week?
Compare Exide on the same measures as other results: revenue growth, EBITDA margin and profit basis. Several companies reported on 4 November, and each has its own base.
See our pages on Zydus Lifesciences Q2 results, Cummins India Q2 results and Berger Paints Q2 results for the method; they cover other companies, so only the method carries over. The Q2 results calendar and the earnings calendar list the companies that have reported.
If you plan to sell shares after a move like this, our guide to capital gains tax on shares explains how gains and losses are taxed. It is general information, not tax advice.
What should you watch next after the Exide Industries Q2 results?
After the Exide Industries Q2 results, watch six lines: the margin against 12.1%, lead and rupee moves, replacement and OEM growth, lithium-ion costs, the earnings call and the Q3 results date.
| What to watch | Mark to compare | Why it matters |
|---|---|---|
| EBITDA margin | 12.1% standalone; 10.6% consolidated | Price hikes must hold against input costs |
| Lead and the rupee | Release: weaker rupee blocked part of the benefit | Main input cost for batteries |
| Replacement and OEM growth | Double digits; about 25% | Two largest demand lines |
| Lithium-ion subsidiary | Rs 5,352 crore invested; 6 GWh commissioned | Start-up costs hit consolidated profit |
| Standalone-consolidated gap | Rs 99.3 crore | A wider gap means higher subsidiary drag |
| Q3 FY27 results date | Not announced as of 5 November 2026 | Confirm on the exchange page |
Cite this table: PositionalCalls, “Exide Industries Next-Quarter Watchlist, as of 5 November 2026”.
Results-day checklist for the next quarter
- Confirm the date on the BSE or NSE announcement page.
- Open the standalone and consolidated statements before any headline.
- Take both periods from the same source and basis.
- Compare the EBITDA margin with 12.1% and 9.4%.
- Check the notes for exceptional items and subsidiary losses.
- Read the press release for input-cost remarks.
- Write your own plan before the price moves.
What it costs: reading a filing is free; trading adds brokerage, securities transaction tax and other charges, so check your broker’s current schedule. Scam warning: on results days fake “result alert” groups and sure-shot tips circulate. Nobody can guarantee a gain.
What do most people miss about the Exide Industries Q2 results?
- The 75% is on a low base. Q2 FY26 profit was Rs 221 crore, hit by the GST pause.
- Profit fell from Q1. Standalone profit was 5.1% below Q1 FY27 and consolidated 18.3% below.
- Two profit lines. Rs 386.45 crore standalone and Rs 287.14 crore consolidated.
- The gap is widening. Rs 99.3 crore against Rs 47.1 crore a year ago.
- One summary mislabels growth. The 75.1% rate belongs to standalone, not consolidated profit.
- The price is a snapshot. There is no official close in my sources.
Analyst’s note: how to think about this quarter
- What stands out (reasoning): in the Exide Industries Q2 results the margin gain, not volume, did most of the work, adding about Rs 131 crore.
- Easy to miss: against Q1, both revenue and profit fell, and consolidated EBITDA fell about 9.7%.
- What would change the view: a standalone margin back near 10%, or a still wider subsidiary gap.
- Caution: one quarter does not fix a long-term value. This page gives no target or recommendation.
- Reader action: read both profit lines and match each to its basis.
Bottom line
Known: the Exide Industries Q2 results show standalone profit of Rs 386.45 crore (+75.1%), revenue of Rs 5,026 crore (+20.3%) and a 12.1% EBITDA margin, reported on 4 November 2026.
Not known yet: the official close, Thursday’s reaction, any estimate changes, the call remarks and the Q3 date.
Next read: the Q2 results calendar, which lists the companies reporting next.
Part of the earnings coverage.
PositionalCalls WhatsApp channel
Never miss the next results summary
- Filing-day numbers, stamped and sourced
- Base-to-beat tables before results
- Price reactions and corrections as they happen
Exide Industries Q2 results: frequently asked questions
What was Exide Industries net profit in the Q2 results for FY27?
Exide Industries reported standalone net profit of Rs 386.45 crore for the quarter ended 30 September 2026, up 75.1% from Rs 220.74 crore. Standalone revenue rose 20.3% to Rs 5,026 crore. Consolidated profit was Rs 287.14 crore, up 65.4% (my calculation).
When were the Exide Industries Q2 results announced?
The Exide Industries Q2 results came on Wednesday, 4 November 2026, as listed in Kotak Neo’s weekly list. First reports appeared around 1:22 PM IST. A multibagg.ai report lists the earnings call for Thursday, 5 November at 12:00 PM IST.
Why do the Exide Industries Q2 results show profit up 75% on sales up 20%?
Operating leverage. EBITDA rose 53.6% to Rs 606 crore and the margin rose 2.6 points to 12.1%, helped by price hikes and cost optimisation, per the company. Profit conversion also improved: net profit was 63.8% of EBITDA against 56.0% (my calculation).
How did the Exide Industries share price react to the Q2 results?
The shares opened at Rs 348.70, hit a high near Rs 375.75 (+8.5%) and showed Rs 368.40, up 6.4%, in a 3:59 PM snapshot on 5paisa. The previous close was Rs 346.25. That snapshot is not the official close. I found no 5 November price yet.
What was Exide Industries EBITDA and margin in Q2 FY27?
Standalone EBITDA was Rs 606 crore, up 53.6% from Rs 395 crore, at a margin of 12.1% against 9.4%. Consolidated EBITDA was Rs 561.51 crore at 10.6% (Tradebrains). Consolidated EBITDA fell about 9.7% from Q1 FY27’s Rs 621.48 crore (my calculation).
What is the Exide Industries consolidated profit for Q2 FY27?
Consolidated net profit was Rs 287.14 crore, up 65.4% from Rs 173.64 crore (my calculation), and 18.3% below Q1 FY27’s Rs 351.30 crore. One summary wrongly printed the growth as 75.1%, which is the standalone rate. Match each profit line to its basis.
Did the Exide Industries Q2 results beat estimates?
I found no Q2 FY27 consensus estimate, so I cannot call a beat or miss. Last September the company missed a poll estimate of Rs 319 crore with Rs 221 crore. Against my own preview guide, margin and EBITDA scored stronger, and revenue and profit in line.
What did Exide management say about costs and demand?
CEO Avik Roy said demand held up as GST affordability benefits continued. The release says input costs stayed elevated on geopolitical challenges, and softer lead and antimony prices were not fully realised because of a weaker rupee. The company reports zero debt.
What is the status of Exide’s lithium-ion business?
Exide Energy Solutions commissioned its 6 GWh lithium-ion cell facility in Bengaluru on 23 September 2026. Exide invested Rs 550 crore in the subsidiary between April and October 2026, taking the total to Rs 5,352 crore, per Upstox. Revenue was earlier expected in FY27.
Why is Exide’s standalone profit higher than consolidated profit?
Standalone profit of Rs 386.45 crore is Rs 99.3 crore above consolidated Rs 287.14 crore, against a gap of Rs 47.1 crore a year ago (my calculation). The gap likely reflects losses at the lithium-ion subsidiary, which is my inference, not a stated fact.
Sources
- BSE corporate announcements: where the Exide Industries filing appears.
- NSE corporate filings: financial results: the same filing on NSE.
- Upstox: Exide Industries Q2 results, 4 November 2026.
- ScanX: Exide Industries Q2 FY27 results, 4 November 2026.
- Whalesbook: Exide Industries Q2 PAT jumps 75%, 4 November 2026.
- Tradebrains: Exide Industries surges after Q2, 4 November 2026.
- 5paisa: Exide Industries share price, 4 November 2026.
- Groww: Exide Industries share price, 4 November 2026.
- multibagg.ai: Exide Industries Q2 FY27 results due, 4 November 2026.
- Also named, not linked: Investywise, Kotak Neo, Free Press Journal.
Disclosure: PositionalCalls.com is not a SEBI-registered research analyst or investment adviser. Investments in securities markets are subject to market risks. Read all related documents carefully before investing. Returns are never guaranteed. PositionalCalls is an independent research and education site founded by Shubham Chaudhary. Nothing here is a recommendation, target or investment advice. How I researched this: for the Exide Industries Q2 results I read reports by Upstox, ScanX, Whalesbook, Tradebrains, 5paisa, Groww and multibagg.ai, noted where sources differ, and marked every derived number as my calculation. I did not open the exchange filing. Figures are as of Thursday, 5 November 2026, 6:30 AM IST.

Shubham Chaudhary is the founder of PositionalCalls, an independent Indian stock market research website. He writes company fundamentals, quarterly results analysis, IPO analysis and sector research for NSE and BSE listed companies, with a focus on banking stocks, insurance and long-term value investing. Every article is built from primary sources such as RBI, SEBI, NSE and BSE filings and company annual reports, and states its risks plainly in simple language for retail investors.
Coverage areas Our research standards- Numbers checked against NSE, BSE and SEBI filings
- Risks and limits stated in every article
- No paid promotions or broker tie-ups
- Articles updated when new filings arrive