
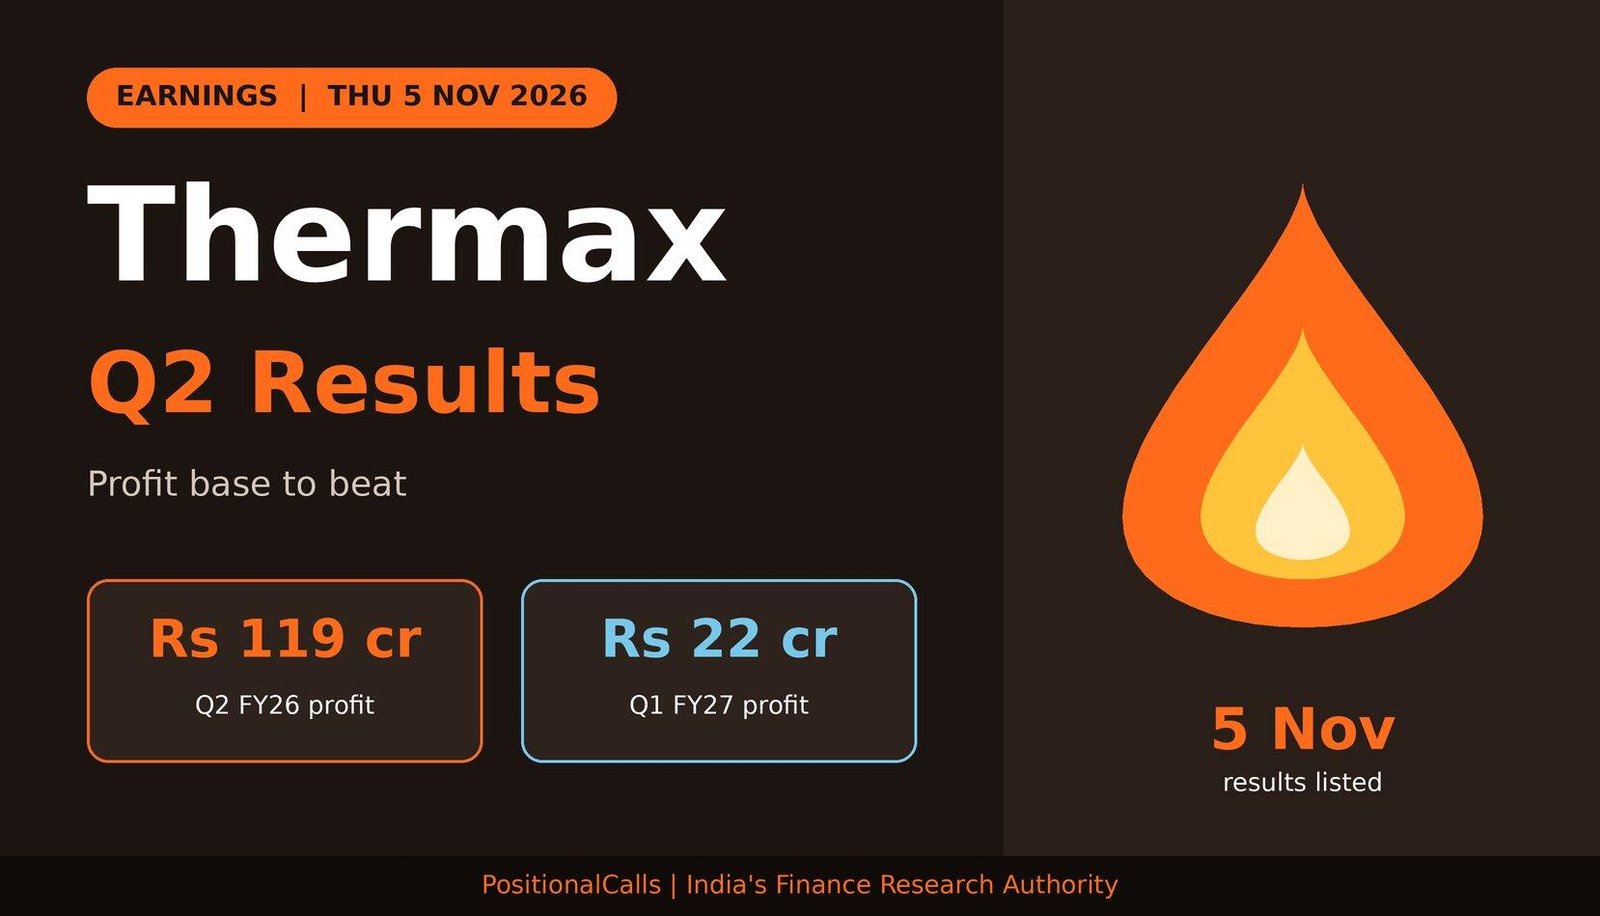
Earnings · Thermax Limited
Thermax is listed to report its September-quarter numbers on 5 November 2026. Here are the date check, the Rs 119 crore profit base, the 85% fall in Q1 caused by one project overrun, the figures that are easy to mix up, and what to read first.
Quick answer
Thermax Q2 results are listed for Thursday, 5 November 2026 in one weekly list. The base to beat is about Rs 119 crore consolidated profit on Rs 2,474 crore revenue, itself down 40%. Q1 FY27 profit fell about 85% to Rs 21.79 crore after a Rs 91 crore project cost overrun, so the comparison is a low base against a low latest quarter.
Latest update (Sunday, 1 November 2026, 11:00 PM IST): The results are not out. Kotak Neo’s weekly list shows Thermax for Thursday, 5 November; the date rests on that one report and the filing time is not announced. This page becomes the live analysis after the filing.
Earlier entries:
- Friday, 30 October 2026, 6:00 PM IST: Kotak Neo listed Thermax among Thursday’s results.
- Thursday, 30 July 2026: Q1 FY27 results were reported, per Free Press Journal.
Key takeaways
- Date: Thursday, 5 November 2026 from one weekly list; confirm on the exchange page.
- Base to beat: Q2 FY26 consolidated profit about Rs 119 crore, revenue Rs 2,474 crore, EBITDA Rs 171.9 crore, margin 6.9%.
- Latest quarter: Q1 FY27 profit Rs 21.79 crore (-85%), revenue Rs 2,303 crore (+7%).
- Cause of the Q1 fall: a Rs 91 crore higher cost estimate for one Industrial Infra project, plus a Rs 56 crore incentive in the year-ago quarter.
- Order balance: Rs 14,045 crore on 30 June 2026, up 23%.
In plain words: Before the Thermax Q2 results arrive, remember that the company builds boilers, heating and cooling systems and clean-air equipment, often through large projects that take years. When the cost of finishing one project rises, profit falls even if sales grow. That is what happened in Q1. A preview tells you which figures to hold the new numbers against.
Data note: Figures are as of Sunday, 1 November 2026, 11:00 PM IST. The results date comes from one weekly list; the filing itself was not opened for this page. Figures are consolidated unless stated and come from Free Press Journal, Angel One, Investywise and Whalesbook. Where sources differ I say so. Derived numbers are my calculation.
When are the Thermax Q2 results?
The Thermax Q2 results date is listed as Thursday, 5 November 2026. The date rests on one weekly list, so confirm it on the exchange page.
Kotak Neo’s weekly list, posted at 6:00 PM IST on 30 October 2026, names Thermax among Thursday’s results, and says dates are based on announced board-meeting schedules and may change. I found no second report that quotes the intimation, so treat the date as likely but unconfirmed.
Last year’s Q2 FY26 results were covered in articles published on 11 November 2025, and the sources I opened do not state the exact filing date. Q1 FY27 came on Thursday, 30 July 2026. The filing time is not announced. Do not trust a screenshot that claims a time before the exchange page shows it.
What will Thermax publish?
Thermax will publish unaudited standalone and consolidated results for the quarter and half-year ended 30 September 2026, with a press release and an order update. Sources quote both sets, so check the label on every figure.
Is the date confirmed?
| Fact | Source | Status | What to do |
|---|---|---|---|
| Results on Thursday, 5 November 2026 | Kotak Neo weekly list (30 Oct 2026, 6:00 PM IST) | Single report; list is partial and dates may change | Open the BSE or NSE filing to confirm |
| Last year’s Q2 coverage | Investywise and Whalesbook, 11–12 Nov 2025 | Exact filing date not stated | Do not assume the same date |
| Filing time | Not announced | Unknown | Do not act on unconfirmed screenshots |
Cite this table: PositionalCalls, “Thermax Q2 FY27 Date Check, as of 1 November 2026”.
Treat any article that gives another date for the Thermax Q2 results as unreliable until you see the filing.
What is the base to beat for the Thermax Q2 results?
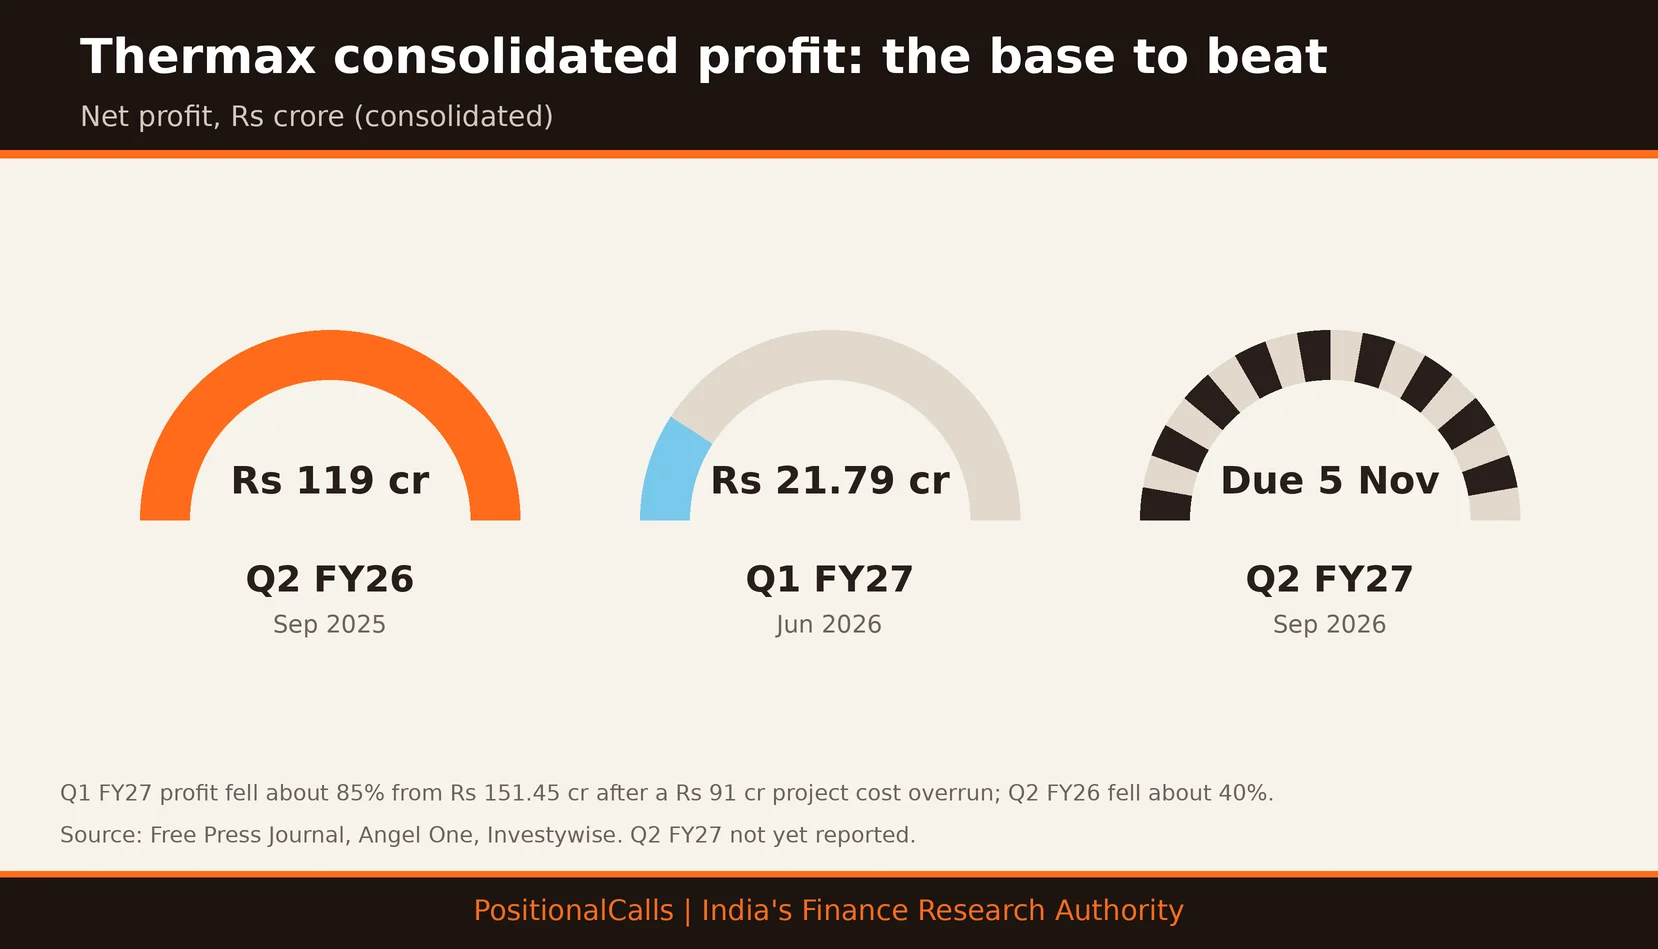
The base to beat is Q2 FY26 consolidated profit of about Rs 119 crore on revenue of Rs 2,474 crore, against Rs 21.79 crore and Rs 2,303 crore in Q1 FY27.
| Measure (consolidated) | Q2 FY25 (Sep 2024) | Q2 FY26 (Sep 2025) | Q1 FY27 (Jun 2026) |
|---|---|---|---|
| Revenue, Rs crore | 2,616 | 2,474 (-5%) | 2,303 (+7% on 2,158) |
| EBITDA, Rs crore | Not in sources | 171.9 (-38%) | Not in sources |
| EBITDA margin | About 10.6% | About 6.9% | Not in sources |
| Profit before tax, Rs crore | 266 | 174 (-35%) | 42.14 (vs 211.47) |
| Net profit, Rs crore | 198 | 119 (-40%) | 21.79 (vs 151.45) |
| Order balance, Rs crore | 11,593 | 12,300 (+6%) | 14,045 (+23% on 11,376) |
Cite this table: PositionalCalls, “Thermax Base-to-Beat Table, as of 1 November 2026”.
Thermax net profit Q2 FY27: the flat-quarter sum
Here is the first useful sum. Q1 FY27 revenue of Rs 2,303 crore is -6.9% against Q2 FY26’s Rs 2,474 crore, and Q1 profit of Rs 21.79 crore is -81.7% against Rs 119 crore (my calculations). A flat Q2 would therefore be a very large fall on last year’s base, and any figure near Rs 119 crore would mean the project overrun did not repeat.
How was the Q2 FY26 base built?
Revenue fell 5% from Rs 2,616 crore, and Whalesbook reported EBITDA of Rs 171.9 crore, down 38%, at a margin of 6.9% against 10.6% (171.9 divided by 2,473.9 is 6.9%, my calculation). Investywise noted the year-ago quarter included a Rs 66 crore incentive accrual, and the company booked Rs 42 crore of extra cost provisions, mainly for one Industrial Infra project. Order booking rose 6% to Rs 3,551 crore.
Thermax Q2 results preview: what to expect
No consensus estimate was found for Q2 FY27. Last November the company missed estimates widely, and Q1 FY27 showed a profit fall that the company tied to one project.
| Item | What was reported | Source and date | Note |
|---|---|---|---|
| Q2 FY26 estimates vs actual | Consensus: profit Rs 201.6 crore, revenue Rs 2,841.3 crore, EBITDA Rs 274.4 crore; actual Rs 119.4, 2,473.9 and 171.9 crore | Whalesbook, 12 Nov 2025 | Estimate basis not stated |
| Q1 FY27 cause | Rs 91 crore higher estimated cost to complete one Industrial Infra project | Free Press Journal, 30 Jul 2026 | Company explanation |
| Year-ago effect | Rs 56 crore incentive income in Q1 FY26 for a subsidiary | Free Press Journal | Makes Q1 comparison harsher |
| Order book | Rs 14,045 crore, up 23%; Rs 139 crore from a forecasting change | Free Press Journal | Not new contracts |
| Consensus Q2 estimate | None found | Not applicable | Do not read Q1 as a forecast |
Cite this table: PositionalCalls, “Thermax Q2 FY27 Outlook Marks, as of 1 November 2026”.
Angel One reported Q1 total income of Rs 2,370.92 crore, up 6.6%, and profit before tax of Rs 42.14 crore against Rs 211.47 crore. Neither article I opened gave an EBITDA or margin for Q1, so treat any Q1 margin you see as unverified until you read the filing.
Thermax EBITDA Q2 FY27: what to expect
Adding the Rs 91 crore overrun back to Q1 profit before tax of Rs 42.14 crore gives about Rs 133 crore (my illustration, which ignores tax and every other effect). That compares with Rs 174 crore in Q2 FY26, which itself carried Rs 42 crore of provisions. The point is that one project explains most of the Q1 gap, so the Q2 filing should show whether the cost estimate for that project moved again.
Angel One reported the shares at Rs 3,925.50 at 11:26 AM IST on 31 July 2026, down 7.67% from the previous close. After the Q2 FY26 results the stock closed at Rs 3,176 on 11 November 2025, up 1.19%, per Whalesbook. Those are reactions to what the market expected, not forecasts of Q2 FY27.
Thermax EBITDA and profit Q2 FY27: scenarios
These Thermax Q2 results scenarios are arithmetic, not forecasts. A flat Q1 profit would be -81.7% on Q2 FY26.
Assumptions: consolidated; Q2 FY26 revenue Rs 2,474 crore and EBITDA Rs 171.9 crore; revenue growth of 0%, 5% and 10% is my illustration around Q1’s 7% year-on-year growth; margins of 6.9%, 9.0% and 10.6% run from last September’s level to the Q2 FY25 level.
| Revenue growth on Q2 FY26 | EBITDA at 6.9% margin | EBITDA at 9.0% margin | EBITDA at 10.6% margin |
|---|---|---|---|
| 0% (Rs 2,474 crore) | Rs 171 crore (-1%) | Rs 223 crore (+30%) | Rs 262 crore (+53%) |
| +5% (Rs 2,598 crore) | Rs 179 crore (+4%) | Rs 234 crore (+36%) | Rs 275 crore (+60%) |
| +10% (Rs 2,721 crore) | Rs 188 crore (+9%) | Rs 245 crore (+42%) | Rs 288 crore (+68%) |
Cite this table: PositionalCalls, “Thermax Q2 FY27 EBITDA Scenarios, as of 1 November 2026”.
Profit scenarios
| Consolidated net profit | Against Q2 FY26 (Rs 119 crore) | Against Q1 FY27 (Rs 21.79 crore) |
|---|---|---|
| Rs 22 crore | -82% | +1% |
| Rs 60 crore | -50% | +175% |
| Rs 119 crore | +0% | +446% |
| Rs 150 crore | +26% | +588% |
Cite this table: PositionalCalls, “Thermax Q2 FY27 Profit Scenarios, as of 1 November 2026”.
Three worked examples
- Margin as last September: revenue +5% is Rs 2,598 crore and a 6.9% margin gives EBITDA of Rs 179 crore, +4% on Rs 171.9 crore (my calculation).
- Margin of 9.0%: Rs 234 crore, +36%.
- Margin of 10.6%: Rs 275 crore, +60%.
The scenarios hold other lines constant. In practice depreciation, other income, tax, project cost estimates and the revenue-recognition timing on large orders sit between EBITDA and profit, and any of them can move the result.
Project businesses also recognise revenue as work progresses, so a quarter with few milestones can show weak revenue even when the order book grows. That is why the order balance, order booking and margin should be read together with revenue.
Which Thermax figures should you compare?
When you compare the Thermax Q2 results with last year, match operating revenue with operating revenue and consolidated with consolidated. Several versions circulate.
| Figure | Version A | Version B | The trap |
|---|---|---|---|
| Q1 FY27 revenue, Rs crore | 2,303 operating revenue (+7%) | 2,370.92 total income (+6.6%) | Different lines |
| Q1 FY27 profit fall | About 85% (Free Press Journal) | 85.6% (Angel One) | Rounding of the same drop |
| Q1 FY27 profit, Rs crore | 21.79 consolidated | Net loss of 18.10 standalone | Different bases |
| Q2 FY26 profit, Rs crore | 119 (Investywise) | 119.4 (Whalesbook) | Rounding |
| Order balance Q1 FY27, Rs crore | 14,045 reported | About 13,906 excluding the Rs 139 crore forecast change (my calculation) | Reporting change, not new contracts |
| Prior-year Q1 profit, Rs crore | 151.45 including incentive income | About 95 without the Rs 56 crore incentive (my illustration, pre-tax) | One-off in the base |
Cite this table: PositionalCalls, “Thermax Definition-Trap Table, as of 1 November 2026”.
The same company can therefore look worse or better depending on which line a headline picks. Standalone results showed a loss of Rs 18.10 crore in Q1 against a profit of Rs 46.52 crore a year earlier, while consolidated profit stayed positive at Rs 21.79 crore because subsidiaries contributed.
EBITDA versus profit
EBITDA is earnings before interest, tax, depreciation and amortisation. A project cost overrun is booked in the operating costs, so it cuts both EBITDA and profit. Net profit also reflects tax, depreciation and the results of subsidiaries.
The order book trap
The company said a change to a rolling 12-month forecast at Thermax Onsite Energy Solutions added Rs 139 crore, or 5%, to the order book without changing underlying contracts or revenue recognition. Read order growth with that note in mind.
One more habit helps: write the exact line, the basis and the source beside every figure before results day. When the company files, you can then see in seconds whether a headline is comparing like with like, instead of reacting to a growth rate built on a different base.
PositionalCalls WhatsApp channel
Get the Thermax Q2 numbers on WhatsApp
- The filing time and headline numbers, stamped
- Base-to-beat tables for the next company results
- Links to updated Q2 FY27 pages
What do the order book and project costs need to show?
In the Thermax Q2 results, a steady order book, stable project cost estimates and an EBITDA margin back above Q2 FY26’s 6.9% are the marks to look for.
| Line | Q2 FY26 | Q1 FY27 | Source |
|---|---|---|---|
| Order booking | Rs 3,551 crore, +6% | Rs 2,809 crore, +2% | Investywise; Free Press Journal |
| Order balance | Rs 12,300 crore, +6% | Rs 14,045 crore, +23% | Investywise; Free Press Journal |
| Industrial Infra | Lower order inflows; Rs 42 crore extra provisions | Rs 91 crore higher cost estimate on one project | Whalesbook; Investywise; Free Press Journal |
| Industrial Products | Order inflows rose | Not in sources | Whalesbook |
| Incentive income | Rs 66 crore accrued in the year-ago base | Rs 56 crore in the year-ago quarter | Investywise; Free Press Journal |
| Margin | 6.9%, from 10.6% | Not in sources | Whalesbook |
Cite this table: PositionalCalls, “Thermax Order and Project Marks, as of 1 November 2026”.
Two quarters in a row now carry a project-specific cost hit in Industrial Infra, which is why the Q2 filing should be read for the notes on project cost estimates as much as for the headline profit.
Watch whether order booking grows faster than the 2% of Q1, whether the order balance stays above Rs 14,000 crore, and whether the project cost estimate is revised again.
Which other results land the same week as Thermax?
Kotak Neo’s weekly list shows Berger Paints, Sai Life Sciences, TeamLease Services and Ugro Capital on Thursday too, with Apollo Hospitals, Cummins India and Exide Industries on Wednesday and Hindalco on Friday.
The list is partial and dates may change. For the format of a results read, see our recent posts on Exide Industries Q2 results, Cummins India Q2 results and Berger Paints Q2 results. They cover other companies, so only the method carries over. The Q2 results calendar and the earnings calendar list the companies that have reported.
If you hold Thermax shares and plan to sell later, our guide to capital gains tax on shares covers how gains are taxed. It is general information, not tax advice.
How to read the Thermax Q2 results in 10 minutes
To read the Thermax Q2 results quickly, go through seven lines in order: revenue, EBITDA, margin, profit before tax, net profit, order book and the notes on project costs.
| What to read | Mark to compare | Question to ask |
|---|---|---|
| Revenue | Rs 2,474 crore; Rs 2,303 crore | Did it grow on both? |
| EBITDA | Rs 171.9 crore | How far above last September? |
| EBITDA margin | 6.9% | Did it recover? |
| Profit before tax | Rs 174 crore; Rs 42.14 crore | Did the overrun repeat? |
| Net profit | Rs 119 crore; Rs 21.79 crore | Near which mark? |
| Order book | Rs 14,045 crore | Did it hold? |
| Notes | Project cost estimates, one-offs | Is any line unusual? |
Cite this table: PositionalCalls, “Thermax Results-Day Decoder, as of 1 November 2026”.
How to read the Thermax filing on NSE or BSE
Open the exchange announcement, find the consolidated statement first and compare each line with the base table above, same measure, same basis.
- Open the BSE corporate announcements page or the NSE corporate filings page and search for Thermax.
- Choose the financial results announcement for the quarter ended 30 September 2026.
- Find the consolidated statement first, then the standalone.
- Check the unit and whether a column is for the quarter or six months.
- Read revenue, total expenses and profit after tax on both bases.
- Open the press release for order booking and segment commentary.
- Check the notes for project cost revisions and exceptional items.
- Compare every figure with the base table.
What it costs: reading a filing is free. If you trade the stock, brokerage, securities transaction tax and other charges apply, so check your broker’s current schedule. Tax angle: dividends and gains follow the current tax rules, so see our guide to capital gains tax on shares or ask a tax adviser. Scam warning: on results day, fake “result alert” groups and sure-shot tips circulate. Nobody can guarantee a gain, and official filings are free.
What is the results-day checklist for Thermax?
- Confirm the date on the BSE or NSE announcement page.
- Note the filing time and stamp what you read with it.
- Open the consolidated statement of the Thermax Q2 results before any headline.
- Compare revenue with Rs 2,474 crore and Rs 2,303 crore.
- Check whether a profit number is standalone or consolidated.
- Compare net profit with Rs 119 crore and Rs 21.79 crore.
- Check the EBITDA margin against 6.9%.
- Check the notes for project cost revisions.
- Write your own plan before the price moves.
What are the risks around the Thermax Q2 results?
How to grade Thermax’s September-quarter numbers: a reading guide
Use the table to grade the Thermax Q2 results as a reading aid, not a forecast. The cut-offs are my illustration, built from the Q1 FY27 and Q2 FY26 marks.
Assumptions: consolidated; Q2 FY26 revenue Rs 2,474 crore, EBITDA Rs 171.9 crore and profit Rs 119 crore; Q1 FY27 profit of Rs 21.79 crore is the weak mark.
| Mark | Stronger | In line | Weaker |
|---|---|---|---|
| Revenue growth on Q2 FY26 | Above 10% | 3% to 10% | Below 3% |
| EBITDA margin | Above 9% | 7% to 9% | Below 7% |
| EBITDA | Above Rs 230 crore | Rs 170 to 230 crore | Below Rs 170 crore |
| Net profit | Above Rs 150 crore | Rs 80 to 150 crore | Below Rs 80 crore |
| Order booking growth | Above 10% | 0% to 10% | Negative |
Cite this table: PositionalCalls, “Thermax Q2 FY27 Reading Guide, as of 1 November 2026”.
Worked example: suppose revenue is Rs 2,600 crore, EBITDA Rs 200 crore and profit Rs 100 crore. Revenue would be up +5.1% (2,600 divided by 2,474), EBITDA +16.3% on Rs 171.9 crore, the margin 7.7% and profit -16.0% on Rs 119 crore (my calculation). Revenue would read in line, EBITDA in line, the margin in line, and profit in line, though profit would still be below last year.
A strong reading describes the quarter only. It is not a signal to buy, sell or hold, and a weak one is not a signal either. Prices react to many things, including what the market already expected.
The guide to the Thermax Q2 results uses consolidated figures throughout. If a headline quotes standalone profit, compare it with the standalone base and say so when you share the number. Mixing the two is a common error on results day, because the company reports both and they can differ in sign.
What do most people miss on Thermax results day?
- Both quarters are low. Rs 119 crore last September and Rs 21.79 crore in June.
- One project drove Q1. A Rs 91 crore cost estimate rise, not weak demand across the business.
- The year-ago base had a one-off. A Rs 56 crore incentive made the Q1 FY26 profit look larger.
- Order growth includes a reporting change. Rs 139 crore was added by a method change.
- Standalone and consolidated differ in sign. A loss of Rs 18.10 crore against a profit of Rs 21.79 crore.
- The date is unconfirmed. Verify the Thermax Q2 results date before you plan around it.
Analyst’s note: how to think about this quarter
- What stands out (reasoning): the Q1 fall traces to one project estimate, so the Q2 notes on project costs matter more than revenue growth.
- Easy to miss: the order balance rise of 23% partly reflects a forecasting change, not only new wins.
- What would change the view: another project cost revision, or an EBITDA margin below last September’s 6.9%.
- Caution: one quarter does not fix a long-term value. This page gives no target or recommendation.
- Reader action: read the same-basis figures first and match each to the base table.
Bottom line
Known: Thermax is listed for 5 November 2026; the base is about Rs 119 crore consolidated profit on Rs 2,474 crore revenue, and Q1 FY27 profit was Rs 21.79 crore.
Not known yet: the confirmed date, the filing time, the actual figures and any consensus estimate.
Your move: use the decoder table and compare same-basis figures.
Next read: the Q2 results calendar, which lists the companies reporting next.
Part of the earnings coverage.
PositionalCalls WhatsApp channel
Results day, in one WhatsApp channel
- Filing alerts for Thermax and other large companies
- The profit figures explained
- The next company on the results calendar
Thermax Q2 results: frequently asked questions
When are the Thermax Q2 results?
Thermax is listed to report on Thursday, 5 November 2026 in Kotak Neo’s weekly list posted on 30 October, which says dates follow announced board meetings and may change. That is a single, partial-list source. Last year’s Q2 articles were published on 11 November 2025, and the filing time is not announced, so confirm on the BSE or NSE page.
What was Thermax profit in Q2 FY26?
Consolidated net profit was about Rs 119 crore, down about 40% from Rs 198 crore, on revenue of Rs 2,474 crore, down 5% from Rs 2,616 crore, according to Investywise and Whalesbook. Profit before tax was Rs 174 crore against Rs 266 crore.
What did Thermax report in Q1 FY27?
Consolidated net profit was Rs 21.79 crore, down about 85% from Rs 151.45 crore, on operating revenue of Rs 2,303 crore, up 7%, per Free Press Journal and Angel One. A Rs 91 crore rise in the estimated cost to complete one Industrial Infra project drove the fall.
Why was the Thermax Q2 FY26 profit base low?
Revenue fell 5%, and the year-ago quarter had included a Rs 66 crore incentive accrual that lifted its profit. The company also booked Rs 42 crore of extra cost provisions, mainly for one Industrial Infra project, according to Investywise.
Why do Thermax figures differ across sources?
Operating revenue (Rs 2,303 crore) and total income (Rs 2,370.92 crore) both circulate for Q1 FY27, and growth in profit appears as 85% and 85.6%. Standalone and consolidated profit also differ, and the standalone Q1 result was a loss of Rs 18.10 crore. Match each pair to one basis.
Did Thermax miss estimates last November?
Yes. Whalesbook reported a consensus of Rs 201.6 crore profit, Rs 2,841.3 crore revenue and Rs 274.4 crore EBITDA, against actual figures of Rs 119.4 crore, Rs 2,473.9 crore and Rs 171.9 crore. No Q2 FY27 estimate was found for this page.
What does the Thermax order book show?
The order balance was Rs 14,045 crore on 30 June 2026, up 23% from Rs 11,376 crore, and order booking was Rs 2,809 crore, up 2%. A change to a rolling 12-month forecast at one subsidiary added Rs 139 crore to the order balance without changing contracts.
Angel One reported the shares trading at Rs 3,925.50 on 31 July 2026, down 7.67%, after the Q1 FY27 results. After Q2 FY26 results the stock closed at Rs 3,176 on 11 November 2025, up 1.19%, per Whalesbook. Those are reactions to expectations, not forecasts.
Where can I read the Thermax filing?
Use the BSE corporate announcements page or the NSE corporate filings page and search for Thermax. Open the standalone and consolidated results and the press release. Ignore forwarded “result alert” images and messages promising sure-shot calls.
By when must Thermax publish its Q2 results?
SEBI’s listing regulations give listed companies 45 days after quarter-end for quarterly results. For the quarter ended 30 September 2026 that is 14 November 2026 (my calculation).
Sources
- BSE corporate announcements: where the Thermax filing appears.
- NSE corporate filings: financial results: the same filing on NSE.
- Kotak Neo: Q2 results this week, 30 October 2026.
- Free Press Journal: Thermax Q1 FY27 net profit, 30 July 2026.
- Angel One: Thermax shares fall after Q1 FY27, 31 July 2026.
- Investywise: Thermax Q2 FY26 results, 11 November 2025.
- Whalesbook: Thermax Q2 earnings vs estimates, 12 November 2025.
Disclosure: PositionalCalls.com is not a SEBI-registered research analyst or investment adviser. Investments in securities markets are subject to market risks. Read all related documents carefully before investing. Returns are never guaranteed. PositionalCalls is an independent research and education site founded by Shubham Chaudhary. Nothing here is a recommendation, target or investment advice. How I researched this: I checked the results date in one weekly list, took base figures from company results as reported by Free Press Journal, Angel One, Investywise and Whalesbook, noted where sources differ, and marked every derived number as my calculation. Figures are as of Sunday, 1 November 2026, 11:00 PM IST.

Shubham Chaudhary is the founder of PositionalCalls, an independent Indian stock market research website. He writes company fundamentals, quarterly results analysis, IPO analysis and sector research for NSE and BSE listed companies, with a focus on banking stocks, insurance and long-term value investing. Every article is built from primary sources such as RBI, SEBI, NSE and BSE filings and company annual reports, and states its risks plainly in simple language for retail investors.
Coverage areas Our research standards- Numbers checked against NSE, BSE and SEBI filings
- Risks and limits stated in every article
- No paid promotions or broker tie-ups
- Articles updated when new filings arrive