
Earnings · Power
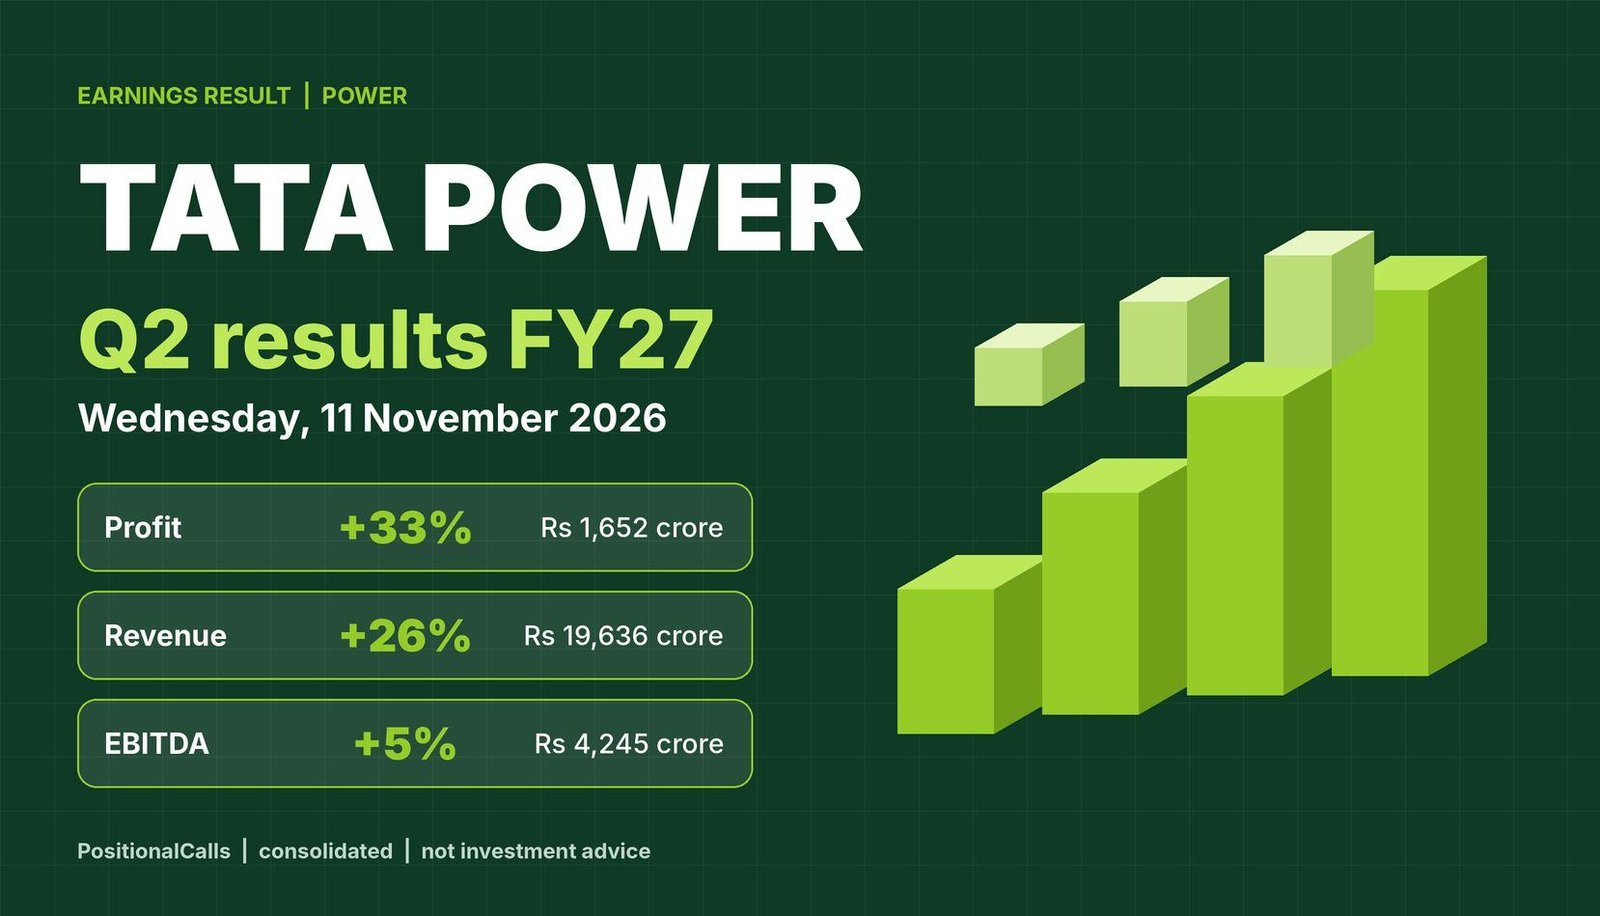
Tata Power Q2 results FY27 are out: profit rose about 33% and revenue 26%, but EBITDA grew only about 5%. Here are the figures, which profit line to use, what ties, what does not, and how the numbers compare with the preview marks.
Results
Profit Rs 1,652.04 crore, revenue Rs 19,635.94 crore, EBITDA Rs 4,245 crore (consolidated).
Preview
The marks set before the results: base, estimates and what to read first.
Quick answer
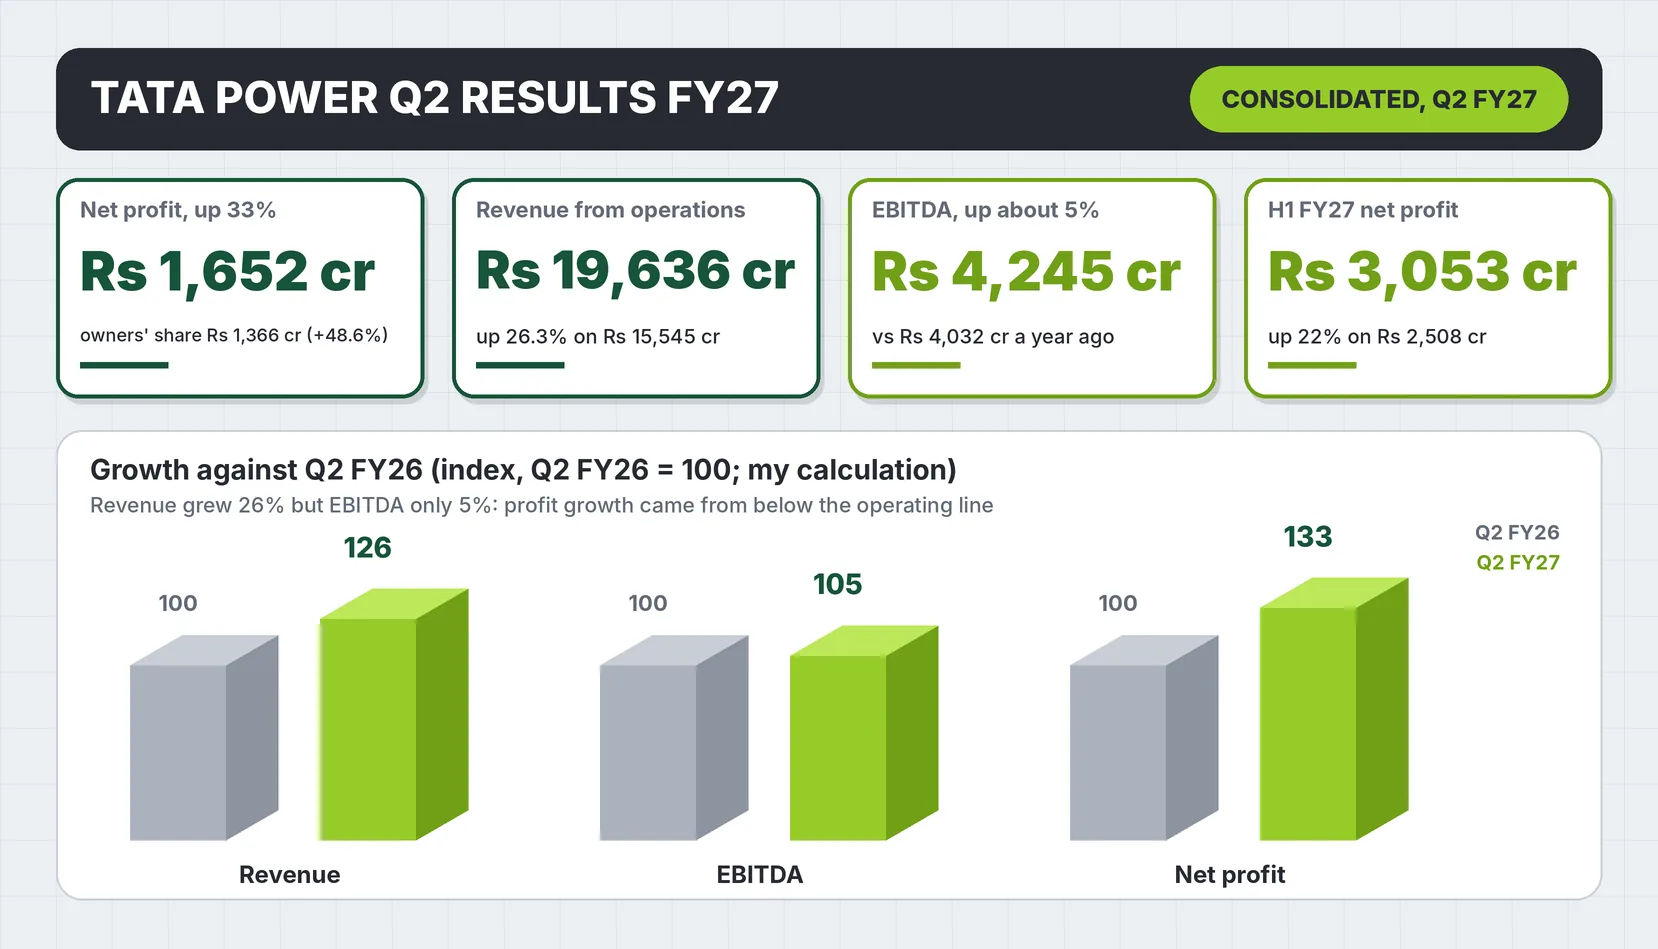
Tata Power Q2 results FY27: Tata Power Company Limited reported consolidated net profit of Rs 1,652.04 crore, up about 33% from Rs 1,245.39 crore, on revenue from operations of Rs 19,635.94 crore, up 26.3%. Profit attributable to owners was Rs 1,366.11 crore. EBITDA was Rs 4,245 crore, up about 5%.
Latest update (Wednesday, 11 November 2026, 7:00 PM IST): The board approved the September-quarter results on 11 November 2026. I found no first-session price reaction, no brokerage reaction and no dividend announcement yet. Those lines will be added as dated updates after the 12 November session.
Key takeaways
- Profit: consolidated net profit Rs 1,652.04 crore (Q2 FY26: Rs 1,245.39 crore, up about 33%, my calculation); owners’ share Rs 1,366.11 crore, up 48.6%.
- Revenue: revenue from operations Rs 19,635.94 crore, up 26.3% on Rs 15,545 crore; one summary shows Rs 19,886 crore on a different basis.
- EBITDA: Rs 4,245 crore, up about 5%; margin on revenue from operations about 21.6% against about 25.9% a year ago (my calculation).
- Half-year: profit Rs 3,052.90 crore, up 22%; EBITDA Rs 8,494 crore, up 7%; record half-year capex of about Rs 10,000 crore.
- Preview marks: every profit mark in the preview was beaten; revenue was 2.6% below one single-source estimate (my calculation).
- Not yet found: the first-session share price reaction, brokerage notes and any dividend.
In plain words: Tata Power makes and sells electricity, runs power distribution in several cities and is building a large renewable energy business. Sales jumped about a quarter but operating profit grew only a twentieth, so most of the profit growth came from below the operating line.
Data note: Figures are as of 11 November 2026, 7:00 PM IST. They follow the Upstox live blog, three Investywise pages that summarise the company’s filing and presentation, Kotak Neo and the preview marks on this site. I could not open the BSE or NSE filing, the press release or the earnings-call transcript, so these are headline-level and different pages use different bases. Derived numbers are my calculation.
In this post
What were the Tata Power Q2 results FY27: profit, revenue and EBITDA?
Tata Power Company Limited reported Q2 FY27 consolidated net profit of Rs 1,652.04 crore against Rs 1,245.39 crore a year earlier, up about 33% (my calculation), on revenue from operations of Rs 19,635.94 crore, up 26.3%. EBITDA was Rs 4,245 crore, up about 5%, per Investywise and the filing figures.
| Consolidated, Rs crore | Q2 FY27 | Q2 FY26 | Change | Source |
|---|---|---|---|---|
| Revenue from operations | 19,635.94 | 15,545 | +26.3% | Investywise (filing); Upstox |
| EBITDA | 4,245 | 4,032 | +5.3% (my calculation) | Investywise (presentation) |
| Profit before tax | 2,179.85 | Not found | – | Investywise (filing) |
| Net profit (total) | 1,652.04 | 1,245.39 | +32.7% (my calculation) | Investywise; preview base |
| Net profit attributable to owners | 1,366.11 | 919.44 | +48.6% | Upstox |
| Net profit before exceptional items | 1,521 | About 1,247 | +22% | Investywise (presentation) |
| Standalone net profit | 703.95 | Not found | – | Investywise (filing) |
Cite this table: Tata Power Q2 results FY27 headline figures, Upstox and Investywise, as of 11 November 2026, 7:00 PM IST. Quarter ended 30 September 2026; board approval 11 November 2026.
The Upstox live blog stamps its profit line at 5:27 PM IST and its revenue line at 5:31 PM on 11 November, which is the nearest thing to a release time I found; I could not open the exchange filing to confirm it. The profit of Rs 1,652.04 crore is about 8.4% of revenue from operations, against about 8.0% a year ago (my calculation), so margins at the bottom line improved even though EBITDA barely moved.
Tata Power Q2 results FY27: the half-year picture
| Consolidated, Rs crore | H1 FY27 | H1 FY26 | Change |
|---|---|---|---|
| Revenue from operations | 38,687.20 | Not found | Presentation page shows 38,784, up 17%, on a different basis |
| EBITDA | 8,494 | About 7,938 (my calculation) | +7% |
| Net profit (total) | 3,052.90 | 2,508 | +21.7% (my calculation) |
| Profit before tax | 3,884.01 or 4,003.19 | Not found | Two pages disagree by Rs 119.18 crore |
| Capital expenditure | About 10,000 | Not found | Described as a record for a half-year |
Cite this table: Tata Power H1 FY27 figures, Investywise, as of 11 November 2026, 7:00 PM IST.
The half-year profit of Rs 3,052.90 crore is up 22% on Rs 2,508 crore. Q2 contributed Rs 1,652.04 crore of it, so the first quarter was about Rs 1,401 crore, which is the figure the company reported in July (preview base). The two add to Rs 3,053.04 crore, within Rs 0.14 crore of the half-year figure (my calculation).
Tata Power Q2 results FY27: how the quarter compares with Q1 FY27
| Consolidated, Rs crore | Q2 FY27 | Q1 FY27 | Change |
|---|---|---|---|
| Revenue from operations | 19,635.94 | 19,051.26 | +3.1% (my calculation) |
| EBITDA | 4,245 | 4,249 | -0.1% (my calculation) |
| Net profit (total) | 1,652.04 | 1,401 | +17.9% (my calculation) |
| Net profit attributable to owners | 1,366.11 | 1,175.93 | +16.2% (my calculation) |
Cite this table: Tata Power sequential comparison, Q1 FY27 from the company’s July release as recorded in the preview, Q2 from Investywise and Upstox, as of 11 November 2026, 7:00 PM IST.
The sequential view is less flattering to the operating line. Revenue was only 3.1% higher than in the June quarter and EBITDA was flat, yet profit rose about 18%. That is the same signal as the year-on-year view: the gain came from items below EBITDA, such as lower finance costs, exceptional items and a smaller minority share, not from stronger operating earnings.
Which Tata Power Q2 results FY27 profit line should I use: Rs 1,652 crore or Rs 1,366 crore?
Use consolidated net profit of Rs 1,652.04 crore for the company’s total profit, and Rs 1,366.11 crore for what belongs to Tata Power’s own shareholders. The gap of Rs 285.93 crore is profit attributable to minority holders in subsidiaries and joint ventures (my calculation).
Two profit lines circulate for the same quarter. They are both right but measure different things, and the year-ago base differs in the same way: Rs 1,245.39 crore in total and Rs 919.44 crore for owners. Comparing a total with an owners’ base, or the reverse, is the commonest mistake in these headlines.
| Profit line | Q2 FY27 | Q2 FY26 | Growth | Use it for |
|---|---|---|---|---|
| Consolidated net profit (total) | Rs 1,652.04 crore | Rs 1,245.39 crore | +32.7% | The business as a whole |
| Attributable to owners | Rs 1,366.11 crore | Rs 919.44 crore | +48.6% | Earnings per share and valuation ratios |
| Minority share (my calculation) | Rs 285.93 crore | About Rs 326 crore | Down | What belongs to partners in subsidiaries |
| Before exceptional items | Rs 1,521 crore | About Rs 1,247 crore | +22% | The cleaner trading trend |
| Standalone | Rs 703.95 crore | Not found | – | The parent company alone |
Cite this table: Tata Power profit lines for Q2 FY27, Upstox and Investywise; minority share and base are my calculation, as of 11 November 2026, 7:00 PM IST.
The faster growth in the owners’ line comes from the minority share shrinking from about Rs 326 crore to about Rs 286 crore while the total rose (my calculation from the preview base and the reported figures). Exceptional items added about Rs 131 crore after tax to Q2 FY27 profit, the gap between Rs 1,652.04 crore and Rs 1,521 crore (my calculation). The filing note will say what they were; I could not open it.
How to quote the Tata Power Q2 results FY27 profit correctly
- For the company: say consolidated net profit of Rs 1,652.04 crore, up about 33% on Rs 1,245.39 crore.
- For shareholders: say profit attributable to owners of Rs 1,366.11 crore, up 48.6% on Rs 919.44 crore.
- For trend: say net profit before exceptional items of Rs 1,521 crore, up 22%.
- Never mix: a total against an owners’ base gives a growth rate of about 80%, which is wrong (my calculation: 1,652.04 / 919.44 – 1).
Tata Power Q2 results FY27: profit before tax and the tax step
Profit before tax was Rs 2,179.85 crore, so the tax and related charge took about 24.2% of it, leaving Rs 1,652.04 crore (my calculation). The same ratio is not available for the year-ago quarter in the pages I opened. The headline on one Investywise page, Rs 2,060.67 crore, matches none of these lines and the page does not explain it.
How did the Tata Power EBITDA margin move in Q2 FY27?
EBITDA grew about 5% to Rs 4,245 crore while revenue grew 26%, so the EBITDA margin on revenue from operations fell to about 21.6% from about 25.9% a year ago (my calculation). Profit growth therefore came from below the operating line.
| Item | Q2 FY27 | Q2 FY26 | Reading |
|---|---|---|---|
| Revenue from operations, Rs crore | 19,635.94 | 15,545 | +26.3% |
| EBITDA, Rs crore | 4,245 | 4,032 | +5.3% |
| EBITDA margin on revenue from operations | 21.6% | 25.9% | Down about 4.3 points (my calculation) |
| Profit before tax, Rs crore | 2,179.85 | Not found | – |
| Net profit, Rs crore | 1,652.04 | 1,245.39 | +32.7% |
| Net profit as % of revenue | 8.4% | 8.0% | Up about 0.4 points (my calculation) |
Cite this table: Tata Power EBITDA and margin, Investywise and Upstox; margins are my calculation, as of 11 November 2026, 7:00 PM IST. Margin basis may differ from the company’s own.
A revenue base can inflate a margin comparison if one figure includes other income. The presentation summary shows revenue of Rs 19,886 crore against Rs 15,769 crore, and on that basis the margin would be about 21.3% against about 25.6%; the conclusion does not change. The cost lines behind this, such as fuel, power purchase and depreciation, are in the filing, which I did not open, so I do not try to tie EBITDA from cost lines here.
What if EBITDA had grown with revenue?
| Scenario | EBITDA, Rs crore | Versus reported 4,245 |
|---|---|---|
| Reported Q2 FY27 | 4,245 | – |
| Year-ago EBITDA grown at the revenue rate of 26.3% | About 5,093 | Higher by about 848 (my calculation) |
| Year-ago EBITDA grown at 5.3% (reported) | 4,245 | Same |
Cite this table: Tata Power EBITDA illustration, my calculation: 4,032 x (19,635.94 / 15,545). Not a forecast.
Had EBITDA kept pace with revenue, it would have been about Rs 5,093 crore, roughly Rs 848 crore more than reported (my calculation). The reasons are in the cost lines of the filing. A mix shift towards lower-margin businesses is one candidate and fuel or purchase costs another, but I do not assert either without the filing.
Tata Power Q2 results FY27: the EBITDA tie-out
The half-year EBITDA of Rs 8,494 crore less Q2’s Rs 4,245 crore leaves Rs 4,249 crore for Q1, exactly the Q1 FY27 figure one source reported in July and not the Rs 4,013 crore another source showed (my calculation). That resolves the first-quarter conflict recorded in the preview: Rs 4,249 crore is the figure that ties. It also means Q2 EBITDA of Rs 4,245 crore was essentially flat on Q1.
What drove the Tata Power Q2 results FY27: segments and renewables?
Two clusters drove profit. Generation and Coal delivered profit after tax of Rs 555 crore and the Renewables cluster Rs 618 crore before exceptional items, up 21%. Together they account for Rs 1,173 crore of the Rs 1,652 crore consolidated profit (my calculation).
| Cluster | Q2 FY27 profit, Rs crore | Note | Source |
|---|---|---|---|
| Generation and Coal | 555 | Described as rising significantly | Investywise (presentation) |
| Renewables (before exceptional items) | 618 | Up 21%; RE generation companies and rooftop | Investywise (presentation) |
| Sum of the two (my calculation) | 1,173 | About 71% of consolidated profit of 1,652.04 | My calculation |
| Other businesses and eliminations | About 479 | Residual (my calculation); includes transmission, distribution and exceptionals | My calculation |
Cite this table: Tata Power cluster profits, Investywise, as of 11 November 2026, 7:00 PM IST. Cluster profits are not on the same basis as consolidated net profit, so the residual is indicative only.
The presentation summary names Mundra, solar manufacturing, Mumbai transmission and the Odisha distribution companies as growth drivers but gives no figures for them. I have not guessed any.
Renewable execution in the quarter
Tata Power Renewable Energy executed 419 MW of utility-scale projects in Q2 against 182 MW a year earlier, up about 130%, plus 131.2 MWh of battery storage (Kotak Neo, 12 October 2026). The operating utility-scale renewable portfolio stood at 7.2 GW, with about 9.3 GW expected to be executed by the end of FY27 and about 12 GW including the FY28 projects.
PositionalCalls WhatsApp channel
Tata Power results, then the next power filing
- The filing and the margin check as soon as they appear
- Profit-line explanations in plain words
- Links to every updated Q2 FY27 page
| Renewables metric | Figure | Source and date |
|---|---|---|
| Utility-scale execution, Q2 FY27 | 419 MW (vs 182 MW) | Kotak Neo, 12 Oct 2026 |
| Battery storage executed | 131.2 MWh | Kotak Neo, 12 Oct 2026 |
| Operating utility-scale portfolio | 7.2 GW | Kotak Neo |
| Expected executed by end-FY27 | About 9.3 GW | Kotak Neo |
| H2 FY27 pipeline | Over 2 GW: 1,075 MW solar, 969 MW wind, 274 MWh storage | Kotak Neo |
| Rooftop solar installations, Q2 | 88,397 (+33%); 426 MWp (+15%) | Kotak Neo |
Cite this table: Tata Power renewables operating update, Kotak Neo (12 October 2026), as of 11 November 2026, 7:00 PM IST.
What to read next in the filing
- Open the consolidated statement on BSE or NSE and note revenue from operations and other income separately.
- Read the exceptional-items note to see what produced the roughly Rs 131 crore after-tax difference.
- Check the segment note for the generation, renewables, transmission and distribution split.
- Look at finance costs, which sit between EBITDA and profit before tax and may explain part of the gap.
- Read the earnings-call transcript for margin and capex comments when it is published.
The capex line shows the other side: about Rs 10,000 crore was spent in the half-year, described as a record. Building capacity ahead of earnings is why profit before tax and EBITDA can diverge from the rate of growth in assets.
The standalone view
Standalone net profit, which covers the parent company alone, was Rs 703.95 crore in Q2 and Rs 981.32 crore for the half-year, so the first quarter was about Rs 277.37 crore (my calculation). Q2 standalone profit is therefore about 2.5 times Q1 and about 42.6% of consolidated profit (my calculation). A jump of that size in a parent company usually has a specific cause, such as income from group companies or a one-off item. I could not open the filing note, so I do not name one.
| Standalone, Rs crore | Figure | Basis |
|---|---|---|
| Q2 FY27 net profit | 703.95 | Investywise (filing) |
| Q2 FY27 profit before tax | 930.19 | Investywise (filing) |
| H1 FY27 net profit | 981.32 | Investywise (filing) |
| Q1 FY27 net profit | 277.37 | My calculation: 981.32 – 703.95 |
| Q2 as share of consolidated profit | 42.6% | My calculation: 703.95 / 1,652.04 |
Cite this table: Tata Power standalone figures, Investywise; derived lines are my calculation, as of 11 November 2026, 7:00 PM IST.
How do the Tata Power Q2 results FY27 compare with the preview marks?
Every profit mark set in the preview was exceeded, while revenue was below the one sales estimate found. The table grades each mark against what was reported; estimates are single-source, not a consensus.
The preview, Tata Power Q2 results date FY27, set marks from the year-ago quarter, the previous quarter and two single-source estimates. This table closes each one. Triggered means the preview condition was met.
| Preview mark | What the preview said | What was reported | Reading |
|---|---|---|---|
| Year-ago total profit | Rs 1,245.39 crore | Rs 1,652.04 crore | Triggered: +32.7% (my calculation) |
| Year-ago owners’ profit | Rs 919 crore | Rs 1,366.11 crore | Triggered: +48.6% |
| Q1 FY27 total profit | Rs 1,401 crore | Rs 1,652.04 crore | Triggered: +17.9% (my calculation) |
| Q1 FY27 owners’ profit | Rs 1,175.93 crore | Rs 1,366.11 crore | Triggered: +16.2% (my calculation) |
| Q1 FY27 EBITDA | Rs 4,249 crore or Rs 4,013 crore (conflict) | Rs 4,245 crore | Flat on 4,249; the tie-out favours 4,249 |
| JM Financial profit (single source) | Rs 1,305 crore | Owners’ Rs 1,366.11 crore | Above by 4.7%; basis of the estimate unclear |
| JM Financial sales (single source) | Rs 20,167 crore | Rs 19,635.94 crore | Below by 2.6% (my calculation); 1.4% below on Rs 19,886 crore |
| Zee Business headline profit | Rs 1,263 crore, up 37% | Owners’ Rs 1,366.11 crore | Above by 8.2% (my calculation); page not opened |
Cite this table: Tata Power Q2 results FY27 against the preview marks, PositionalCalls, as of 11 November 2026, 7:00 PM IST. Estimates are single-source.
The comparison shows where the quarter was strong and where it was not. Profit beat every mark, but revenue fell short of the one sales figure and EBITDA did not move. That pattern fits what the segment data suggests: profit came from the renewable and generation clusters and from lower minority leakage, not from operating margin.
I found no post-results price move and no brokerage reaction yet, because the results came after market hours on 11 November. Before the announcement the shares were about Rs 364.70 at 10:40 AM, up 1.31%, and settled flat in the afternoon, per Upstox.
| Item | Figure | Source and time | Status |
|---|---|---|---|
| Price, 10:40 AM, 11 Nov 2026 | Rs 364.70 (+1.31%) | Upstox live blog | Before results |
| Implied previous close | About Rs 360 | My calculation: 364.70 / 1.0131 | Not an official close |
| Price, 3:47 PM, 11 Nov 2026 | Settled flat | Upstox live blog | Before results |
| Price, 12 Oct 2026, 12:05 PM | Rs 341.65 (-0.15%) | Kotak Neo | Context |
| First post-results session | Not yet available | 12 Nov 2026 | Pending |
| Brokerage reactions | Not yet found | – | Pending |
Cite this table: Tata Power price and brokerage status, Upstox and Kotak Neo, as of 11 November 2026, 7:00 PM IST. I do not guess a close.
What to watch in the first session
Three reference points will matter when the market opens on 12 November: the previous close of about Rs 360, the Rs 364.70 level seen at 10:40 AM before the results, and the Rs 341.65 level from 12 October. They are reference levels, not targets. The more useful comparison is how the move on 12 November sits against the index and against other power stocks, because a stock can fall on a good result when the market falls more.
When the 12 November session closes I will add the reaction here with time and source, and any brokerage notes with broker, rating, target and date, flagged single-source when there is one. Until then nothing on this page is a price view, and PositionalCalls gives no buy, sell or hold view.
What is the Tata Power outlook after the Q2 results FY27, and is there a dividend?
I found no dividend announcement with the Q2 results and no earnings-call transcript yet. The visible outlook items are the renewable pipeline of over 2 GW for the second half and capex running at a record pace, both reported before the results.
- Pipeline: over 2 GW of renewable projects are slated for H2 FY27 (1,075 MW solar, 969 MW wind and 274 MWh of storage), per Kotak Neo.
- Capital spending: about Rs 10,000 crore in the half-year, a record, per Investywise.
- Dividend: no declaration found in the pages I opened; the filing will say if the board recommended one.
- Commentary: I could not open the earnings-call transcript, so no management guidance on margins is quoted.
Questions the quarter leaves open
- Why did EBITDA grow about 5% when revenue grew 26%?
- What were the exceptional items that added about Rs 131 crore after tax?
- How much of the owners’ profit growth came from the smaller minority share?
- Will the board recommend a dividend, and when would the record date be?
For how any dividend would be taxed in your hands, see dividend tax in India. For power peers reporting in the same window, see Adani Power Q2 results FY27 and NHPC Q2 results FY27.
What ties and what does not in the Tata Power Q2 results FY27 figures?
Revenue, EBITDA and profit tie between the quarter, the first quarter and the half-year. Three items do not tie: the revenue basis, the half-year profit before tax and an unexplained headline profit.
| Check | Calculation | Result |
|---|---|---|
| H1 revenue = Q1 + Q2 | 19,051.26 + 19,635.94 = 38,687.20 | Ties exactly (my calculation) |
| H1 EBITDA = Q1 + Q2 | 4,249 + 4,245 = 8,494 | Ties exactly |
| H1 profit = Q1 + Q2 | 1,401 + 1,652.04 = 3,053.04 vs 3,052.90 | Ties within Rs 0.14 crore |
| Standalone H1 minus Q2 | 981.32 – 703.95 = 277.37 | Implies Q1 standalone profit of Rs 277.37 crore |
| Revenue basis | 19,635.94 vs 19,886 (gap 250.06); base 15,545 vs 15,769 (gap 224) | Does not tie: likely other income (my reading) |
| H1 profit before tax | 3,884.01 vs 4,003.19 | Does not tie: gap Rs 119.18 crore |
| Headline profit | Rs 2,060.67 crore on one page | Does not tie: no matching line |
Cite this table: Tata Power tie-out checks, my calculation from Investywise and Upstox figures, as of 11 November 2026, 7:00 PM IST.
None of these changes the direction of the quarter. They do change the percentages you quote, so state which line and which basis you used.
What are the risks and what is easy to miss in the Tata Power Q2 results FY27?
The easy-to-miss point is that revenue rose 26% but EBITDA only 5%, so profit growth relied on items below the operating line. The risks are margin pressure, heavy capex and basis confusion between the profit lines.
Analyst’s note. What stands out: profit beat every preview mark while EBITDA was flat on Q1 and up only 5% on the year. What is easy to miss: the minority share fell, which lifts the owners’ line faster than the total. What would change the reading: the filing note on exceptional items or an earnings-call comment on margins. Caution: I could not open the filing or the call transcript. Reader action: quote the profit label, check the basis and wait for the reaction before drawing conclusions.
Bottom line
Tata Power Q2 results FY27 show consolidated profit of Rs 1,652.04 crore, revenue of Rs 19,635.94 crore and EBITDA of Rs 4,245 crore. The strength is below the operating line; the open items are the share-price reaction, brokerage notes and any dividend. Read the pre-result marks in Tata Power Q2 results date FY27.
PositionalCalls WhatsApp channel
Never miss a Q2 results update
- Dates and times when companies confirm them
- Results explained without tips or targets
- Updated posts as they go live
Tata Power Q2 results FY27: frequently asked questions
What were the Tata Power Q2 results FY27?
Tata Power Q2 results FY27 show consolidated net profit of Rs 1,652.04 crore, up about 33% from Rs 1,245.39 crore, on revenue from operations of Rs 19,635.94 crore, up 26.3%. EBITDA was Rs 4,245 crore, up about 5%. The board approved the results on 11 November 2026 (Investywise, Upstox).
Why are there two Tata Power Q2 profit figures, Rs 1,652 crore and Rs 1,366 crore?
Rs 1,652.04 crore is consolidated net profit including minority holders’ share. Rs 1,366.11 crore is the part attributable to Tata Power’s owners (Upstox). The gap of about Rs 285.93 crore is the minority share (my calculation). The year-ago bases differ the same way: Rs 1,245.39 crore and Rs 919.44 crore.
How much did Tata Power revenue grow in Q2 FY27?
Revenue from operations was Rs 19,635.94 crore against Rs 15,545 crore, up 26.3% (Investywise, Upstox). A presentation summary shows Rs 19,886 crore against Rs 15,769 crore, also about 26%. The Rs 250.06 crore gap between the two reads as other income (my reading, unconfirmed).
What was Tata Power’s EBITDA and margin in Q2 FY27?
EBITDA was Rs 4,245 crore, up about 5.3% from Rs 4,032 crore. On revenue from operations that is a margin of about 21.6% against about 25.9% a year ago, a fall of about 4.3 points (my calculation). Revenue grew far faster than EBITDA, so margins narrowed.
Did Tata Power beat estimates in Q2 FY27?
On the Tata Power Q2 results FY27, profit beat all of the preview marks. Owners’ profit of Rs 1,366.11 crore was about 4.7% above one JM Financial estimate of Rs 1,305 crore, while revenue of Rs 19,635.94 crore was about 2.6% below its Rs 20,167 crore (my calculation). Both are single-source estimates, not a consensus.
What was the half-year profit in the Tata Power Q2 results FY27?
Tata Power’s H1 FY27 consolidated net profit was Rs 3,052.90 crore, up 22% from Rs 2,508 crore. Half-year EBITDA was Rs 8,494 crore, up 7%, and capital expenditure was about Rs 10,000 crore, described as a record. Revenue from operations was Rs 38,687.20 crore (Investywise).
How did the Tata Power renewable business perform in Q2 FY27?
The renewable cluster earned profit before exceptional items of Rs 618 crore, up 21%, per Investywise. Tata Power Renewable Energy executed 419 MW of utility-scale projects against 182 MW a year ago, plus 131.2 MWh of battery storage, per Kotak Neo (12 October 2026).
After the Tata Power Q2 results FY27, I found no price move yet because the results came after market hours on 11 November. Before the announcement the shares settled flat, having been up 1.31% at Rs 364.70 at 10:40 AM (Upstox). The first post-results session is 12 November; this page will add it with time and source.
Did Tata Power declare a dividend with Q2 FY27 results?
I found no dividend announcement in the pages I opened, and I could not open the filing itself. Dividends are a board decision, so check the BSE or NSE filing for any recommendation. For how a dividend is taxed, see our dividend tax in India guide.
No. This Tata Power Q2 results FY27 summary is not a recommendation, and PositionalCalls is not SEBI-registered. It gives no buy, sell or hold view or price target. Broker targets appear only as reported, with source and date. Read the filing and consult a registered adviser before investing.
Sources
- BSE corporate announcements: where the Tata Power filing appears.
- NSE corporate filings: financial results: the same filing on NSE.
- Upstox: Q2 results live updates, 11 November 2026 (consolidated revenue, owners’ profit, price).
- Investywise: Tata Power financial results presentation Q2 FY27 (EBITDA, segments, H1).
- Investywise: Tata Power board approves unaudited results (revenue from operations, profit before tax, H1).
- Investywise: Tata Power board meeting outcome (consolidated and standalone profit).
- Kotak Neo: Tata Power Q2 FY27 renewable project execution, 12 October 2026.
- Zee Business: Tata Power Q2 results preview (headline only).
- Also named, not linked: JM Financial as quoted by Business Today.
Disclosure: PositionalCalls.com is not a SEBI-registered research analyst or investment adviser. Investments in securities markets are subject to market risks. Read all related documents carefully before investing. Returns are never guaranteed. PositionalCalls is an independent research and education site founded by Shubham Chaudhary. Nothing here is a recommendation, target or investment advice. How I researched this: for the Tata Power Q2 results FY27 I read the Upstox live blog, three Investywise pages summarising the filing and presentation, Kotak Neo and the preview marks on this site, noted where sources differ, and marked every derived number as my calculation. I did not open the BSE or NSE filing, the press release or the call transcript. Figures are as of 11 November 2026, 7:00 PM IST.

Shubham Chaudhary is the founder of PositionalCalls, an independent Indian stock market research website. He writes company fundamentals, quarterly results analysis, IPO analysis and sector research for NSE and BSE listed companies, with a focus on banking stocks, insurance and long-term value investing. Every article is built from primary sources such as RBI, SEBI, NSE and BSE filings and company annual reports, and states its risks plainly in simple language for retail investors.
Coverage areas Our research standards- Numbers checked against NSE, BSE and SEBI filings
- Risks and limits stated in every article
- No paid promotions or broker tie-ups
- Articles updated when new filings arrive