
Earnings · Consumer internet · Nykaa
Nykaa reported a threefold rise in September-quarter profit. This page separates what came from operations, what came from tax, what the cash flow shows and what the shares and brokerages did.
Quick answer
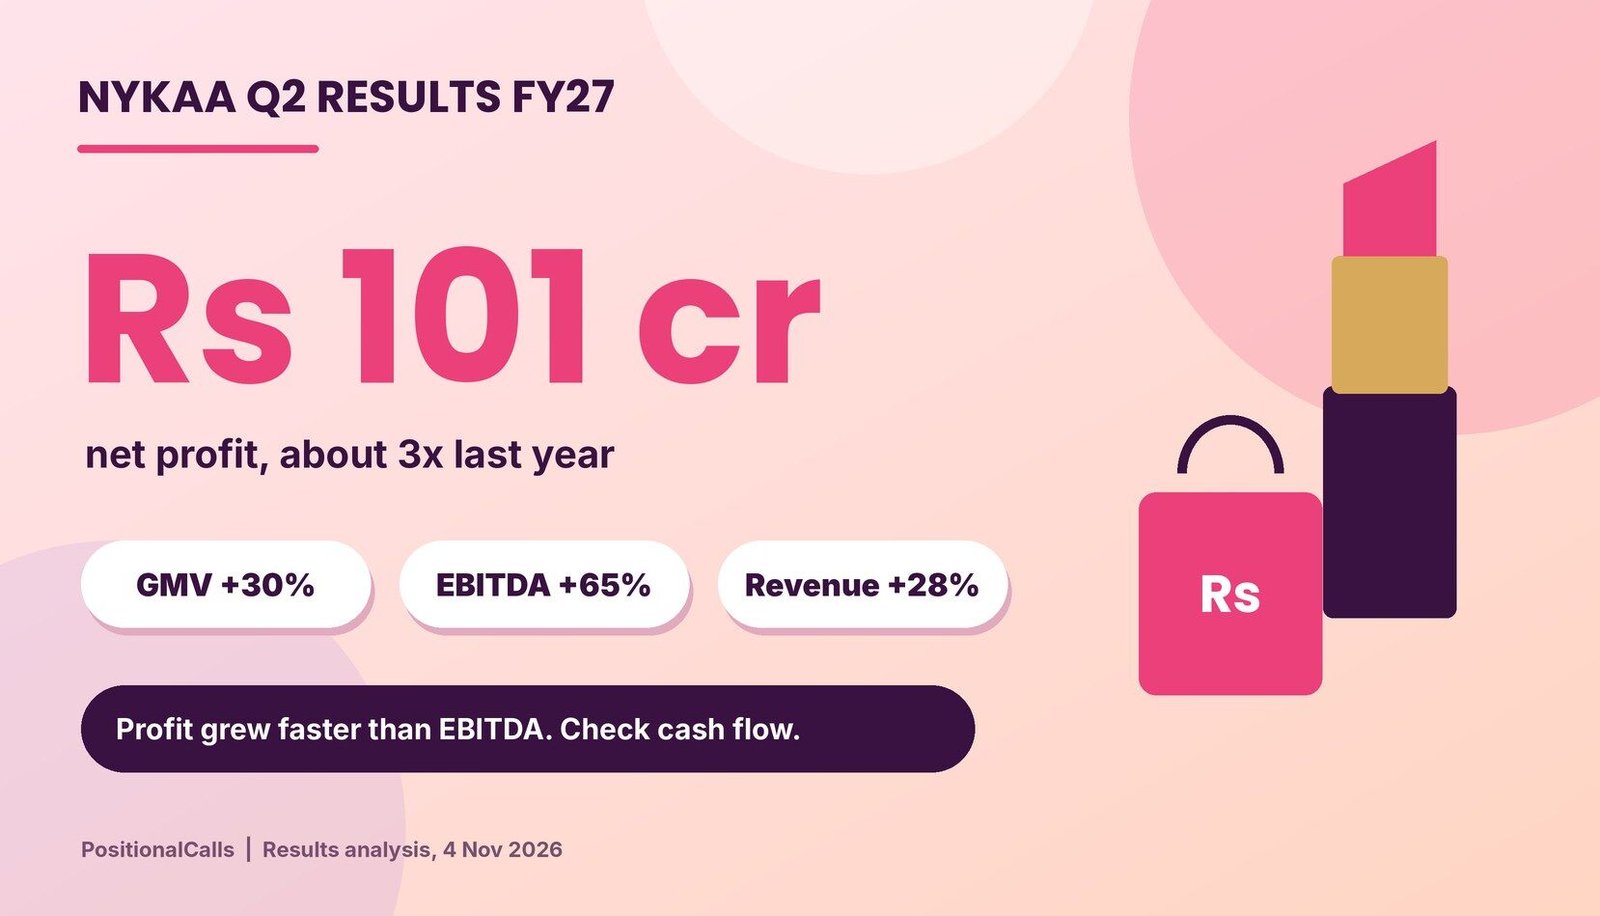
Nykaa Q2 results FY27 were announced after market hours on Wednesday, 4 November 2026: net profit was Rs 101.19 crore, about 207% above Rs 32.98 crore, on revenue of Rs 3,006 crore (+28%). EBITDA rose 65% to Rs 263 crore and gross merchandise value grew 30% to Rs 6,151 crore.
Latest update (Friday, 6 November 2026, 3:00 AM IST): Nykaa reported on Wednesday, 4 November 2026 after market hours, so the first trading reaction came on Thursday, 5 November. The stock touched about Rs 364 early that day against a close near Rs 355 and later traded near or below the previous close; I could not find the official close. I will add the NSE close, the filing’s PBT and tax lines and any new brokerage notes on Friday, 6 November.
Key takeaways
- Headline: Net profit was Rs 101.19 crore against Rs 32.98 crore (+207%), 26.8% above Q1; revenue was Rs 3,006.04 crore (+28.1%) and GMV Rs 6,151 crore (+30%).
- Margins: EBITDA was Rs 263 crore (+65%) at an 8.7% margin against 6.8%; CLSA says EBITDA beat its estimate by 5% and consensus by 2%.
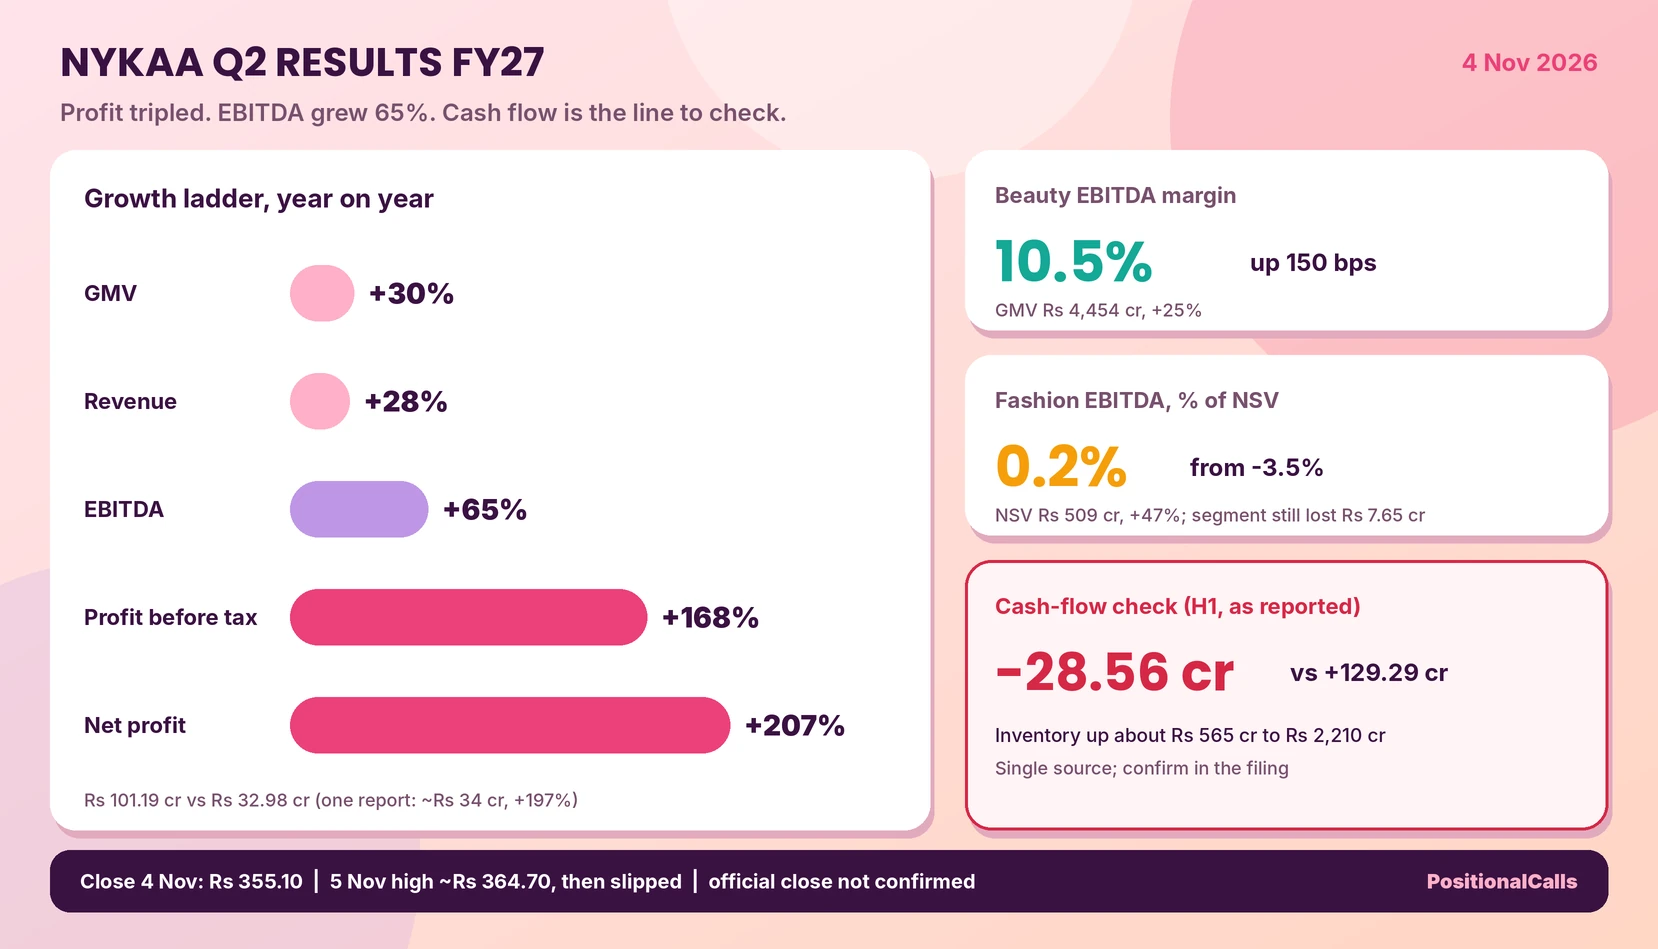
- Segments: Beauty GMV was Rs 4,454 crore (+25%) with a 10.5% EBITDA margin; fashion NSV rose 47% to Rs 509 crore and fashion EBITDA reached 0.2% of sales from -3.5%.
- Cash check: H1 operating cash flow was negative Rs 28.56 crore against positive Rs 129.29 crore, with inventory up about Rs 565 crore to Rs 2,209.66 crore (single source, as reported).
- Share price: After a 4 November close near Rs 355, the stock touched about Rs 364 on 5 November, then slipped; I could not find the official close.
- Brokerages: Reported targets after the result range from Rs 260 (Citi, Sell) to Rs 427 (Nomura, Buy), as published, not my view.
In plain words: Nykaa (company name FSN E-Commerce Ventures) sells beauty and fashion online and in its own stores. GMV is the total value of goods ordered; NSV is net sales value after discounts and taxes. EBITDA is profit before interest, tax, depreciation and amortisation, and PBT is profit before tax. House of Nykaa is the company’s own-brand business.
Data note: as of Friday, 6 November 2026, 3:00 AM IST. Q2 FY27 figures come from press reports of the results and the investor-presentation summaries published on 4 and 5 November 2026; I did not open the exchange filing or the company presentation, so some line items (such as other income and exceptional items) are not shown. Reports differ on the year-ago profit (Rs 32.98 crore or about Rs 34 crore), the 4 November close (Rs 355.10 or Rs 355.50) and the 5 November intraday high (Rs 364.70 or Rs 363.40); each is shown where it appears. Derived numbers are marked “my calculation”.
Nykaa Q2 results FY27: key numbers at a glance
Nykaa Q2 results FY27 show net profit of Rs 101.19 crore against Rs 32.98 crore, revenue of Rs 3,006 crore (+28%), EBITDA of Rs 263 crore (+65%) and GMV of Rs 6,151 crore (+30%).
| Consolidated, Rs crore | Q2 FY27 | Q2 FY26 | Change | Note |
|---|---|---|---|---|
| Revenue from operations | 3,006.04 | 2,345.98 | +28.1% | Q1 FY27: 2,782 (+8.1% QoQ, my calculation) |
| Gross profit | 1,382 | – | +31% | Gross margin 46.0% against 44.9% |
| EBITDA | 263 | about 159 | +65% | Margin 8.7% against 6.8% |
| Profit before tax | 149 | about 56 | +168% | Business Today; not in other reports |
| Net profit | 101.19 | 32.98 | +207% | One report shows about 34 (+198%) |
| GMV | 6,151 | about 4,732 | +30% | Beauty and fashion; see segments |
Cite this table: PositionalCalls, “Nykaa Q2 Results FY27 Key Numbers Table, as of 5 November 2026”.
Net profit of Rs 101.19 crore is 26.8% above Q1 (about Rs 79.81 crore, which also ties to the half-year profit of Rs 181 crore, my calculation) and the first half is already about 89% of FY26’s full-year profit of roughly Rs 204 crore (single source). Revenue crossed Rs 3,000 crore for the first time. Nykaa Q2 results FY27 are for the quarter ended 30 September 2026; confirm the figures in the filing on the BSE or NSE page, and see the Q2 results calendar for other companies.
When were the Nykaa Q2 results FY27 announced?
Nykaa announced its Q2 FY27 results after market hours on Wednesday, 4 November 2026, so the first share-price reaction came on Thursday, 5 November 2026.
Upstox timed its report at 4:53 PM IST on 4 November and Business Today says the results came after market hours, with the stock closing at Rs 355.10 that day. I have not opened the board notice, so confirm the exact time on the exchange page. The deadline for Q2 filings was 14 November 2026.
Nykaa Q2 net profit FY27: how did profit triple?
Nykaa’s net profit rose about 207% because EBITDA grew 65% on revenue growth of 28% and the tax rate fell, so profit before tax rose 168% and net profit rose faster still (my calculation of the tax effect is approximate).
| Step, Rs crore | Q2 FY27 | Q2 FY26 (derived) | Growth | Comment |
|---|---|---|---|---|
| Revenue | 3,006 | 2,346 | +28% | Reported |
| EBITDA | 263 | 159 | +65% | Incremental EBITDA is about 16% of incremental revenue (my calculation) |
| Profit before tax | 149 | 56 | +168% | Single source |
| Net profit | 101.19 | 32.98 | +207% | Reported |
| Implied tax and other deductions | 32% of PBT | 41% of PBT | – | My calculation from rounded figures |
Cite this table: PositionalCalls, “Nykaa Profit Bridge Table, as of 5 November 2026”.
The implied deduction from PBT to net profit fell from about 41% to about 32%. Because PBT is rounded and comes from one report, treat both as approximate; CLSA says it raised its estimates only 1% to 5% because a higher assumed tax rate partly offset better margins, which suggests tax stays a swing factor. So compare EBITDA growth (65%) with profit growth (207%) before calling it operating strength.
The year-ago base also differs by report: Business Standard, Business Today and Equentis use Rs 32.98 crore (+207%), while Upstox prints about Rs 34 crore (+197%). I could not tell whether the base was restated.
How did the Nykaa Q2 results FY27 compare with Q1?
Against Q1 FY27, revenue rose about 8.1% to Rs 3,006 crore and net profit rose 26.8% to Rs 101.19 crore, lifting net margin to about 3.4% from 2.9% (my calculation).
| Rs crore | Q1 FY27 | Q2 FY27 | Change QoQ | Q2 FY26 |
|---|---|---|---|---|
| Revenue from operations | 2,782.00 | 3,006.04 | +8.1% | 2,345.98 |
| Net profit | 79.81 | 101.19 | +26.8% | 32.98 |
| Net margin (profit / revenue) | 2.87% | 3.37% | +0.50 pts | 1.41% |
| Half-year net profit | – | 181 | – | – |
Cite this table: PositionalCalls, “Nykaa Q1 Versus Q2 Table, as of 5 November 2026”.
Q1 profit is derived from the reported half-year figure of Rs 181 crore less Q2, and it matches the 26.8% sequential rise Business Standard prints. The sequential gain came in a quarter in which CLSA says the festive season shifted entirely into Q3, so Q3 carries more seasonal weight. Net margin of about 3.4% is still thin, which is why a one-point change in the tax share moves profit visibly.
Nykaa Q2 EBITDA FY27: why did the margin rise to 8.7%?
Gross margin rose to 46.0% from 44.9%, marketing fell to 15.2% of revenue from 15.7% and employee and other costs fell to 11.9% from 12.8%, lifting the EBITDA margin about 2 points to 8.7%.
| Cost line, share of revenue | Q2 FY27 | Q2 FY26 | Change | Source |
|---|---|---|---|---|
| Gross margin | 46.0% | 44.9% | +1.1 pts | Indian Startup News; 1,382 / 3,006 = 46.0% (my check) |
| Marketing | 15.2% | 15.7% | -0.5 pts | Indian Startup News |
| Employee and other costs | 11.9% | 12.8% | -0.9 pts | Indian Startup News |
| EBITDA margin | 8.75% | 6.75% | +2.0 pts | Upstox; CLSA says +196 bps |
| Beauty EBITDA margin | 10.5% | about 9.0% | +150 bps | CLSA |
| Fashion EBITDA margin (on NSV) | 0.2% | -3.5% | +3.7 pts | Kotak Neo |
Cite this table: PositionalCalls, “Nykaa Margin Table, as of 5 November 2026”.
Management credited efficiency in marketing and overheads; CLSA adds lower customer-acquisition cost. The three cost lines above do not add up to the margin because other costs, such as logistics, are not broken out in the reports, so I do not rebuild the margin from them. CLSA reports EBITDA 5% above its estimate and 2% above consensus, and says PAT beat estimates; I did not find a published consensus table to verify that.
PositionalCalls WhatsApp channel
Nykaa, internet and consumer results on WhatsApp
- Same-day results notes with margins and cash flow checked
- Which base and which profit line each report uses
- Price moves and brokerage views the day they appear
How did beauty and fashion do in the Nykaa Q2 results FY27?
In the Nykaa GMV Q2 FY27 total of Rs 6,151 crore, beauty GMV was Rs 4,454 crore (+25%) with segment profit up about 71%, while fashion GMV rose 42% and the segment reached EBITDA break-even; B2B grew more slowly and the international arm lost money.
| Business | GMV or NSV | Growth | Profitability | Source |
|---|---|---|---|---|
| Beauty | GMV Rs 4,454 cr | GMV +25%; NSV +28% | Segment profit 180.19 vs 105.39 (+71%, my calculation); EBITDA +51% | Indian Startup News; Upstox |
| Fashion | GMV Rs 1,674 cr; NSV Rs 509 cr | GMV +42%; NSV +47%; orders +38% | Segment loss 7.65 vs 21.35; EBITDA 0.2% of NSV | Business Standard; CLSA; Indian Startup News |
| House of Nykaa (own brands) | Run-rate GMV above Rs 4,000 cr | NSV +36% | Own-brand NSV +39% (CLSA, beauty) | Upstox; CLSA |
| Superstore (B2B) | GMV Rs 328 cr | GMV +15%; retailers +27% | Slower growth linked to GST-led price cuts | Indian Startup News |
| International (Nysaa, Gulf) | – | – | Loss of Rs 10.70 cr | Indian Startup News |
Cite this table: PositionalCalls, “Nykaa Business-Wise Table, as of 5 November 2026”.
Beauty GMV plus fashion GMV is Rs 6,128 crore against total GMV of Rs 6,151 crore, so the total appears to track those two (my calculation); the Rs 328 crore B2B figure does not seem to sit inside it, and I could not tie the difference. Fashion is 27% of GMV and still not profitable at the segment line, so the fashion story is narrowing losses, not profit. Nykaa Now (quick commerce) runs in 15 cities with a target of more than 25 by the end of FY27; compare how a larger rival reports in our Eternal Q2 FY27 results. Retail has 338 stores in 111 cities, 14 added in the quarter and 73 in a year.
Is Nykaa’s profit backed by cash? Cash flow and acquisitions
In the Nykaa Q2 results FY27, half-year operating cash flow was negative Rs 28.56 crore against positive Rs 129.29 crore a year earlier, as inventory rose about Rs 565 crore ahead of the festive season; this is from one report and needs the filing.
| Item, Rs crore | Latest | Comparison | Note |
|---|---|---|---|
| Operating cash flow, H1 | -28.56 | +129.29 a year ago | Single source |
| Inventories | 2,209.66 | up about 565 | Ahead of the festive season |
| Short-term borrowings | 972.50 | 728.88 | Increase of 243.62 (my calculation) |
| Simply Nam, 82% stake | up to 33 | Close by 31 December 2026 | Subject to closing conditions |
| Aminu Wellness, 51% stake | 32 | Completed in August | Skincare brand |
Cite this table: PositionalCalls, “Nykaa Cash Flow and Deals Table, as of 5 November 2026”.
A negative operating cash flow with a profit of Rs 181 crore in the half is a mismatch worth reading in the filing: working capital, mainly inventory, appears to absorb the cash. CLSA notes that the festive season shifted entirely into Q3, which affected purchase frequency in the September quarter, so Q3 should show whether that inventory converts into sales. I give no view on the stock.
The Nykaa share price after Q2 results touched about Rs 363 to Rs 365 on 5 November, then slipped into negative territory; I could not find the official close, so no full-day move is claimed.
| Price point | Price (Rs) | Move | Source and caveat |
|---|---|---|---|
| 4 November close (before results) | 355.10 | +0.31% | Business Today; Upstox prints 355.50 (+0.45%) |
| 5 November intraday high | 364.70 | +2.7% (my calculation) | Business Today; Equentis prints 363.40 |
| 5 November, reported price at 12:28 PM | 352.60 | -0.7% (my calculation) | Business Today, time approximate |
| Page ticker at capture | 348.75 | Printed +1.90% | Sign looks wrong against a 355.10 close; no timestamp |
| Market capitalisation | about Rs 1.01 lakh crore | – | Business Today, 4 November |
Cite this table: PositionalCalls, “Nykaa Share Price Reaction Table, as of 5 November 2026”.
The shares opened the first trading day higher and then lost the gain, which is a common pattern when results arrive after the close and the figures are partly expected. Equentis says the stock touched a 52-week high of Rs 363.40 on 5 November before turning negative. I treat all these as intraday prints until I confirm the NSE close. If you act on price, read our capital gains tax on shares guide first.
What do brokerages say after the Nykaa Q2 results FY27?
Brokerage targets reported after the result range from Rs 260 (Citi, Sell) to Rs 427 (Nomura, Buy); five of nine reported ratings are Buy, Outperform or Add, three are Neutral or Hold and one is Sell (my count).
| Brokerage | Rating | Target (Rs) | Note as reported |
|---|---|---|---|
| Nomura | Buy | 427 | Raised from 411 |
| Jefferies | Buy | 415 | Raised from 400; FY28 and FY29 EBITDA estimates up 5% to 6% |
| HSBC | Buy | 410 | – |
| CLSA | Outperform | 409 | Raised from 376; estimates up 1% to 5% |
| Kotak | Add | 385 | – |
| Bank of America | Neutral | 400 | – |
| Motilal Oswal | Neutral | 370 | Valuation cited as a deterrent |
| JPMorgan | Hold | 315 | Predates the Q2 results, per the report |
| Citi | Sell | 260 | Cut from 265 |
Cite this table: PositionalCalls, “Nykaa Brokerage Views Table (as reported), as of 5 November 2026”.
These are views published by third parties and relayed by Equentis and Business Today on 5 November; I did not read the underlying notes and do not endorse any of them. The spread from Rs 260 to Rs 427 shows how differently brokerages value the same quarter. This page gives no price target, rating or buy or sell view of its own.
What to watch in Nykaa Q3 FY27
Q3 is the festive quarter, so watch whether inventory converts to sales and operating cash flow turns positive, whether margins hold, and whether the tax rate and fashion break-even stay stable.
| What to read | Mark from Q2 | Question to ask |
|---|---|---|
| GMV growth | +30% | Does the festive shift lift Q3 beyond 30%? |
| EBITDA margin | 8.7% | Does it hold above last year’s 6.8% on festive discounting? |
| Operating cash flow | -28.56 cr (H1) | Does inventory of Rs 2,210 crore turn into cash? |
| Fashion EBITDA | 0.2% of NSV | Does it turn clearly positive? |
| Nykaa Now | 15 cities, target above 25 | Is the expansion adding losses? |
| Tax rate | About 32% of PBT implied | Is the lower rate sustained? |
| Superstore | GMV +15% | Does GST-related softness normalise as guided? |
Cite this table: PositionalCalls, “Nykaa Q3 FY27 Watch Table, as of 5 November 2026”.
Read these in order: cash flow and inventory first, because they test the quality of the profit; then EBITDA margin against 8.7%; then fashion and quick commerce, which decide whether losses outside beauty keep shrinking. Management has said Superstore growth should normalise after the GST-led price cuts, so a second soft quarter there would be a flag. Check each line against the filing rather than a press summary, and note which profit base a report uses.
What most people miss
Analyst’s note
- What stands out: EBITDA margin up about 2 points to 8.7% with fashion at break-even, helped by lower marketing and overhead ratios.
- Easy to miss: net profit grew about 207% against EBITDA growth of 65%, and half-year operating cash flow was negative.
- What would change the view: a filing note showing a one-off, a tax rate back near 40%, or Q3 cash flow still negative after the festive season.
- Caution: the tax-rate comparison is my arithmetic on rounded figures, and no price target or buy or sell view is given.
- Reader action: read PBT, tax, other income and cash flow in the filing before quoting the 207%.
Bottom line
Nykaa Q2 results FY27 show profit of Rs 101.19 crore (about 3x), EBITDA up 65% to an 8.7% margin and fashion at break-even, but profit grew faster than EBITDA and half-year operating cash flow was negative. Compare EBITDA and cash flow, not only the 207%, and confirm them in the filing.
Next read: the Q2 results calendar.
Part of the Earnings series.
PositionalCalls WhatsApp channel
Never miss a results-day update
- Same-day decoders for the biggest companies reporting
- One-offs separated from the underlying number
- Corrections posted openly when a figure changes
FAQs on Nykaa Q2 results FY27
When were Nykaa Q2 results FY27 announced?
Nykaa announced its Q2 FY27 results after market hours on Wednesday, 4 November 2026 for the quarter ended 30 September 2026. The first trading reaction came on Thursday, 5 November. Confirm the time on the exchange page.
What was Nykaa’s net profit in Q2 FY27?
Net profit was Rs 101.19 crore against Rs 32.98 crore, up about 207%; one report shows a base near Rs 34 crore (+197%). Profit was 26.8% above Q1. Confirm in the filing.
What was Nykaa’s revenue and GMV in Q2 FY27?
Revenue from operations was Rs 3,006.04 crore, up 28.1%, and GMV was Rs 6,151 crore, up 30%. Gross profit was Rs 1,382 crore, a 46.0% gross margin.
What was Nykaa’s EBITDA in Q2 FY27?
EBITDA was Rs 263 crore, up about 65%, with an 8.7% margin against 6.8%. CLSA says it was 5% above its estimate and 2% above consensus.
How did Nykaa’s beauty and fashion businesses perform?
Beauty GMV was Rs 4,454 crore (+25%) with an EBITDA margin of 10.5%. Fashion NSV rose 47% to Rs 509 crore and fashion EBITDA reached 0.2% of NSV from -3.5%, though the segment still lost Rs 7.65 crore.
Is Nykaa’s profit backed by cash flow?
Not yet in the half-year: operating cash flow was negative Rs 28.56 crore against positive Rs 129.29 crore, with inventory up about Rs 565 crore. This is from one report; check the filing.
What acquisitions did Nykaa announce?
Nykaa agreed to buy an 82% stake in Simply Nam for up to Rs 33 crore, expected to close by 31 December 2026, and bought 51% of Aminu Wellness for Rs 32 crore in August.
From a 4 November close near Rs 355, the stock touched about Rs 364 on 5 November and then slipped to near or below that close. I could not find the official close. This is not a price target.
What are the brokerage targets for Nykaa after Q2?
Reported targets range from Rs 260 (Citi, Sell) to Rs 427 (Nomura, Buy), with CLSA at Rs 409. These are third-party views, as reported, and not my view or advice.
Does this page give a Nykaa Q2 results FY27 buy or sell call?
No. This is research and education, not advice. PositionalCalls.com is not a SEBI-registered research analyst or investment adviser. Use the numbers to frame questions and speak to a registered adviser before investing.
Sources
- Business Standard, 4 November 2026 (profit, revenue, EBITDA)
- Business Today, 4 November 2026 (PBT, gross profit, close)
- Upstox, 4 November 2026 (EBITDA, segments, close)
- Kotak Neo, 4 November 2026 (segments, stores)
- Indian Startup News (cost ratios, segment profit, cash flow)
- Business Today, 5 November 2026 (CLSA, price)
- Equentis, 5 November 2026 (brokerage table)
- InvestyWise (investor presentation summary) (not opened)
- BSE and NSE announcement pages: where the filing appears (I did not open it).
PositionalCalls.com is not a SEBI-registered research analyst or investment adviser. Investments in securities markets are subject to market risks. Read all related documents carefully before investing. Returns are never guaranteed. PositionalCalls is an independent Indian stock market research and education site founded by Shubham Chaudhary. This page is education and results analysis, not a recommendation to buy, sell or hold any security. How I researched this: I read press reports of the results and brokerage summaries, tied Q1, Q2 and half-year profit to each other, reconciled the margin and growth figures, recomputed every derived number and listed conflicts openly. I have not opened the exchange filing.

Shubham Chaudhary is the founder of PositionalCalls, an independent Indian stock market research website. He writes company fundamentals, quarterly results analysis, IPO analysis and sector research for NSE and BSE listed companies, with a focus on banking stocks, insurance and long-term value investing. Every article is built from primary sources such as RBI, SEBI, NSE and BSE filings and company annual reports, and states its risks plainly in simple language for retail investors.
Coverage areas Our research standards- Numbers checked against NSE, BSE and SEBI filings
- Risks and limits stated in every article
- No paid promotions or broker tie-ups
- Articles updated when new filings arrive