
Earnings · Consumer retail · Lenskart
Lenskart’s second result since listing doubled profit, but the growth rate depends on which year-ago base and which EBITDA you read. This page reconciles the numbers, shows what changed from Q1 and tracks the stock and brokerage views.
Quick answer
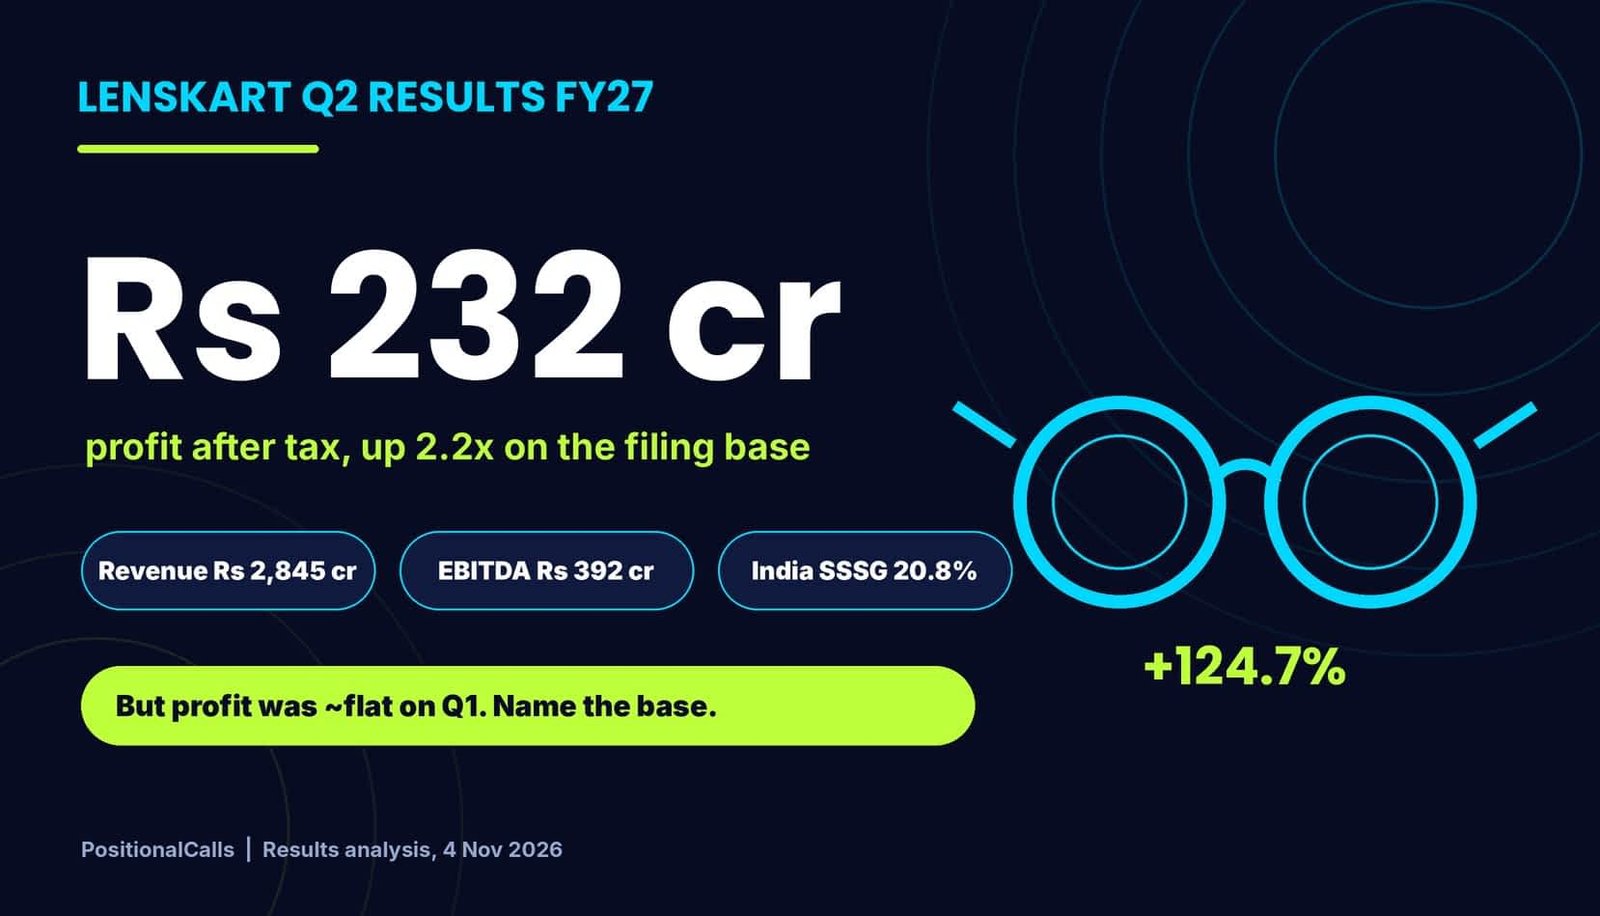
Lenskart Q2 results FY27 were announced on Wednesday, 4 November 2026: profit after tax was Rs 232.45 crore, up 124.7% on the filing base, on revenue of Rs 2,845 crore (+35.7%). Company presentations show +106% and +32.5% on a restated base. EBITDA before Ind AS 116 was Rs 392 crore (+65%).
Latest update (Friday, 6 November 2026, 3:30 AM IST): Lenskart reported on Wednesday, 4 November 2026, and the first trading reaction came on Thursday, 5 November: an opening near Rs 745 to Rs 750 against a close near Rs 690, a record high of Rs 767.40, and about Rs 733 at 11:15 AM. I could not find the NSE close or any later brokerage note. I will add the close and the filing’s tax and minority lines on Friday, 6 November.
Key takeaways
- Headline: Profit after tax was Rs 232.45 crore against Rs 103.45 crore (+124.7%) and revenue Rs 2,845.03 crore against Rs 2,096.14 crore (+35.7%) in the filing figures.
- Three bases: The presentation shows revenue growth of 32.5% (base Rs 2,147 crore) and profit growth of 106% (base about Rs 113 crore), while profit to owners was Rs 227.08 crore (+122.1%).
- EBITDA: EBITDA before Ind AS 116 was Rs 392 crore (+65%, 13.8% margin); on the Ind AS 116 basis it was Rs 624 crore (21.9%), and the two segments tie to both.
- Sequential: Derived from half-year totals, profit rose only about 1.7% on Q1 and international revenue was flat, so India carried the quarter (my calculation).
- Estimates: Against Motilal Oswal’s pre-results estimates, revenue was about 2% higher and EBITDA about level, while profit was about 11% to 13% higher.
- Share price: From a 4 November close near Rs 690, the stock opened near Rs 745 to Rs 750, touched a record Rs 767.40 on 5 November and traded near Rs 733 mid-morning; I could not find the close.
In plain words: Lenskart sells eyeglasses, sunglasses and contact lenses through its own stores and online in India and abroad. EBITDA is operating profit before interest, tax, depreciation and amortisation; “pre-Ind AS 116” means it is shown after deducting store rent, which is the version most retail investors compare. Same-store sales growth measures stores open for a full year. A “base” is the year-ago figure that growth is measured against.
Data note: as of Friday, 6 November 2026, 3:30 AM IST. Figures come from press and data-platform summaries of the BSE filing and the company presentation (Lapaas Voice, InvestyWise, HDFC Sky, Sahi, Inc42, NewsBytes and Trade Brains); I did not open the filing or presentation myself. Reports disagree on the year-ago base (Rs 2,096 or Rs 2,147 crore), profit (Rs 232.45 or Rs 227.08 crore) and EBITDA (Rs 392 or Rs 624 crore); each is shown and explained where it appears. Derived numbers are marked “my calculation”.
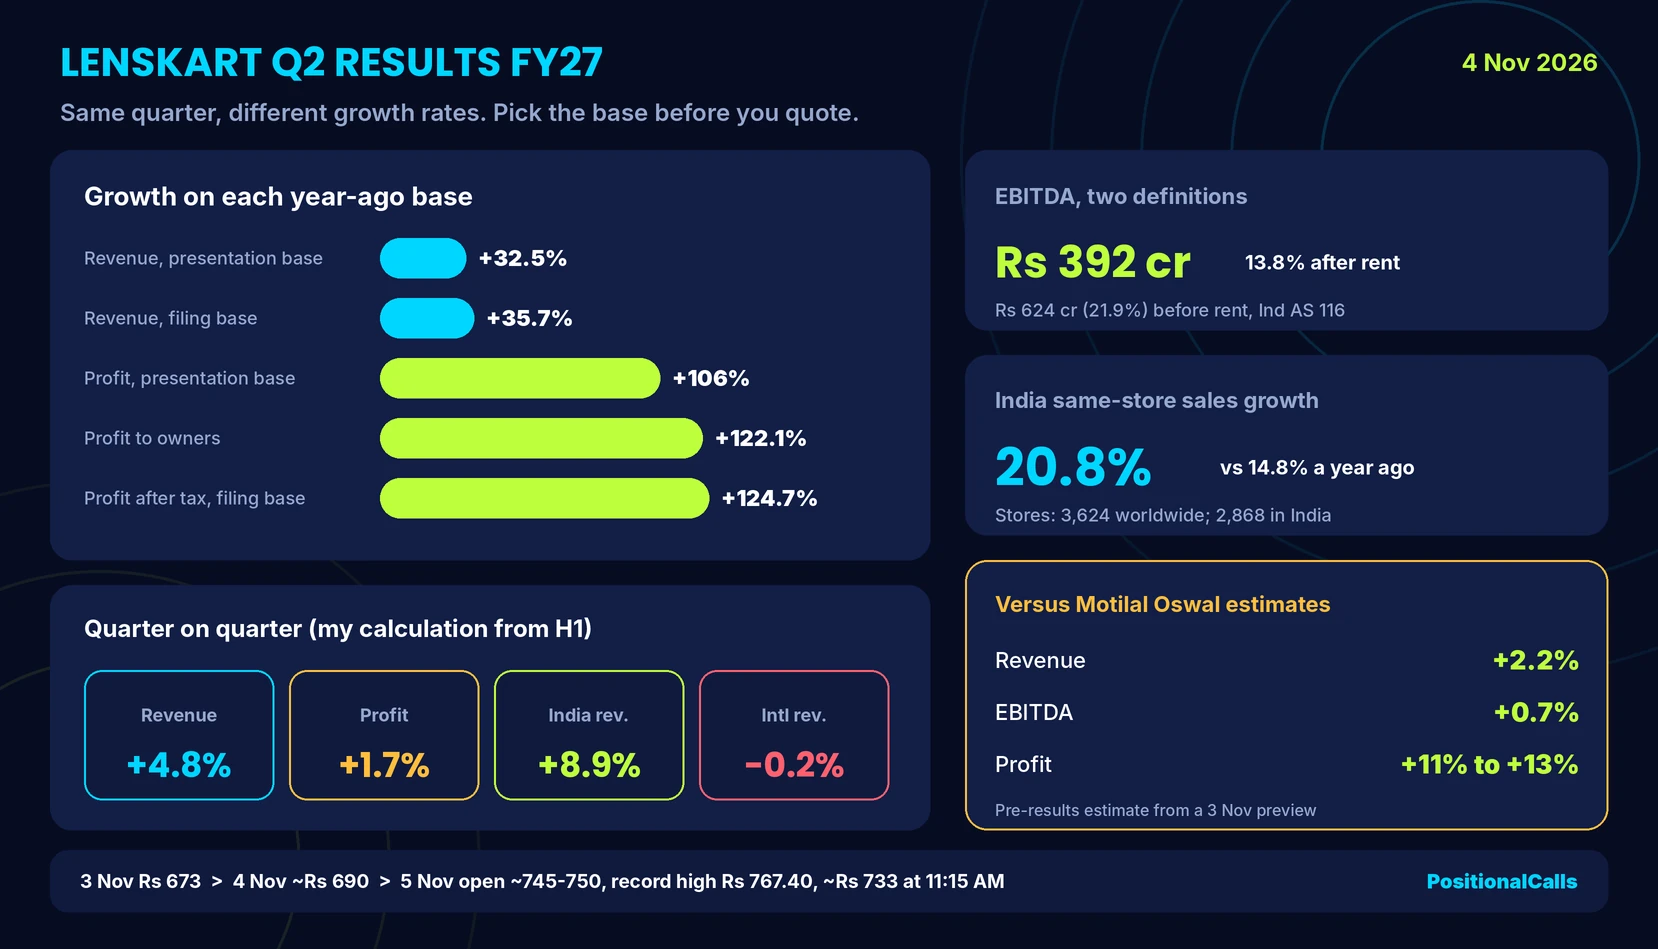
Lenskart Q2 results FY27: key numbers at a glance
Lenskart Q2 results FY27 show revenue of Rs 2,845.03 crore (+35.7% on the filing base), profit after tax of Rs 232.45 crore (+124.7%), EBITDA before Ind AS 116 of Rs 392 crore (+65%) and 3,624 stores worldwide.
| Consolidated, Rs crore | Q2 FY27 | Q2 FY26 | Change | Note |
|---|---|---|---|---|
| Revenue from operations | 2,845.03 | 2,096.14 | +35.7% | Filing base; presentation base 2,147 gives +32.5% |
| Total income | 2,899.49 | 2,129.40 | +36.2% | Other income about 54 (my calculation) |
| Profit before tax | 304.48 | 148.00 | +105.7% | Lapaas Voice |
| Profit after tax | 232.45 | 103.45 | +124.7% | Presentation shows about 113 as base (+106%) |
| Profit to owners | 227.08 | 102.22 | +122.1% | Sahi and NewsBytes |
| Basic EPS (Rs) | 1.31 | 0.61 | +115% | Lapaas Voice |
| EBITDA pre-Ind AS 116 | 392 | 237 | +65% | Margin 13.8% against 11.1% |
Cite this table: PositionalCalls, “Lenskart Q2 Results FY27 Key Numbers Table, as of 5 November 2026”.
Lenskart Q2 results FY27 are for the quarter ended 30 September 2026. Half-year revenue was Rs 5,559 crore (+33.0%) and half-year profit Rs 461 crore, about 2.4 times the Rs 194 crore of H1 FY26 and about 87% of FY26’s full-year profit (single source). Trailing 12-month revenue is above Rs 10,000 crore and profit about Rs 800 crore (approximate). See the Q2 results calendar for other companies reporting this season.
When were the Lenskart Q2 results FY27 announced?
Lenskart announced its Q2 FY27 results on Wednesday, 4 November 2026, and the first trading reaction came on Thursday, 5 November 2026.
Trade Brains dated the results to 4 November in a preview published on 3 November, and the first price reports are all from 5 November. I have not opened the board notice, so confirm the filing time on the BSE or NSE page. The shares were already rising before the result: the previous close of about Rs 690 on 4 November was 2.5% above the Rs 673 close Trade Brains reported on 3 November (my calculation).
Why do the Lenskart Q2 results FY27 read 32.5% growth in one place and 35.7% in another?
Reports use two different year-ago bases: the filing base of Rs 2,096.14 crore revenue and Rs 103.45 crore profit, and a restated presentation base of about Rs 2,147 crore and Rs 113 crore. The same quarter therefore shows revenue growth of 32.5% or 35.7%.
| Measure | Filing base | Presentation base | Growth on each | Other reports |
|---|---|---|---|---|
| Revenue, Q2 FY26 (Rs crore) | 2,096.14 | about 2,147 (2,146.6 per Motilal Oswal) | +35.7% against +32.5% | Lapaas Voice +35.7%; InvestyWise +32.5% |
| Profit after tax (Rs crore) | 103.45 | about 113 | +124.7% against about +106% | InvestyWise +106.1% |
| Profit to owners (Rs crore) | 102.22 | – | +122.1% | Sahi, NewsBytes (Rs 227.08 cr) |
| Adjusted profit (Motilal Oswal) | – | 110.1 | – | Pre-results estimate base |
Cite this table: PositionalCalls, “Lenskart Year-Ago Bases Table, as of 5 November 2026”.
A restated base is common when a company changes its reporting or consolidates a new entity, but I could not confirm the reason here, so treat it as an inference. The two profit figures for Q2 FY27 (Rs 232.45 and Rs 227.08 crore) differ by Rs 5.37 crore, and the year-ago pair differs by Rs 1.23 crore, which looks like the share of minority shareholders; I did not see the statement to confirm. Use profit to owners for per-share work and say which base you compare with. HDFC Sky prints both Rs 227 crore and Rs 232 crore in the same article, which is why a base check matters.
Lenskart Q2 EBITDA FY27: why do reports show Rs 392 crore and Rs 624 crore?
Both are right on different definitions: Rs 392 crore is EBITDA before Ind AS 116 (after store rent), a 13.8% margin, and Rs 624 crore is EBITDA on the Ind AS 116 basis (before rent), a 21.9% margin; the two segments add to both.
| EBITDA, Rs crore | Q2 FY27 | Margin | Growth | Segment check (my calculation) |
|---|---|---|---|---|
| Pre-Ind AS 116 (after rent) | 392 | 13.8% | +65% (base 237) | India 267 + international 127 = 394 |
| Ind AS 116 basis (before rent) | 624 | 21.9% | +46.6% (InvestyWise) | India 362 + international 264 = 626 |
| Ind AS 116, Sahi | 621 | 21.85% | Base 414 (+50%) | Differs from InvestyWise by Rs 3 crore |
Cite this table: PositionalCalls, “Lenskart EBITDA Definitions Table, as of 5 November 2026”.
The Rs 392 crore figure is the one used for margin comparison with a typical retailer, because rent is a real recurring cost; the Rs 624 crore figure excludes about Rs 232 crore of lease costs (my calculation: 624 less 392). The year-ago pre-Ind AS margin of 11.1% uses the Rs 2,147 crore base; on the Rs 2,096 crore base it is about 11.3%, which is why Lapaas Voice notes a small mismatch. Management has described a long-term adjusted EBITDA margin target of around 25% (as reported by NewsBytes), which is a company aim, not a forecast of mine.
India versus international: which business drove the Lenskart Q2 results FY27?
In the Lenskart Q2 results FY27, India revenue rose 35.3% to Rs 1,668 crore, with Lenskart same store sales growth of 20.8%, and international revenue rose 29.5% to Rs 1,201 crore with pre-Ind AS EBITDA up 86.8% to Rs 127 crore, a 10.6% margin against 7.3%.
| Q2 FY27, Rs crore | India | International | Source |
|---|---|---|---|
| Revenue | 1,668 (+35.3%) | 1,201 (+29.5%) | InvestyWise; HDFC Sky |
| EBITDA, Ind AS 116 basis | 362 (+50.5%) | 264 (+45.9%) | InvestyWise |
| EBITDA, pre-Ind AS 116 | 267 (+61.5%) | 127 (+86.8%) | InvestyWise |
| Pre-Ind AS margin (my calculation) | 16.0% | 10.6% | Derived |
| Same-store sales growth | 20.8% (14.8% a year ago) | – | HDFC Sky |
| Net new stores | 143, in 61 new cities | 22 | HDFC Sky; InvestyWise; sum 165 |
Cite this table: PositionalCalls, “Lenskart India and International Table, as of 5 November 2026”.
Segment revenues add to Rs 2,869 crore against consolidated revenue of Rs 2,845 crore (gap Rs 24 crore), and half-year segments add to Rs 5,603 crore against Rs 5,559 crore; the gap may be eliminations between segments, but the reports do not say. Stores stand at 3,624 worldwide, of which 2,868 are in 665 Indian cities, and 934 stores now offer remote optometry against 303 a year ago. Eye tests were about 80 lakh (+40.4%), eyewear units about 1.1 crore (+27.1%), and in-house frame and lens manufacturing grew 71.7% and 52.2%.
PositionalCalls WhatsApp channel
Newly listed companies and big results on WhatsApp
- Same-day results notes with the base and definition named
- Estimates versus actuals where a preview exists
- Price moves and brokerage views the day they appear
Did Lenskart profit grow from Q1? The sequential view
For Lenskart Q2 net profit FY27, derived from half-year totals, Q1 FY27 profit was about Rs 229 crore, so Q2 profit rose only about 1.7% on Q1 while revenue rose about 4.8%; India drove the gain and international revenue was flat (my calculation).
| Rs crore | Q1 FY27 (derived) | Q2 FY27 | Change QoQ | How derived |
|---|---|---|---|---|
| Revenue | 2,713.97 | 2,845.03 | +4.8% | H1 5,559 less Q2 |
| Profit after tax | 228.55 | 232.45 | +1.7% | H1 461 less Q2 |
| EBITDA pre-Ind AS 116 | 361 | 392 | +8.6% | H1 753 less Q2 |
| India revenue | 1,531 | 1,668 | +8.9% | H1 3,199 less Q2 |
| International revenue | 1,203 | 1,201 | -0.2% | H1 2,404 less Q2 |
| India EBITDA pre-Ind AS | 236 | 267 | +13.1% | H1 503 less Q2 |
| International EBITDA pre-Ind AS | 127 | 127 | +0.0% | H1 254 less Q2 |
Cite this table: PositionalCalls, “Lenskart Q1 Versus Q2 Table, as of 5 November 2026”.
These Q1 values are subtractions from rounded half-year figures, so each is approximate and I have not seen the Q1 filing. The pattern is still informative: the headline rise of 124.7% is year on year, but profit has been close to Rs 230 crore for two quarters, and the sequential improvement in EBITDA came from India (about 13%) while international pre-Ind AS EBITDA was level at about Rs 127 crore. Compare quarters before reading the percentage as acceleration.
Did Lenskart beat estimates in Q2 FY27?
Against Motilal Oswal’s pre-results estimates for the Lenskart Q2 results FY27, revenue was about 2.2% higher, EBITDA about 0.7% higher and profit about 11% to 13% higher, depending on the profit line; I did not find a published consensus.
| Rs crore | Motilal Oswal estimate | Reported | Difference (my calculation) |
|---|---|---|---|
| Revenue | 2,784.1 | 2,845.03 | +2.2% |
| EBITDA (Ind AS 116 basis) | 619.9 | 624 (Sahi: 621) | +0.7% |
| Adjusted profit | 204.8 | 227.08 owners; 232.45 total | +10.9% to +13.5% |
Cite this table: PositionalCalls, “Lenskart Estimates Versus Actual Table, as of 5 November 2026”.
The estimate figures come from a Trade Brains preview of Motilal Oswal’s note, published 3 November 2026. Motilal Oswal’s estimate of adjusted profit may exclude items that the reported figure includes, so the profit beat is not a clean like-for-like measure; the revenue and EBITDA comparisons are tighter. Morgan Stanley is reported to have raised its EPS estimates by 22% for FY27, 29% for FY28 and 35% for FY29, as published, not my view.
How good is the profit in the Lenskart Q2 results FY27? Tax, other income and cash flow
Profit before tax rose 105.7% while profit after tax rose 124.7%, because the implied tax share fell to about 24% from 30% (my calculation); H1 operating cash flow was Rs 388 crore.
| Rs crore | Q2 FY27 | Q2 FY26 | Comment |
|---|---|---|---|
| Other income (total income less revenue) | 54.5 | 33.3 | My calculation |
| Profit before tax | 304.48 | 148.00 | +105.7% |
| Implied tax (PBT less PAT) | 72.03 | 44.55 | 23.7% against 30.1% of PBT |
| Share of minority holders (derived) | 5.37 | 1.23 | PAT less owners’ profit |
| H1 operating cash flow | 388 | – | InvestyWise; year-ago not given |
| ROCE, H1 FY27 | 22.5% | 14.6% (FY26) | InvestyWise |
| Product margin | 70.0% | 69.2% | Company figure |
Cite this table: PositionalCalls, “Lenskart Profit Quality Table, as of 5 November 2026”.
Total income less expenses is Rs 302.69 crore, which is Rs 1.79 crore below the reported profit before tax of Rs 304.48 crore, so a small item (such as a share of associates or an exceptional line) sits in between; the reports do not name it. The lower tax share added to profit growth, so pre-tax growth of about 106% is the cleaner operating comparison. Operating cash flow of Rs 388 crore for the half year is positive, which supports the profit. I give no view on the stock.
The Lenskart share price after Q2 results opened near Rs 745 to Rs 750 on 5 November, touched a record Rs 767.40 (+11.1%) and was near Rs 733 at 11:15 AM against a previous close of about Rs 690; I could not find the official close.
| Price point | Price (Rs) | Move | Source and caveat |
|---|---|---|---|
| 3 November close | 673 | – | Trade Brains, 3 November |
| 4 November close (before results) | 689.70 or 691 | +2.5% on 3 Nov (my calculation) | HDFC Sky (NSE) or Inc42 (BSE) |
| 5 November open | 745.05 to 750 | +7.8% (BSE) | Inc42; HDFC Sky |
| 5 November high | 767.40 | +11.1%; all-time high | Inc42 (BSE) |
| 9:40 AM | 732.50 | +6.21% | HDFC Sky |
| 11:15 AM | 733.55 | +6.2% | Inc42; market cap about Rs 1.28 lakh crore |
| Page sidebar, no time | 721.10 | +4.55% | HDFC Sky, likely a later snapshot |
Cite this table: PositionalCalls, “Lenskart Share Price Reaction Table, as of 5 November 2026”.
The stock gave back part of the opening move within the first two hours, a pattern worth noting but not a signal. At the 11:15 AM market capitalisation of about Rs 1,27,587 crore and trailing profit of about Rs 800 crore (approximate, single source), the multiple is roughly 159 times (my calculation); Trade Brains put the pre-results P/E near 178x. Valuation context, not advice. If you act on price, read our capital gains tax on shares guide first.
What do brokerages say after the Lenskart Q2 results FY27?
Reported targets after the result range from Rs 700 (Citi, Neutral) to Rs 888 (Nomura, Buy); of nine reported ratings, eight are Buy, Outperform, Overweight or Long and one is Neutral (my count).
| Brokerage | Rating | Target (Rs) | Note as reported |
|---|---|---|---|
| Nomura | Buy | 888 | Highest target (Inc42) |
| Equirus | Long | 874 | December 2027 target |
| Motilal Oswal | Buy | 815 | Pre-results target was 705 (Trade Brains) |
| Morgan Stanley | Overweight | 805 | Raised from 718 |
| HSBC | Buy | 790 | – |
| Jefferies | Buy | 780 | Raised from 680 |
| CLSA | Outperform | 773 | – |
| Macquarie | Outperform | 750 | – |
| Citi | Neutral | 700 | Raised from 650; cites valuation and tougher H2 comparisons |
Cite this table: PositionalCalls, “Lenskart Brokerage Views Table (as reported), as of 5 November 2026”.
These views are published by third parties and relayed by Inc42, NewsBytes and Trade Brains; I did not read the underlying notes and do not endorse any of them. The spread from Rs 700 to Rs 888 shows how differently brokerages value the same quarter. This page gives no price target, rating or buy or sell view of its own.
What to watch in Lenskart Q3 FY27
After the Lenskart Q2 results FY27, watch whether India same-store sales growth holds near 20%, whether international profit grows again after a flat quarter, whether the tax share stays near 24% and whether operating cash flow stays positive.
| What to read | Mark from Q2 | Question to ask |
|---|---|---|
| India same-store sales growth | 20.8% | Does it hold against tougher second-half comparisons (Citi’s point)? |
| EBITDA pre-Ind AS 116 margin | 13.8% | Does it move toward the 25% adjusted long-term aim on the Ind AS basis? |
| International EBITDA | Rs 127 cr, flat QoQ (derived) | Does it resume growth? |
| Tax share of PBT | About 24% (derived) | Is the lower share sustained? |
| Operating cash flow | Rs 388 cr in H1 | Does it keep pace with profit? |
| Store additions | 165 net in Q2 | Do new stores mature as fast as older ones? |
Cite this table: PositionalCalls, “Lenskart Q3 FY27 Watch Table, as of 5 November 2026”.
What most people miss
Analyst’s note
- What stands out: revenue growth above 32%, same-store sales growth near 21% in India and positive operating cash flow, in a quarter that beat the one pre-results estimate I found.
- Easy to miss: profit was close to flat on Q1 and international was level, so the year-on-year headline overstates the current pace.
- What would change the view: a filing note showing a one-off, a rebound in the tax share, or slower India same-store sales in Q3.
- Caution: the Q1 values are my subtraction from half-year totals, and no price target or buy or sell view is given.
- Reader action: choose one base and one EBITDA definition before comparing Lenskart with any peer.
Bottom line
Lenskart Q2 results FY27 show profit of Rs 232.45 crore, revenue of Rs 2,845 crore and EBITDA before Ind AS 116 of Rs 392 crore, ahead of the estimate I found. The headline growth depends on the base, profit was close to flat on Q1 and international was level, so name the base and the EBITDA definition, and confirm them in the filing.
Next read: the Q2 results calendar.
Part of the Earnings series.
PositionalCalls WhatsApp channel
Never miss a results-day update
- Same-day decoders for the biggest companies reporting
- One-offs separated from the underlying number
- Corrections posted openly when a figure changes
FAQs on Lenskart Q2 results FY27
When were Lenskart Q2 results FY27 announced?
Lenskart announced its Q2 FY27 results on Wednesday, 4 November 2026 for the quarter ended 30 September 2026. The first trading reaction came on Thursday, 5 November. Confirm the filing time on the exchange page.
What was the Lenskart Q2 net profit FY27?
Profit after tax was Rs 232.45 crore, up 124.7% from Rs 103.45 crore; profit to owners was Rs 227.08 crore, up 122.1%. The presentation shows a restated base of about Rs 113 crore (+106%). Confirm in the filing.
What was Lenskart’s revenue in Q2 FY27?
Revenue from operations was Rs 2,845.03 crore, up 35.7% on the filing base of Rs 2,096.14 crore, or up 32.5% on the restated base of about Rs 2,147 crore. Half-year revenue was Rs 5,559 crore, up 33.0%.
What was the Lenskart Q2 EBITDA FY27?
EBITDA before Ind AS 116 was Rs 392 crore, up 65%, a 13.8% margin against 11.1%. On the Ind AS 116 basis, which excludes store rent, it was about Rs 624 crore, a 21.9% margin.
Why do Lenskart Q2 growth figures differ between reports?
Reports use different year-ago bases (revenue Rs 2,096 crore or Rs 2,147 crore; profit about Rs 103 crore or Rs 113 crore) and different profit lines (total or owners’). The differences are shown in the table on this page.
Did Lenskart’s profit grow from Q1 FY27?
Only slightly. Derived from half-year profit of Rs 461 crore, Q1 profit was about Rs 229 crore, so Q2 rose about 1.7% on Q1 (my calculation). International revenue and EBITDA were roughly level; India grew.
Did Lenskart beat estimates in Q2 FY27?
Against Motilal Oswal’s pre-results estimates, revenue was about 2.2% higher and EBITDA about level, with profit 11% to 13% higher depending on the line. I did not find a published consensus.
From a close near Rs 690 the stock opened near Rs 745 to Rs 750, touched a record Rs 767.40 and was near Rs 733 at 11:15 AM on 5 November. I could not find the official close. This is not a price target.
What are the brokerage targets for Lenskart after Q2?
Reported targets range from Rs 700 (Citi, Neutral) to Rs 888 (Nomura, Buy), with Jefferies at Rs 780 and Motilal Oswal at Rs 815. These are third-party views, as reported, and not my view or advice.
Does this page give a Lenskart Q2 results FY27 buy or sell call?
No. This is research and education, not advice. PositionalCalls.com is not a SEBI-registered research analyst or investment adviser. Use the numbers to frame questions and speak to a registered adviser before investing.
Sources
- Lapaas Voice, November 2026 (filing-basis line items)
- InvestyWise, November 2026 (BSE filing summary, segments, H1)
- InvestyWise, November 2026 (presentation figures)
- HDFC Sky, 5 November 2026 (price at 9:40 AM, stores)
- Sahi, November 2026 (owners’ profit, Ind AS EBITDA)
- Inc42, 5 November 2026 (price, brokerage table)
- NewsBytes, 5 November 2026 (Jefferies, Morgan Stanley, Motilal Oswal)
- Trade Brains, 3 November 2026 (Motilal Oswal estimates)
- Startup Article, November 2026 (management comment, TTM)
- BSE and NSE announcement pages: where the filing appears (I did not open it).
PositionalCalls.com is not a SEBI-registered research analyst or investment adviser. Investments in securities markets are subject to market risks. Read all related documents carefully before investing. Returns are never guaranteed. PositionalCalls is an independent Indian stock market research and education site founded by Shubham Chaudhary. This page is education and results analysis, not a recommendation to buy, sell or hold any security. How I researched this: I read nine press and data-platform summaries of the filing and presentation, reconciled the year-ago bases, EBITDA definitions and segment totals against each other, derived Q1 from half-year totals, recomputed every derived number and listed conflicts openly. I have not opened the filing.

Shubham Chaudhary is the founder of PositionalCalls, an independent Indian stock market research website. He writes company fundamentals, quarterly results analysis, IPO analysis and sector research for NSE and BSE listed companies, with a focus on banking stocks, insurance and long-term value investing. Every article is built from primary sources such as RBI, SEBI, NSE and BSE filings and company annual reports, and states its risks plainly in simple language for retail investors.
Coverage areas Our research standards- Numbers checked against NSE, BSE and SEBI filings
- Risks and limits stated in every article
- No paid promotions or broker tie-ups
- Articles updated when new filings arrive