

Results analysis · NBFC and gold finance
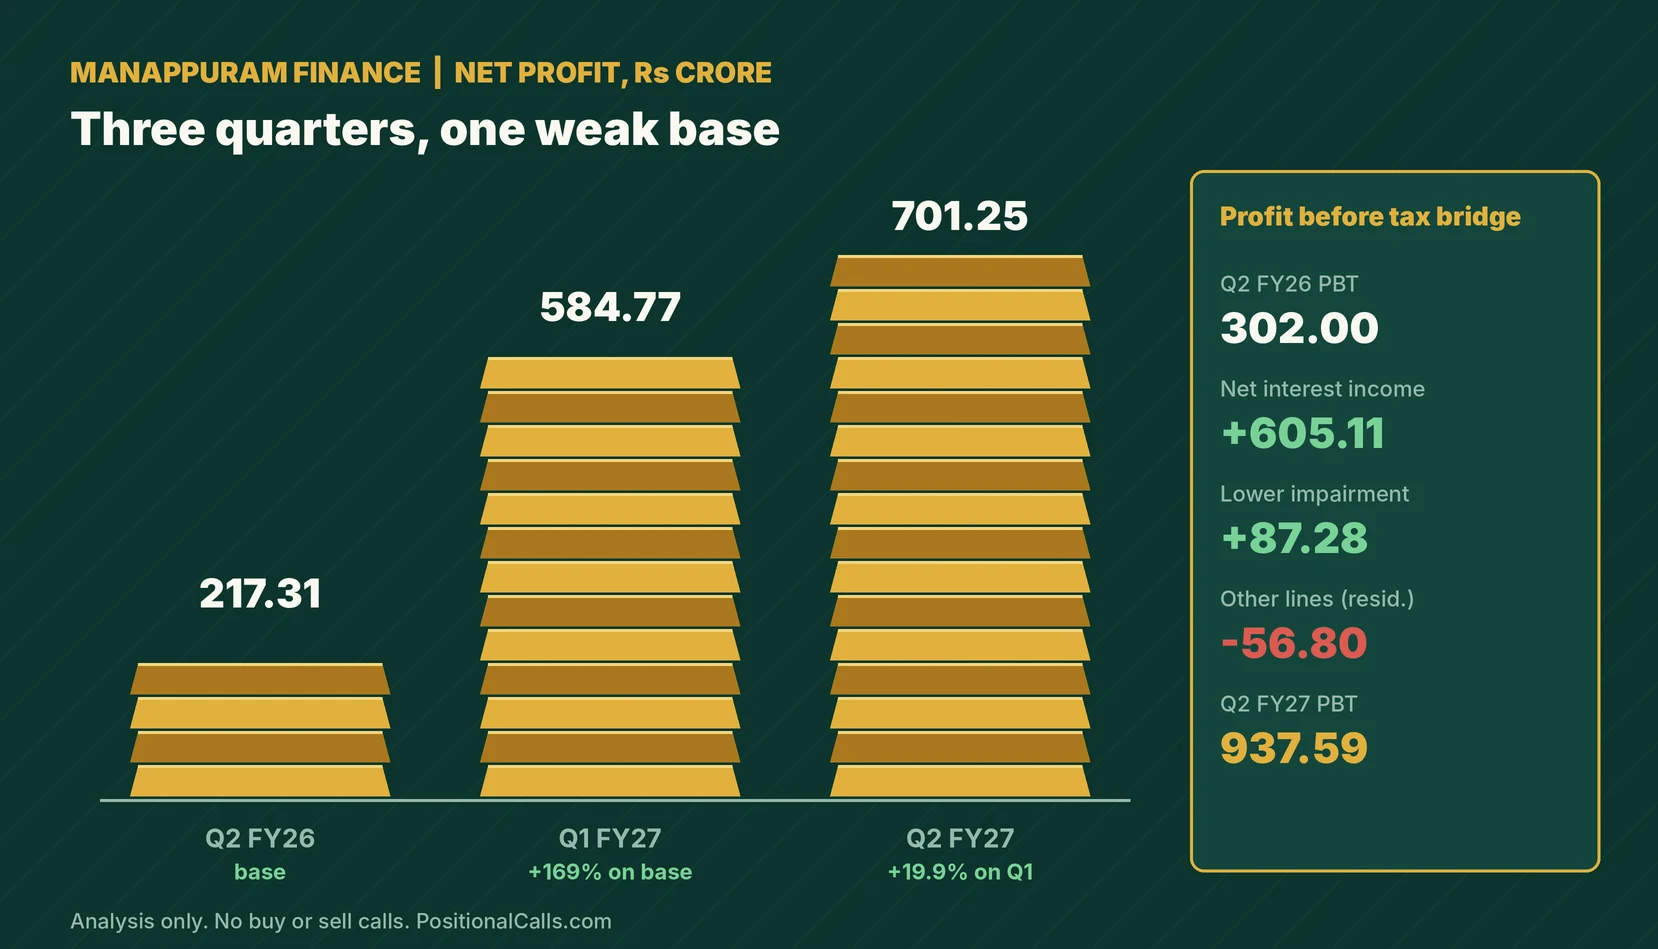
Looking for the Manappuram Finance Q2 results FY27? The company reported on 12 November 2026: profit more than tripled to Rs 701.25 crore, revenue rose 47.8% and the board declared an interim dividend of Rs 1. This page ties the numbers to the base and to Q1 FY27, shows what drove the jump, flags where sources conflict and lists what to check in the filing.
Quick answer
Manappuram Finance Q2 results FY27: consolidated net profit rose about 223% to Rs 701.25 crore from Rs 217.31 crore, and revenue from operations rose about 48% to Rs 3,361.55 crore. The board declared an interim dividend of Rs 1 a share, record date 18 November 2026. Reported 12 November 2026; no call here.
Latest update (Friday, 13 November 2026, 10:15 AM IST): Manappuram Finance reported Q2 FY27 results on Thursday, 12 November 2026. Business Upturn published at 4:58 PM IST, updated at 7:22 PM IST, and Univest, Investywise and Multibagg carried fuller sets. I did not find an analyst estimate or a post-result price, and I have not opened the exchange filing.
Key takeaways
- Profit: consolidated net profit of Rs 701.25 crore against Rs 217.31 crore a year earlier, up 222.7%, and 19.9% above Q1 FY27’s Rs 584.77 crore (my calculation).
- Revenue: revenue from operations of Rs 3,361.55 crore, up 47.8% on one year-ago base and 10.8% on Q1 FY27; the sources give three different year-ago bases.
- Drivers: interest income rose 49.8%, and impairment fell 22.9% to Rs 294.15 crore; together they explain most of the Rs 635.6 crore gain in profit before tax (my calculation).
- Dividend: interim Rs 1 a share (50% of the Rs 2 face value), record date Wednesday, 18 November 2026, per Investywise.
- Credit cost: impairment rose 30.5% on Q1 FY27 even as it fell on the year.
- Still open: no estimate, post-result price or asset-quality ratios found; one summary page contradicts itself on debenture asset cover; the filing is not opened.
In plain words: Manappuram Finance is a gold loan company, with a smaller microfinance arm, Asirvad. It lends against gold at a rate above its own borrowing cost, so profit depends on loan growth, the gap between interest earned and paid, and the provisions it sets aside for loans that may not be repaid.
Data note: Figures are as of 13 November 2026, 10:15 AM IST. Consolidated profit, income, expenses, impairment and segment lines come from Business Upturn and Investywise (which cites the BSE filing); the cross-check comes from Univest and Multibagg, an automated summary page. Earlier figures come from my preview. I could not open the exchange filings and derived numbers are my calculation.
In this post
- What did Manappuram Finance report?
- Why do the sources differ?
- What was the Q2 FY26 base?
- How does Q2 compare with Q1 FY27?
- Why did profit more than triple?
- Segments, AUM and gold
- Credit cost
- Dividend and record date
- What the reports do not show
- What did the preview say?
- Arithmetic checks
- Next-filing decoder
- How to read the filing
- What most people miss
- FAQs
- Sources
What did Manappuram Finance report in the Manappuram Finance Q2 results FY27, and how big was the change?
In the Manappuram Finance Q2 results FY27, consolidated net profit was Rs 701.25 crore, up 222.7% from Rs 217.31 crore, and revenue from operations was Rs 3,361.55 crore, up 47.8% from Rs 2,274.53 crore, per Business Upturn for the quarter ended 30 September 2026. Profit before tax was Rs 937.59 crore.
The results covered the quarter and half-year ended 30 September 2026 and were reported on 12 November 2026. The Business Upturn article is stamped 4:58 PM IST and updated at 7:22 PM IST; I did not find the exact filing time. Companies must report within 45 days of the quarter-end, which made 14 November the limit, so this was day 43 (my calculation). Every number below is as reported by the sources named, and I have not opened the filing.
| Reported figures (consolidated, quarter to 30 Sep 2026) | Q2 FY27 | Q2 FY26 | Change |
|---|---|---|---|
| Revenue from operations | Rs 3,361.55 crore | Rs 2,274.53 crore | +47.8% |
| Interest income | Rs 3,339.06 crore | Rs 2,229.26 crore | +49.8% |
| Finance costs | Rs 1,380.32 crore | About Rs 876 crore | +57.6% (reported) |
| Net interest income (derived) | Rs 1,958.74 crore | Rs 1,353.63 crore | +44.7% |
| Profit before tax | Rs 937.59 crore | Rs 302.00 crore | +210.5% |
| Net profit | Rs 701.25 crore | Rs 217.31 crore | +222.7% |
| Basic EPS | Rs 7.46 | Rs 2.57 | +190.3% |
Cite this table: Manappuram Finance Q2 FY27 per Business Upturn; Q2 FY26 marks per the same page and my preview; net interest income is interest income less finance costs, derived by Business Upturn and checked by PositionalCalls.
The growth rates tie to their bases: Rs 217.31 crore multiplied by 3.227 is Rs 701.25 crore, and Rs 2,274.53 crore multiplied by 1.478 is Rs 3,361.55 crore (my calculation). Interest income of Rs 3,339.06 crore less finance costs of Rs 1,380.32 crore gives Rs 1,958.74 crore, which matches the derived net interest income. The company does not print a net interest income line in the results statement, according to Business Upturn, so this is a derived figure and not a reported one.
Why do the sources show different numbers for the Manappuram Finance Q2 results FY27?
The sources agree on net profit of about Rs 701 crore but differ on the year-ago revenue (Rs 2,274.53, 2,283.46 or 2,296 crore), on a second profit line, on growth in the headline (218.6% against 222.7%), and on Q1 net interest income (Rs 1,723.74 crore derived against Rs 1,759 crore in my preview). Use the filing.
| Line | Business Upturn | Univest | Multibagg | My preview |
|---|---|---|---|---|
| Q2 FY27 revenue | Rs 3,361.55 crore | Rs 3,361.55 crore | Rs 3,356 crore | Not applicable |
| Q2 FY26 revenue | Rs 2,274.53 crore (+47.8%) | Rs 2,283.46 crore (+47.21%) | Rs 2,296 crore (+46.2%) | Total income Rs 2,285.36 crore |
| Profit growth | +222.7% (one page); +218.6% (another) | +222.7% | +222.9% | Base Rs 217.31 crore |
| Second profit line | Profit before tax Rs 937.59 crore (+210.5%) | “Financing profit” Rs 999.41 crore (+163.31%) | Not given | Not given |
| Q1 FY27 net interest income | Rs 1,723.74 crore (derived) | Not given | Not given | Rs 1,759 crore (+25%) |
| H1 FY27 revenue | Rs 6,395.71 crore (my sum) | Not given | Rs 6,403 crore | Not applicable |
Cite this table: Manappuram Finance Q2 FY27 source differences compared by PositionalCalls; readings are mine. None of the pages was checked against the filing.
The tie-outs favour the Business Upturn set. Profit before tax of Rs 937.59 crore equals the sum of the two segment results, Rs 894.59 crore for gold loan and others and Rs 43.00 crore for microfinance, and profit after tax of Rs 701.25 crore is 74.8% of it, an implied tax rate of 25.2% (my calculation). Q1 net profit of Rs 584.77 crore plus Q2 of Rs 701.25 crore gives the half-year consolidated profit of Rs 1,286.02 crore reported by Investywise. The Univest “financing profit” of Rs 999.41 crore is a different line from profit before tax and its definition is not given, so I do not compare the two. The Q1 net interest income of Rs 1,759 crore in my preview and Rs 1,723.74 crore derived here probably use different definitions, which is why I compare quarters only within one source. Multibagg states revenue of Rs 3,356 crore, Rs 5.55 crore below Business Upturn, and its half-year figure of Rs 6,403 crore is Rs 7.29 crore above the sum of the two quarters, my calculation, so it is the loosest of the sets.
What was the Q2 FY26 base, and does it tie to the Manappuram Finance Q2 results FY27?
The Q2 FY26 base was consolidated net profit of Rs 217.31 crore, profit before tax of Rs 302.00 crore and impairment of Rs 381.43 crore, on revenue of about Rs 2,275 crore. It was a weak quarter, so the percentage growth is large.
| Q2 FY26 mark | Value | Source | Note |
|---|---|---|---|
| Net profit | Rs 217.31 crore | Business Upturn, Univest, my preview | Ties across three sources; down 62% from Rs 572.08 crore a year before that, per my preview |
| Profit before tax | Rs 302.00 crore | Business Upturn | Tax rate 28.0% (my calculation) |
| Impairment | Rs 381.43 crore | Business Upturn | About 28.2% of net interest income (my calculation) |
| Revenue from operations | Rs 2,274.53 crore | Business Upturn | Univest Rs 2,283.46 crore; Multibagg Rs 2,296 crore |
| Net interest income (derived) | Rs 1,353.63 crore | Business Upturn | Interest income less finance costs |
| Basic EPS | Rs 2.57 | Business Upturn | Rs 7.46 in Q2 FY27 |
Cite this table: Manappuram Finance Q2 FY26 marks per Business Upturn, Univest and my preview, 12 November 2026.
A low base means a high growth rate. The Q2 FY26 net profit was less than half of the Q1 FY27 level of Rs 584.77 crore and less than a third of Q2 FY27, so the 222.7% rise compares a strong quarter with a weak one. Impairment at Rs 381.43 crore took about 28.2% of net interest income that quarter, against about 15.0% in Q2 FY27, my calculation, which is the main reason the base was low.
How do the Manappuram Finance Q2 results FY27 compare with Q1 FY27?
Against Q1 FY27, revenue from operations rose 10.8% to Rs 3,361.55 crore, interest income 11.4%, profit before tax 19.9% to Rs 937.59 crore and net profit 19.9% to Rs 701.25 crore, per Business Upturn. Finance costs rose 8.3% and impairment 30.5%.
| Quarter-on-quarter | Q2 FY27 | Q1 FY27 | Change |
|---|---|---|---|
| Revenue from operations | Rs 3,361.55 crore | Rs 3,034.16 crore | +10.8% |
| Interest income | Rs 3,339.06 crore | Rs 2,997.70 crore | +11.4% |
| Finance costs | Rs 1,380.32 crore | About Rs 1,274 crore | +8.3% |
| Net interest income (derived) | Rs 1,958.74 crore | Rs 1,723.74 crore | +13.6% |
| Impairment | Rs 294.15 crore | Rs 225.47 crore | +30.5% |
| Profit before tax | Rs 937.59 crore | Rs 781.82 crore | +19.9% |
| Net profit | Rs 701.25 crore | Rs 584.77 crore | +19.9% |
| Basic EPS | Rs 7.46 | Rs 6.23 | +19.7% |
Cite this table: Manappuram Finance Q2 FY27 against Q1 FY27 per Business Upturn and my preview; Q1 finance cost is interest income less derived net interest income, my calculation.
Net profit grew 19.9% on the quarter while revenue grew 10.8%, so margin per rupee of revenue widened from about 19.3% to 20.9% (my calculation: Rs 584.77 crore over Rs 3,034.16 crore and Rs 701.25 crore over Rs 3,361.55 crore). Impairment grew faster than income, which is the one line that moved against the profit. Q1 and Q2 net profit add up to the Rs 1,286.02 crore half-year consolidated figure from Investywise, and impairment of Rs 225.47 crore and Rs 294.15 crore adds up to the Rs 519.62 crore half-year figure, which supports the Business Upturn set (my calculation).
Why did Manappuram Finance profit more than triple in the Manappuram Finance Q2 results FY27?
Profit before tax rose by Rs 635.59 crore, from Rs 302.00 crore to Rs 937.59 crore. Net interest income added Rs 605.11 crore and lower impairment added Rs 87.28 crore, while all other lines together took away Rs 56.80 crore (my calculation). Higher lending, not a one-off gain, is the visible driver.
| Bridge, Q2 FY26 to Q2 FY27 (Rs crore) | Amount | Share of the change | Basis |
|---|---|---|---|
| Profit before tax, Q2 FY26 | 302.00 | – | Business Upturn |
| Higher net interest income | +605.11 | 95.2% | 1,958.74 less 1,353.63 |
| Lower impairment | +87.28 | 13.7% | 381.43 less 294.15 |
| All other lines, net (residual) | -56.80 | -8.9% | Other income, fees, employee and other costs; my residual |
| Profit before tax, Q2 FY27 | 937.59 | 100% | Business Upturn |
| Tax rate | 25.2% against 28.0% | – | My calculation |
Cite this table: Manappuram Finance profit before tax bridge calculated by PositionalCalls from Business Upturn figures; the residual is not a reported line.
About 95% of the gain came from the margin between interest earned and paid, and the sums show that the interest income rise of Rs 1,109.80 crore was larger than the finance cost rise of Rs 504.69 crore (my calculation). That pattern fits a company whose loan book grew sharply, and the sources I read show an assets under management rise of about 60% (Multibagg, an automated summary). The residual of Rs 56.80 crore means operating costs and other items grew roughly as fast as income, but the pages do not give the lines. A lower tax rate of 25.2% against 28.0% also helped net profit, raising it by about Rs 26 crore beyond what a flat rate would have given (my calculation: Rs 937.59 crore times 2.8 percentage points).
What do the segments, assets under management and gold loans show in the Manappuram Finance Q2 results FY27?
Gold loan and others earned Rs 3,042.62 crore of segment revenue, up 53.6% on the year, and a segment profit of Rs 894.59 crore, while microfinance earned Rs 329.41 crore of revenue and Rs 43.00 crore of profit. Multibagg reports consolidated AUM of Rs 73,303 crore, with gold loan AUM at Rs 60,640 crore.
| Segment (Rs crore) | Q2 FY27 revenue | Change YoY | Change QoQ | Segment profit before tax |
|---|---|---|---|---|
| Gold loan and others | 3,042.62 | +53.6% | +11.6% | 894.59 |
| Microfinance | 329.41 | +12.1% | +4.5% | 43.00 |
| Total | 3,372.03 | – | – | 937.59 |
Cite this table: Manappuram Finance segment results per Business Upturn and Investywise; revenue share and margins in the text are my calculation.
PositionalCalls WhatsApp channel
The results, then the filing check
- The profit, income and dividend lines as soon as they appear
- Why profit moved, explained
- Links to the updated page
| Operating line | Q2 FY27 | Q1 FY27 (my preview) | Change (my calculation) |
|---|---|---|---|
| Consolidated AUM | Rs 73,303 crore | Rs 69,635 crore | +5.3% |
| Gold loan AUM | Rs 60,640 crore | Rs 57,006 crore | +6.4% |
| Gold loan share of AUM | 82.7% | 81.9% | +0.8 points |
| Asirvad Micro Finance profit | Rs 32 crore | Rs 21 crore | +Rs 11 crore |
| Asirvad AUM | Rs 7,919 crore | Not recorded | – |
| Gold stock held | 70 tonnes (+22% YoY, +3.5% QoQ) | Not recorded | – |
Cite this table: Manappuram operating metrics per Multibagg, an automated summary page not checked against the filing; Q1 FY27 marks per my preview.
What do credit costs show in the Manappuram Finance Q2 results FY27?
Impairment on financial instruments was Rs 294.15 crore, down 22.9% on the year from Rs 381.43 crore but up 30.5% on Q1 FY27’s Rs 225.47 crore, per Business Upturn. For the half-year it was Rs 519.62 crore against Rs 953.80 crore, down about 45.5% (my calculation).
| Credit cost line | Q2 FY27 | Q2 FY26 | Q1 FY27 | H1 FY27 / H1 FY26 |
|---|---|---|---|---|
| Impairment (Rs crore) | 294.15 | 381.43 | 225.47 | 519.62 / 953.80 |
| Change | -22.9% YoY; +30.5% QoQ | – | – | -45.5% |
| As a share of net interest income | 15.0% | 28.2% | 13.1% | Not computed |
| Annualised on AUM of Rs 73,303 crore | About 1.6% | Not computed | Not computed | Not computed |
| Gross and net NPA | Not found | Not found | Asirvad GNPA 4.8% (preview) | – |
Cite this table: Manappuram impairment per Business Upturn; shares, annualised figure and sums by PositionalCalls. The annualised figure uses the Multibagg AUM and is indicative.
Lower credit cost than a year ago explains Rs 87.28 crore of the profit gain, but the quarter-on-quarter rise of 30.5% shows the line is not falling in a straight line. The annualised figure of about 1.6% is impairment of Rs 294.15 crore times four over AUM of Rs 73,303 crore, a rough measure, since AUM is a different base from the loan book and the AUM figure is unverified. I found no gross or net NPA, stage 3 or coverage figures in the reports, which are the numbers that show whether the impairment is a one-quarter or a continuing level; read them in the filing or the investor presentation.
What did Manappuram Finance declare as a dividend with the Manappuram Finance Q2 results FY27?
The board declared an interim dividend of Rs 1 a share, 50% of the Rs 2 face value, with a record date of Wednesday, 18 November 2026, per Investywise. The payment date was not stated. An earlier interim of Rs 1 had a record date of 17 August 2026, per my preview, so two interims total Rs 2 so far in FY27 (my calculation).
| Dividend item | Detail | Source | Note |
|---|---|---|---|
| Amount | Rs 1 a share (50% of Rs 2 face value) | Investywise, Multibagg | Interim, FY 2026-27 |
| Record date | Wednesday, 18 November 2026 | Investywise | Check the NSE circular |
| Ex-date | Likely the same day (my reading) | – | Under T+1 settlement the ex-date is normally the record date |
| Last day to buy for the dividend | Tuesday, 17 November 2026 (my reading) | – | The day before the ex-date |
| Payment date | Not stated | – | Check the board outcome |
| Earlier interim | Rs 1, record 17 August 2026 | My preview | Q1 FY27 |
| Gross payout (my calculation) | About Rs 94 crore | – | Rs 1 times about 94.0 crore shares implied by EPS |
Cite this table: Manappuram Finance dividend per Investywise and Multibagg; ex-date reading, share count and payout by PositionalCalls. Confirm the dates on NSE and BSE.
The share count of about 94.0 crore is Rs 701.25 crore divided by an EPS of Rs 7.46, and the Q1 figures (Rs 584.77 crore over Rs 6.23) give about the same, so it is consistent (my calculation). A payout of about Rs 94 crore is 13.4% of the quarter’s consolidated profit, my calculation, and it is not a view on the amount. For how a dividend is taxed, see dividend tax in India.
What do the reports not show about the Manappuram Finance Q2 results FY27?
The reports I read do not show the exact filing time, gross or net NPA, net interest margin, an analyst estimate, management comment, guidance, a post-result share price, or the filing text. One summary page also gives two opposite statements about debenture asset cover.
| Item | Found? | Why it matters |
|---|---|---|
| Exact filing time | No (article time 4:58 PM IST only) | Sets which trading session reacts |
| Gross and net NPA | No | Tests whether credit cost is steady |
| Net interest margin and spreads | No | Shows the pricing behind the profit |
| Analyst estimate or consensus | No | Needed to say beat or miss |
| Management comment and guidance | No | Context for loan growth and gold prices |
| Post-result share price | No | Market reaction |
| Debenture asset cover | Two conflicting statements on one page | Check the filing |
Cite this table: Manappuram items not found in the pages read, PositionalCalls, 13 November 2026.
The Investywise summary says in one place that the asset cover certificate and the financial covenant certificate were filed as required, and elsewhere reports a certificate from Chokshi & Chokshi LLP saying that the book value of assets charged against listed debentures did not agree with the unaudited books and that not all trust-deed covenants were met. I cannot tell from a summary page which reading is right, or whether it describes this quarter or an exception, and I have not opened the filing. It is the first thing to check: read the secured-debenture asset cover note and the certificates in the BSE or NSE filing before drawing any conclusion.
What did the preview say, and how did the Manappuram Finance Q2 results FY27 compare?
The preview recorded a Q2 FY26 net profit base of Rs 217.31 crore, Q1 FY27 net profit of Rs 584.77 crore, Q1 AUM of Rs 69,635 crore and a possible interim dividend. The result ties to the base, exceeded Q1, grew AUM by 5.3% and declared Rs 1. No Q2 analyst estimate was found before the result.
| Preview mark | Preview value | Result | Comparison |
|---|---|---|---|
| Q2 FY26 net profit | Rs 217.31 crore | Rs 701.25 crore | +222.7% |
| Q1 FY27 net profit | Rs 584.77 crore | Rs 701.25 crore | +19.9% |
| Q1 FY27 revenue from operations | Rs 3,034.16 crore | Rs 3,361.55 crore | +10.8% |
| Q1 FY27 AUM | Rs 69,635 crore | Rs 73,303 crore | +5.3% (Multibagg) |
| Q1 FY27 provisions | About Rs 225 crore | Rs 294.15 crore | +30.5% |
| Dividend | Interim to be considered | Rs 1 declared, record 18 Nov | Declared |
Cite this table: Manappuram preview marks against the result, PositionalCalls, 13 November 2026.
The preview carried no profit estimate, so there is nothing to beat or miss. It noted that profit had grown sharply in Q1 and asked whether the gain would hold; the result says it did, by 19.9% on the quarter. Read the preview at Manappuram Finance Q2 results date FY27.
What does the arithmetic show for the Manappuram Finance Q2 results FY27?
At the Q2 FY27 tax rate of 25.2% and about 94.0 crore shares, each Rs 100 crore change in pre-tax profit moves net profit by about Rs 75 crore and earnings per share by about Rs 0.80. Each 10% change in impairment moves profit before tax by about Rs 29 crore. This is my arithmetic.
| Sensitivity (my calculation) | Change | Effect on net profit | Effect on EPS |
|---|---|---|---|
| Pre-tax profit +Rs 100 crore | At 25.2% tax | About +Rs 74.8 crore | About +Rs 0.80 |
| Impairment -10% | -Rs 29.4 crore | About +Rs 22.0 crore after tax | About +Rs 0.23 |
| Impairment +10% | +Rs 29.4 crore | About -Rs 22.0 crore after tax | About -Rs 0.23 |
| Net interest income +5% | +Rs 97.9 crore | About +Rs 73.2 crore after tax | About +Rs 0.78 |
| Tax rate back to 28.0% | +2.8 points | About -Rs 26.3 crore | About -Rs 0.28 |
Cite this table: Manappuram sensitivity arithmetic by PositionalCalls from Business Upturn figures; before any other change. Not an estimate.
Three worked examples for a Manappuram Finance Q2 results FY27 reader
Example, growth against a low base. A profit of Rs 701.25 crore against Rs 217.31 crore is +222.7%; against Q1’s Rs 584.77 crore it is +19.9%. Both are true, and the second says more about momentum.
How do I read the next Manappuram Finance results after this one?
On the next results read, in this order: net interest income and the margin, impairment, gross and net NPA, AUM and gold loan AUM, the Asirvad figures, then the tax rate and the dividend. Compare each with the marks in this page.
| Order | Line to read | Mark to compare | Why it comes first |
|---|---|---|---|
| 1 | Net interest income | Rs 1,958.74 crore (derived) | Core earnings |
| 2 | Impairment | Rs 294.15 crore | The line that rose on Q1 |
| 3 | Gross and net NPA | Not found | Quality of the book |
| 4 | AUM and gold loan AUM | Rs 73,303 crore and Rs 60,640 crore | Growth engine |
| 5 | Asirvad profit and asset quality | Rs 32 crore | Microfinance risk |
| 6 | Tax rate and dividend | 25.2%; Rs 1 | Bridge to net profit and payout |
Cite this table: Manappuram reading order, PositionalCalls.
How do I read the Manappuram Finance filing and avoid fake tips?
Open the NSE or BSE announcement for Manappuram Finance Limited, not a link in a message, and read the consolidated results table, the segment note and the secured debenture asset cover certificate. Treat any tip that asks for an OTP, payment or login, or promises a target, as fake.
- Open the exchange announcement page for Manappuram Finance Limited.
- Read the unaudited consolidated and standalone results for the quarter ended 30 September 2026.
- Note revenue, finance costs, impairment, profit before tax and tax.
- Compare with Rs 3,361.55 crore, Rs 937.59 crore and Rs 701.25 crore.
- Read the secured debenture asset cover and covenant certificates.
- Check the board outcome for the dividend, the record date and the payment date.
PositionalCalls is not SEBI-registered, gives no buy or sell calls and never asks for payment. Nothing here is investment advice.
What do most people miss in the Manappuram Finance Q2 results FY27?
Most readers of the Manappuram Finance Q2 results FY27 miss that the 222.7% rise is measured against a weak quarter, that impairment rose 30.5% on Q1, that three year-ago revenue bases circulate, and that one summary page contradicts itself on debenture asset cover.
Analyst’s note. What stands out: profit tripled on the year because net interest income rose Rs 605 crore and impairment fell Rs 87 crore (my reading). What is easy to miss: the quarter-on-quarter rise is a more modest 19.9%, and impairment rose in that comparison. What would change the view: a filing that shows different asset quality or a debenture covenant issue. Caution: figures come from news and summary pages and I did not open the filing; this note is reasoning, not a forecast or target. Reader action: read the NPA lines and the debenture certificates first.
Bottom line
The Manappuram Finance Q2 results FY27 show net profit of Rs 701.25 crore, up 222.7% on a weak base and 19.9% on Q1, revenue of Rs 3,361.55 crore and an interim dividend of Rs 1. This page gives no call. I will update it after the filing is read or the next results. See our earnings coverage.
PositionalCalls WhatsApp channel
Never miss an update
- Results dates and dividend record dates
- Numbers explained without tips or targets
- Updated posts as they go live
Manappuram Finance Q2 results FY27: frequently asked questions
What did Manappuram Finance report in the Manappuram Finance Q2 results FY27?
In the Manappuram Finance Q2 results FY27, consolidated net profit was Rs 701.25 crore, up 222.7%, and revenue from operations Rs 3,361.55 crore, up 47.8%, reported on 12 November 2026. The board declared an interim dividend of Rs 1. The filing was not opened.
What was Manappuram Finance net profit in Q2 FY27?
Net profit was Rs 701.25 crore against Rs 217.31 crore a year earlier, up 222.7%, per Business Upturn and Univest, and 19.9% above Q1 FY27’s Rs 584.77 crore, my calculation. Standalone net profit was Rs 664.75 crore. One Business Upturn page shows growth of 218.6%, so check the filing.
Why did Manappuram Finance profit more than triple in Q2 FY27?
In the Manappuram Finance Q2 results FY27, profit before tax rose Rs 635.59 crore. Net interest income added Rs 605.11 crore and lower impairment Rs 87.28 crore, while other lines took away Rs 56.80 crore, my calculation. The Q2 FY26 base of Rs 217.31 crore was also weak. The pages give no one-off gain.
What is the Manappuram Finance dividend and record date?
The board declared an interim dividend of Rs 1 a share, 50% of the Rs 2 face value, with a record date of Wednesday, 18 November 2026, per Investywise. The payment date was not stated. Under T+1 settlement the ex-date is normally the record date, so check the NSE circular.
What was Manappuram Finance revenue in Q2 FY27?
Revenue from operations was Rs 3,361.55 crore, up 47.8% from Rs 2,274.53 crore and 10.8% above Q1 FY27, per Business Upturn. Univest shows a year-ago base of Rs 2,283.46 crore and Multibagg Rs 2,296 crore, so growth is 47.2% to 47.8% depending on the source.
What was Manappuram Finance AUM in the Q2 results FY27?
In the Manappuram Finance Q2 results FY27 coverage, Multibagg reports consolidated assets under management of Rs 73,303 crore, up 60.1% on the year, with gold loan AUM of Rs 60,640 crore, up 92.5%. That page is an automated summary and I did not find the figures in the other sources, so check the investor presentation.
Did Manappuram Finance beat Q2 estimates?
I found no analyst estimate or consensus for the quarter, so I cannot say whether the Manappuram Finance Q2 results FY27 beat or missed one. Compare the result with the year-ago base of Rs 217.31 crore and with Q1 FY27’s Rs 584.77 crore, as the tables on this page do.
What was Manappuram Finance credit cost in Q2 FY27?
Impairment on financial instruments was Rs 294.15 crore, down 22.9% from Rs 381.43 crore a year earlier but up 30.5% from Rs 225.47 crore in Q1 FY27, per Business Upturn. I found no gross or net NPA figure, so check the filing for asset quality.
Is there an asset cover issue in the Manappuram Finance results?
One Investywise summary page gives two opposite statements: that asset cover and covenant certificates were filed, and that a certificate found the charged assets did not agree with the books and not all covenants were met. I have not opened the filing, so check the debenture note on NSE or BSE.
Is this page financial advice about Manappuram Finance?
No. This page is not investment advice, a target or a recommendation, and PositionalCalls is not SEBI-registered. It reports company figures and sources with dates, and labels my calculations. Read the exchange filing and consult a registered adviser before any decision.
Sources
- NSE India: corporate announcements: results notices.
- BSE India: corporate announcements: the results filing.
- Business Upturn: Manappuram Finance Q2 profit jumps 223% to Rs 701 crore, 12 November 2026, 4:58 PM IST, updated 7:22 PM IST.
- Investywise: Manappuram Finance declares interim dividend and approves Q2 FY27 results, 12 November 2026; cites a BSE filing.
- Univest: Manappuram Finance Q2 results FY27, PAT Rs 701.25 crore, 12 November 2026.
- Multibagg: Manappuram Finance Q2 profit rises 223% to Rs 701 crore, 12 November 2026; automated summary.
- PositionalCalls: Manappuram Finance Q2 results date FY27 preview, 12 November 2026.
Disclosure: PositionalCalls.com is not a SEBI-registered research analyst or investment adviser. Investments in securities markets are subject to market risks. Read all related documents carefully before investing. Returns are never guaranteed. PositionalCalls is an independent research and education site founded by Shubham Chaudhary. Nothing here is a recommendation, target or investment advice. How I researched this: for this page on the Manappuram Finance Q2 results FY27 I read Business Upturn, Investywise, Univest and Multibagg, noted where sources differ, and marked every derived number as my calculation. I did not open any company filing or exchange document. Figures are as of 13 November 2026, 10:15 AM IST.

Shubham Chaudhary is the founder of PositionalCalls, an independent Indian stock market research website. He writes company fundamentals, quarterly results analysis, IPO analysis and sector research for NSE and BSE listed companies, with a focus on banking stocks, insurance and long-term value investing. Every article is built from primary sources such as RBI, SEBI, NSE and BSE filings and company annual reports, and states its risks plainly in simple language for retail investors.
Coverage areas Our research standards- Numbers checked against NSE, BSE and SEBI filings
- Risks and limits stated in every article
- No paid promotions or broker tie-ups
- Articles updated when new filings arrive