

Sector outlook · Infrastructure
Looking for the infrastructure sector outlook 2026? The February page called it a strong capex-driven growth cycle with five positive drivers and no figures. This rebuild tests each claim against the Union Budget, the first-half central capex data, highway awards, private investment surveys and the Q2 FY27 results of L&T, IRB, NBCC, RVNL, Bharat Dynamics and Thermax. It sets out what to watch, not what to buy.
Quick answer
The infrastructure sector outlook 2026 is mixed. Central capex was Rs 6.55 lakh crore in April to September, 53.6% of the Rs 12.22 lakh crore budget, and rail spending is up, but highway awards fell to 3,124 km in FY26 and private capex data conflicts. This page names no stock.
Latest update (Sunday, 15 November 2026, 7:21 AM IST): Rebuilt on fresh data, replacing the February page whose “5 positive drivers” and “strong road pipeline” claims had no numbers. The data is mixed: railway capex is up 23% in April to August, but NHAI awarded 3,124 km in FY26 against 4,008 km in FY25, and the two private capex sources point in opposite directions. I did not open the original reports or any filing, and I found no valuation or institutional flow data.
Key takeaways
- No stock is named: there is no rating, ranking, target or buy list. The February sections on valuation, institutional positioning and capital flows had no data and are not carried over.
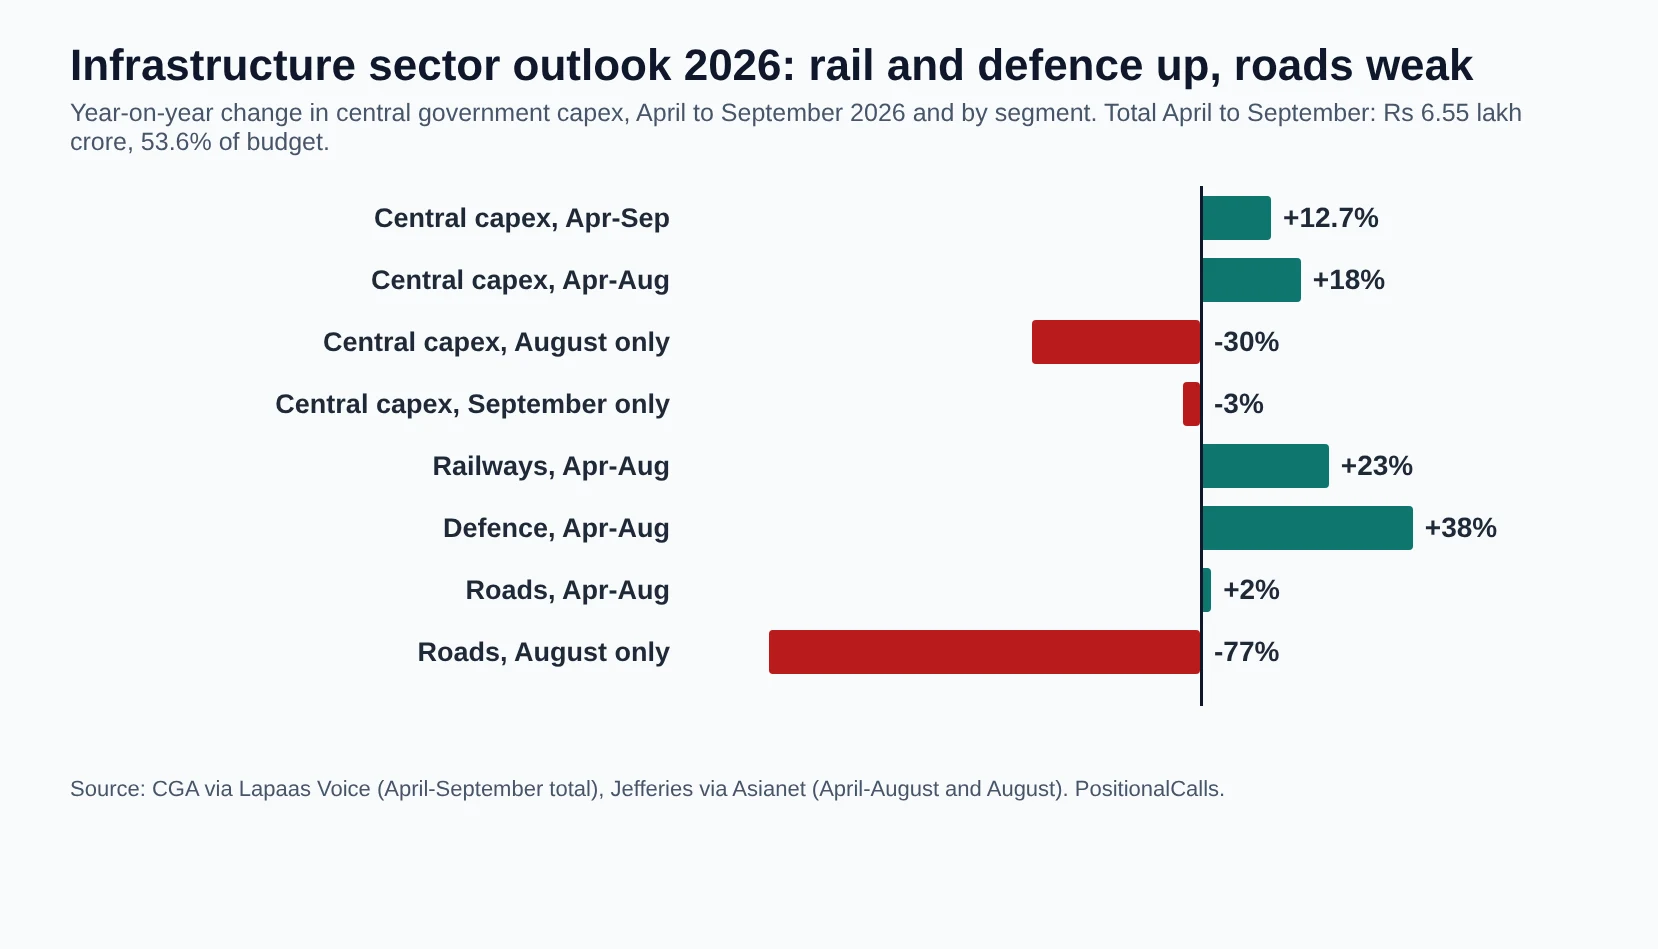
- Capex is rising but unevenly: the FY27 budget is Rs 12.2 lakh crore (about 8.9% above the FY26 budget, my calculation); April to September spending was Rs 6.55 lakh crore, up about 12.7%, though August fell 30% and September 3%.
- Rail up, roads weak: railway capex was up 23% and defence 38% in April to August, while road capex was up 2% and fell 77% in August alone; NHAI awards were 3,124 km in FY26, down from 4,008 km and short of a 4,500 km target.
- Private capex data conflicts: the RBI sees bank, ECB and IPO-financed capex of Rs 3.2 lakh crore in FY27 against Rs 2.6 lakh crore in FY26, while a MoSPI survey shows private capex of Rs 9.55 lakh crore, down 16.5% from Rs 11.43 lakh crore.
- Margins did not match the old claim: L&T’s EBITDA margin fell to 8.7% from 10% in Q2 FY27 even as its order book reached Rs 8,53,514 crore, so order books are not profit.
- Gaps: no valuation, no institutional flow, no urban infrastructure data and no filings opened, so this page cannot say the sector is cheap or expensive.
In plain words: the government is spending more on railways and defence but less on highway awards, private companies are sending mixed signals, and builders showed large order books but thinner margins. This page lays out each piece of data and what would change the picture.
Data note: Budget and spending figures are from press reports of the Union Budget (1 February 2026) and Controller General of Accounts data (31 October 2026), as reported. Road, rail and defence data are from Jefferies via Asianet (7 October) and Nuvama via The Tribune (2 September). Private capex figures are from the RBI as reported by Business Today and a MoSPI survey as reported by Deccan Chronicle. Company data is from my own result posts. I did not open the original reports or filings. Derived numbers are my calculation.
1. What changed in the infrastructure sector outlook 2026 since February?
The infrastructure sector outlook 2026 changed from a strong capex-driven cycle to a mixed one: central capex is higher, but August spending fell 30%, highway awards hit a multi-year low, private capex data conflicts, and L&T’s margin fell.
The February version was headlined “5 Positive Drivers” and said government capex was driving order inflows, railway and road investments were accelerating, urban projects were expanding, private capex was gradually recovering and institutional capital favoured strong balance sheets. It had a “Snapshot FY26” table with no figures. Nine months later, the Budget, the first-half spending data, awarding data and Q2 results are out, so each claim can be tested. For company result tables, see my infrastructure sector earnings page, which this page does not repeat.
What the infrastructure sector outlook 2026 page tests
- Government capex: the Budget, first-half spending and the sector split (sections 3 to 5).
- Order books and execution: what companies reported (section 6).
- Private capex: two sources that disagree (section 7).
- Costs, margins and rates: what squeezes profit (section 8).
- Segments and watch items: where the data is thin and what would change the picture (sections 9 and 10).
I removed the “valuation and institutional positioning” and “capital-flow impact” sections. They described inflows with no figures, and I found no price, multiple or flow data to support them. The “urban infrastructure and smart cities” claim is also untested, because I found no metro, water or smart-city spending data.
2. Old claims against the data in the infrastructure sector outlook 2026
Of nine claims on the February infrastructure sector outlook 2026 page, the data supports two (rail spending, balance-sheet repair), contradicts two (road pipeline, margins), splits two (government capex, private capex), and leaves three untested.
| February claim | What I found | Verdict |
|---|---|---|
| Government capex driving order inflows | Budget Rs 12.2 lakh crore; April to September Rs 6.55 lakh crore (+12.7%), but August -30% and September -3% | Mixed |
| Railway investments accelerating | Railway capex +23% in April to August; Railway Board at 64% of its annual target in H1 | Supported |
| Road pipeline strong | NHAI awards 3,124 km in FY26 against 4,008 km in FY25 (target about 4,500 km); road capex -77% in August | Contradicted |
| Urban infrastructure expanding | No metro, water or smart-city spending data found | Untested |
| Private capex gradually recovering | RBI: bank-financed capex Rs 3.2 lakh crore in FY27 against Rs 2.6 lakh crore; MoSPI survey: -16.5% to Rs 9.55 lakh crore | Split |
| Margins to improve as inputs stabilise | L&T EBITDA margin 8.7% against 10%; Bharat Dynamics about 6.1% against 16.3%; bitumen price shock reported | Contradicted |
| Strong balance sheets favoured | IRB net debt Rs 10,500 crore from Rs 12,500 crore; L&T finance costs -38% | Supported |
| Valuations depend on execution | No price or multiple data used | Untested |
| Institutional capital inflows | No flow data found | Untested |
Cite this table: Claims per the February PositionalCalls page; evidence per the Budget, CGA, Jefferies, Nuvama, RBI, MoSPI as reported, and my own result posts; originals not opened.
The pattern is that capex headlines were right in direction and incomplete in detail. Spending is up, but it is going to railways and defence, while the highway pipeline that supports road builders has slowed. That split matters more for a company than a sector label does. No stock view follows from this table.
3. Government capex in the infrastructure sector outlook 2026
The FY27 central capex budget is Rs 12.2 lakh crore, about 8.9% above the FY26 budget, and April to September spending was Rs 6.55 lakh crore, 53.6% of the target and up about 12.7%, though August fell 30% and September 3%.
| Capex measure | Reading | Source |
|---|---|---|
| FY27 central capex budget | Rs 12.2 lakh crore (about 8.9% above Rs 11.2 lakh crore in the FY26 budget, my calculation) | Outlook Business, 1 February 2026 |
| April to September 2026 central capex | Rs 6.55 lakh crore, 53.6% of Rs 12.22 lakh crore; up about 12.7% | CGA data via Lapaas Voice, 31 October 2026 |
| April to August 2026 central capex | Up 18% year on year; August down 30% | Jefferies via Asianet, 7 October 2026 |
| September 2026 central capex | Down about 3% year on year | CGA data via Lapaas Voice |
| CPSE capex, April to September | About Rs 4.30 trillion by 63 CPSEs, up nearly 12%; 51% of Rs 8.43 trillion target | Angel One, 8 October 2026 |
| Railway Board capex, April to September | Rs 1.88 trillion, 64% of its annual target | Angel One |
| NHAI capex, April to September | Rs 85,228 crore, nearly 46% of its target | Angel One |
| Transfers to states, first five months | Up 59% year on year | Jefferies via Asianet |
Cite this table: Capex data as reported by the sources named; the CGA and Jefferies figures use different periods and exclusions; originals not opened.
Two readings can both be true. Spending is ahead of last year, and the first-half total is above half of the budget, so the Budget is being met so far. But the monthly pattern is lumpy: August and September fell year on year, and Jefferies says growth of about 12% is needed in the remaining months to meet the budget. A second point is funding: in H1, central capex grew about 12.7% while net tax revenue grew about 3.8% and revenue receipts about 3.6%, and the fiscal deficit reached 42.1% of the full-year target against 36.5% a year earlier (CGA via Lapaas Voice). That comparison is mine, and the CGA cautions that monthly figures do not predict the full year. It suggests capex growth is outpacing revenue growth, which is a funding question for the second half.
4. Railways and defence in the infrastructure sector outlook 2026
Railway capex was up 23% and defence capex 38% in April to August, with road and rail together at 41% to 49% of their FY27 budgets, so the infrastructure sector outlook 2026 is strongest where spending is flowing to rail and defence.
| Segment, April to August 2026 | Central capex change | Note |
|---|---|---|
| Railways | +23% (August -4%) | Railway Board at 64% of its annual target in H1 (Angel One) |
| Defence | +38% (August +26%) | Against an 18% budgeted growth; about 31% of budgeted defence capex achieved |
| Roads | +2% (August -77%) | NHAI at about 46% of its target in H1 |
| Road and rail combined | 41% to 49% of FY27 budget achieved | Jefferies, as reported |
| Department of Economic Affairs allocation | Rs 163 billion for FY27, 77% below the FY26 budget of Rs 466 billion | FY26 revised estimate Rs 708 billion, 48% used |
Cite this table: Sector capex per Jefferies via Asianet (7 October 2026) and Angel One (8 October 2026), as reported; originals not opened.
Company results show how the spending reaches balance sheets, and not always evenly. RVNL reported consolidated profit of Rs 253.71 crore, up 10.1%, but revenue down 8.2%, per my RVNL Q2 results FY27 post. Bharat Dynamics profit fell 15% to Rs 183 crore (my Bharat Dynamics Q2 results FY27), even though defence capex is rising, and HAL reported its own result on 12 November (my HAL Q2 results FY27). Government spending is a condition for orders; it is not a guarantee of profit in a given quarter. I found no data for railway orders by company beyond those pages.
5. Roads and highways in the infrastructure sector outlook 2026
NHAI awarded 3,124 km in FY26, down from 4,008 km and short of about 4,500 km planned, and Nuvama says funding is a constraint, so the February claim of a strong road pipeline in the infrastructure sector outlook 2026 is contradicted.
| Road indicator | Reading | Source |
|---|---|---|
| NHAI awards, FY26 | 3,124 km, down from 4,008 km in FY25 (-22%, my calculation); about 4,500 km target missed | Nuvama via The Tribune, 2 September 2026 |
| NHAI awards, April to August 2026 | About 329 km, up 69%; August 95 km against 13 km a year earlier; July 127 km | Nuvama via The Tribune |
| Road construction, first four months FY27 | About 1,053 km, down 24%; August 182 km, down 12% | Nuvama via The Tribune |
| Road construction forecast, FY27 | 9,000 to 9,500 km (ICRA, 31 March 2026); FY26 base not stated | ICRA |
| NHAI budgetary support | Unchanged at Rs 1.87 lakh crore; extra-budgetary resources nil; road sector allocation +8% to Rs 2.94 lakh crore | Nuvama via The Tribune |
| Asset monetisation, FY26 | NHAI monetised Rs 28,078 crore through TOT and InvITs | ICRA |
| Media-reported FY27 plan | Awards of 5,200 km (+66%) and construction of 4,950 km (-7%) | Nuvama citing media reports; single source |
Cite this table: Road data per Nuvama via The Tribune, ICRA and press reports as reported; one headline gives the roads ministry allocation as Rs 3.09 lakh crore against Nuvama’s Rs 2.94 lakh crore for the road sector, and I could not reconcile them; originals not opened.
Awards are the leading indicator for road builders because a project awarded in a year becomes revenue over several years. The year-to-date awards rose 69%, but from a low base, and August’s 621% rise was off just 13 km. Nuvama says the lack of a budget increase for NHAI “accentuates concerns around road awards” and expects more reliance on toll-operate-transfer and InvIT monetisation. For an owner of operating roads such as IRB, the position is different: its Q2 profit rose 85% to Rs 260 crore and its net debt fell to Rs 10,500 crore from Rs 12,500 crore, per my earnings page. A Q2 FY27 headline reported a bitumen price shock stalling road work, which I did not open, so I do not quantify it.
6. Order books and execution in the infrastructure sector outlook 2026
L&T reported a record Q2 order inflow of Rs 1,47,665 crore, up 28%, with 63% from international markets, and an order book of Rs 8,53,514 crore, but its EBITDA margin fell to 8.7% from 10%, so a large order book did not lift margin.
PositionalCalls WhatsApp channel
Track capex data plainly
- Sector data without tips
- Monthly capex and awards checks
- A message when this page is updated
| Company, Q2 FY27 | Order and profit data | Order book to revenue (my calculation) | Margin reading |
|---|---|---|---|
| L&T | Inflow Rs 1,47,665 crore (+28%, 63% international); order book Rs 8,53,514 crore; profit Rs 5,202 crore (+33%) | About 2.9 times | EBITDA margin 8.7% against 10% |
| NBCC | Profit Rs 210 crore (+33.9%) | About 7.4 to 7.9 times | Per my NBCC post |
| RVNL | Consolidated profit Rs 253.71 crore (+10.1%); revenue Rs 4,700.96 crore (-8.2%) | About 5.2 times | Not stated |
| Thermax | Profit Rs 113 crore (-5.3%) | About 1.4 times | Not stated |
| Bharat Dynamics | Profit Rs 183 crore (-15%) | Not computed | About 6.1% against 16.3% |
| IRB Infrastructure | Profit Rs 260 crore (+85%) | Not applicable (toll roads) | Overall 57%; construction segment 15% against 18% |
Cite this table: Company data per my infrastructure earnings page and result posts, drawn from press reports; ratios are my calculation; filings not opened; the rows are not added.
The order book to revenue ratio shows how many years of current revenue is already contracted, but it says nothing about margin or about collection. Six companies, three business models and different bases mean the rows should not be added. The point for the infrastructure sector outlook 2026 is that order wins and profit moved apart: L&T won a record inflow and its margin fell, and RVNL held an order book of about five years of revenue while revenue fell 8.2%. See my infrastructure sector earnings page and Thermax Q2 results FY27 for the detail.
7. Private capex in the infrastructure sector outlook 2026
Two sources disagree: the RBI sees bank, ECB and IPO-financed private capex rising to Rs 3.2 lakh crore in FY27 from Rs 2.6 lakh crore, while a MoSPI survey shows private capex falling 16.5% to Rs 9.55 lakh crore, so private recovery in the infrastructure sector outlook 2026 is unproven.
| Source | FY27 reading | FY26 comparison | What it covers |
|---|---|---|---|
| RBI (via Business Today, 29 September 2026) | Rs 3.2 lakh crore envisaged | Rs 2.6 lakh crore | Capex financed by banks, financial institutions, ECBs and IPOs |
| RBI project pipeline | Not applicable | Investment intentions Rs 5.6 lakh crore across 1,839 projects (Rs 5 lakh crore, 1,581 in FY25); sanctions Rs 4.4 lakh crore | Banks financed about 55% of project cost; infrastructure 54.2% of sanctioned cost; 89.2% greenfield |
| MoSPI capex survey (via Deccan Chronicle, 24 March 2026) | Rs 9.55 lakh crore estimated | Rs 11.43 lakh crore provisional; -16.5% | Private enterprises; 5,366 responded; conservative reporting noted |
| NIPFP policy brief (August 2026, via Business Today) | Not applicable | Private investment 10.3% of GDP in FY25, from 10.9% in FY23 | Announcements Rs 104 lakh crore in FY24 to FY26, but companies accumulating cash |
Cite this table: Private capex data per the sources named, as reported; the sources cover different populations and are not like for like; originals not opened.
The two readings are not necessarily a contradiction. The RBI figure is for projects with external financing and counts intentions; the MoSPI figure is a survey of enterprises’ own plans, and the survey notes that respondents tend to be conservative. In FY25, the MoSPI realisation was 96.3% of intention. The RBI itself warns that delays, changes and cancellations can reduce realised investment, and NIPFP argues that announcements have not converted into spending. The old claim that private capex was gradually recovering is therefore untested. A mix shift is visible: NIPFP says renewables, conventional energy and IT-enabled services rose to 38% of private investment in FY24 to FY26 from 25%, which is relevant for engineering and power-equipment companies more than for road builders. See my energy and PSU sector outlook 2026 for the energy side.
8. Costs, margins and rates in the infrastructure sector outlook 2026
Margins are under pressure from costs and finance: L&T’s EBITDA margin fell to 8.7% from 10%, CPI reached 6.09% in October, the repo rate is 5.50% after a 7 October rise, and ICRA expects another 25 basis points in December.
| Item | Reading | Source |
|---|---|---|
| L&T EBITDA margin, Q2 FY27 | 8.7% against 10%; EBITDA Rs 6,845 crore | My earnings page |
| L&T finance costs | Rs 473 crore, down 38% | My earnings page |
| IRB net debt | Rs 10,500 crore against Rs 12,500 crore | My earnings page |
| Bitumen | Headline: price shock stalled road work and tempered equipment demand | Autocar Professional headline; article not opened |
| CPI inflation, October 2026 | 6.09%, from 4.45% in July | My CPI post |
| Repo rate | 5.50% after a 25 basis point rise on 7 October | Aggregator page; RBI statement not opened |
| Rupee | About 7.5% weaker against the dollar, year on year in September | Bizom via Upstox |
| Steel, cement and copper prices | Not found | None |
Cite this table: Cost and rate data as reported; commodity prices for steel, cement and copper were not found, so I make no claim on them.
The old page said margins would improve gradually as input costs stabilised. The evidence is the other way for the quarter: L&T’s margin fell and Bharat Dynamics’ fell sharply, although IRB’s overall margin rose. Higher rates matter for capital-intensive projects, as the February page noted, but companies differ: L&T’s finance costs fell 38% and IRB’s net debt fell, so balance-sheet repair is visible at those two. Rate-sensitive builders without such repair are a different case, which I could not assess. See my India CPI inflation October 2026 post, banking sector outlook 2026 and consumption sector outlook 2026 for the rate and inflation backdrop.
9. Segments in the infrastructure sector outlook 2026
Segments differ in the infrastructure sector outlook 2026: rail and defence have spending momentum, roads have slow awards, urban projects have no data, and private industrial capex is split, so no single reading covers the sector.
| Segment | What the data shows | What it cannot yet say |
|---|---|---|
| Railways | Capex +23% in April to August; Railway Board 64% of target; RVNL profit +10.1%, revenue -8.2% | Order conversion by company; Q3 spending |
| Defence | Capex +38% in April to August; Bharat Dynamics profit -15% | Why profit lagged spending; HAL detail |
| Roads and highways | Awards 3,124 km in FY26; road capex +2% in April to August; IRB profit +85% | Whether FY27 awards recover; funding path for NHAI |
| Construction and EPC | L&T inflow +28%, margin 8.7%; NBCC profit +33.9% | Margin trend; collection and working capital |
| Power and capital goods | Thermax profit -5.3%; private capex mix moving to renewables and power | Order inflow by company |
| Urban infrastructure | No spending data found | Everything |
Cite this table: Segment readings per Jefferies, Nuvama, the RBI as reported and my result posts; filings not opened.
The “infrastructure” label bundles very different businesses, which is why a sector headline can mislead. A toll-road owner, a railway contractor, a defence manufacturer and a power-equipment maker respond to different spending lines, and the data above separates them.
10. What to watch next in the infrastructure sector outlook 2026
The infrastructure sector outlook 2026 turns on five observable items: monthly central capex, NHAI awards and funding, private capex realisation, input costs and rates, and the Q3 FY27 order inflows and margins, which I expect in January to February 2027 though I found no dates.
| Watch item | A stronger reading | A weaker reading |
|---|---|---|
| Monthly central capex (CGA) | Capex growth resumes above the roughly 12% needed after the August and September dips | Further monthly falls and a shortfall against the Rs 12.2 lakh crore budget |
| NHAI awards and funding | Awards sustain above last year and funding is clarified | Awards fall back and monetisation is the only source |
| Private capex realisation | RBI-sanctioned projects convert into spending | The MoSPI decline proves right and projects are cancelled |
| Input costs and rates | Bitumen, steel and cement ease; no further hike | Costs stay high; another rate rise in December |
| Q3 order inflows and margins | Inflows hold and margins recover | Inflows hold and margins stay thin |
| Fiscal funding | Revenue growth catches up with capex growth | Deficit share keeps rising ahead of the year-end |
Cite this table: Watch list by PositionalCalls; these are conditions to check, not forecasts or probabilities.
This is a checklist, not a forecast. I assign no probability and no target to any item.
11. What are the risks in the infrastructure sector outlook 2026?
The main risks are a shortfall in central capex against the budget, weak highway awards and NHAI funding, private projects not converting into spending, thin margins, and higher rates and input costs.
The February page listed execution delays, land acquisition, commodity volatility and policy shifts. Those general risks remain, and the data above shows which of them are already visible: funding, awards and costs.
12. What most people miss in the infrastructure sector outlook 2026, and how to check
- What stands out: a Rs 12.2 lakh crore capex budget and a Rs 8,53,514 crore L&T order book sit beside a 3,124 km highway award year and falling margins.
- Easy to miss: capex headlines combine rail, road and defence, which moved in different directions, and the first-half total hides a 30% fall in August.
- What would change the picture: monthly CGA capex, NHAI funding, private capex realisation and the Q3 margins.
- Caution: this page does not say which infrastructure stock to buy, and it has no valuation or flow data.
- Split the capex: look at rail, road and defence separately, not the headline.
- Check awards, not only capex: awards decide revenue two to three years out.
- Check order book against revenue: years of work contracted, and whether margin holds.
- Check the basis: standalone or consolidated, and the year-ago base.
- Compare private capex sources: know what each covers before using it.
- Check finance costs and net debt: a large order book needs funding.
- Check valuation separately: use current prices from the exchange; this page does not.
For other sectors see my energy and PSU sector outlook 2026, auto sector outlook 2026 and banking sector outlook 2026. For the company numbers behind this page, see my infrastructure sector earnings page.
Bottom line
The infrastructure sector outlook 2026 is mixed. Central capex is on track at 53.6% of the budget and railway and defence spending are up, but August and September fell, highway awards were weak, private capex data conflicts, and margins were thinner despite record order books. The February claims of a strong road pipeline and improving margins are not supported. Watch monthly capex, NHAI funding and the Q3 results, and read the filings.
Next read: see the data on the infrastructure sector earnings page.
Part of the Sector Outlook series on PositionalCalls.
PositionalCalls WhatsApp channel
Keep the infrastructure outlook in one place
- Order book and margin updates
- Capex and rate watch
- Updates when new data is out
FAQs on the infrastructure sector outlook 2026
What is the infrastructure sector outlook 2026?
The infrastructure sector outlook 2026 is mixed on the data I found. Central capex is Rs 6.55 lakh crore for April to September, 53.6% of the Rs 12.22 lakh crore budget, and rail and defence spending are up. But highway awards fell to 3,124 km in FY26, private capex sources conflict, and L&T’s margin fell. I give no stock view.
How much is the government spending on capex in FY27?
The FY27 central capex budget is Rs 12.2 lakh crore, about 8.9% above the FY26 budget of Rs 11.2 lakh crore (my calculation). April to September spending was Rs 6.55 lakh crore, up about 12.7%, but August fell 30% and September about 3%. Jefferies says growth of about 12% is needed in the remaining months to meet the budget.
Are railways driving the infrastructure sector outlook 2026?
Railway spending is the clearest support. Railway capex was up 23% in April to August, and the Railway Board had spent Rs 1.88 trillion, 64% of its annual target, in the first half. Defence capex was up 38%. But RVNL revenue fell 8.2% in Q2, so spending does not always reach company revenue in the same quarter.
Why are highway awards weak in the infrastructure sector outlook 2026?
Nuvama reports NHAI awarded 3,124 km in FY26 against 4,008 km in FY25, below a target of about 4,500 km, with funding constraints: budget support is unchanged at Rs 1.87 lakh crore and extra-budgetary resources are nil. Year-to-date awards rose 69% to about 329 km, but off a low base. Media reports of a 5,200 km FY27 plan are a single source.
Is private capex recovering in the infrastructure sector outlook 2026?
The data conflicts. The RBI sees bank, ECB and IPO-financed capex of Rs 3.2 lakh crore in FY27 against Rs 2.6 lakh crore in FY26. A MoSPI survey shows private capex of Rs 9.55 lakh crore, down 16.5% from Rs 11.43 lakh crore. They cover different populations, and NIPFP says announcements have not converted into spending. The recovery claim is untested.
Did L&T order inflow rise in Q2 FY27?
Yes. L&T reported a record quarterly order inflow of Rs 1,47,665 crore, up 28%, with 63% from international markets, and an order book of Rs 8,53,514 crore. Its profit rose 33% to Rs 5,202 crore, but its EBITDA margin fell to 8.7% from 10%. I calculate the order book at about 2.9 times revenue. These are press-based figures.
Are margins improving for infrastructure companies?
Not as a sector statement. L&T’s EBITDA margin fell to 8.7% from 10% and Bharat Dynamics’ to about 6.1% from 16.3% in Q2 FY27, while IRB’s overall margin rose to 57%. A headline reported a bitumen price shock stalling road work, which I did not open. I found no steel, cement or copper price series, so I make no claim on them.
How do rates and inflation affect the infrastructure sector outlook 2026?
CPI inflation reached 6.09% in October from 4.45% in July, and the repo rate rose 25 basis points to 5.50% on 7 October, per an aggregator page. ICRA expects another 25 basis points in December, which is one firm’s view. Higher rates raise project financing costs, although L&T finance costs fell 38% and IRB’s net debt fell.
Does this page say which infrastructure stocks to buy?
No. This page names no stock to buy and gives no rating or target. It reports capex, award, order and margin data and says where data is missing, such as valuation, institutional flows and urban infrastructure spending. Company-level facts are in my earnings and result pages. Read the filings and consider a registered adviser before investing.
How is the infrastructure sector outlook 2026 page different from the earnings page?
This page looks forward and tests the old outlook claims against government capex, highway awards, private capex and cost data. The infrastructure sector earnings page holds the Q2 FY27 company tables for L&T, IRB, NBCC, RVNL, Bharat Dynamics and Thermax. Use the earnings page for results, and this one for the conditions that may shape the next two quarters.
Sources
- Outlook Business: Budget 2026, capex for FY27 raised to Rs 12.2 lakh crore; Budget capex, 1 February 2026.
- Lapaas Voice: India’s fiscal deficit reaches 42.1% of FY27 target in first half; CGA data for April to September 2026.
- Asianet Newsable: Govt capex dips 30% in August but still ahead of FY27 budget target; Jefferies sector split, 7 October 2026.
- Angel One: CPSE capex reaches 51% of FY27 target in first half; CPSE, Railway Board and NHAI capex, 8 October 2026.
- The Tribune: NHAI road project awards surge in August but funding concerns weigh (Nuvama); awards and funding, 2 September 2026.
- ICRA: Road construction likely to moderate to 9,000 to 9,500 km in FY2027; road forecast, dated 31 March 2026.
- Business Today: Private capex puzzle, RBI pipeline and NIPFP view; RBI and NIPFP data, 29 September 2026.
- Deccan Chronicle: India’s private capex to fall 16.5% in FY27, govt survey; MoSPI survey, 24 March 2026.
- PositionalCalls: Infrastructure sector earnings Q2 FY27 (company data).
- PositionalCalls: India CPI inflation October 2026 (October CPI).
- Ministry of Statistics and Programme Implementation: official data and surveys.
- Controller General of Accounts: monthly central government accounts.
- Reserve Bank of India: official policy statements and bulletins.
- Named, not linked: the Autocar Professional bitumen headline, and an aggregator page for the 7 October repo rate rise. I opened none of the original reports or any BSE or NSE filing for this page.

Shubham Chaudhary is the founder of PositionalCalls, an independent Indian stock market research website. He writes company fundamentals, quarterly results analysis, IPO analysis and sector research for NSE and BSE listed companies, with a focus on banking stocks, insurance and long-term value investing. Every article is built from primary sources such as RBI, SEBI, NSE and BSE filings and company annual reports, and states its risks plainly in simple language for retail investors.
Coverage areas Our research standards- Numbers checked against NSE, BSE and SEBI filings
- Risks and limits stated in every article
- No paid promotions or broker tie-ups
- Articles updated when new filings arrive