
Sector Outlook · Cement
This cement sector outlook 2026 page tests ICRA volume data, fuel costs and Q2 FY27 results of four cement makers against dated sources, records where numbers disagree and gives no stock picks.
Quick answer
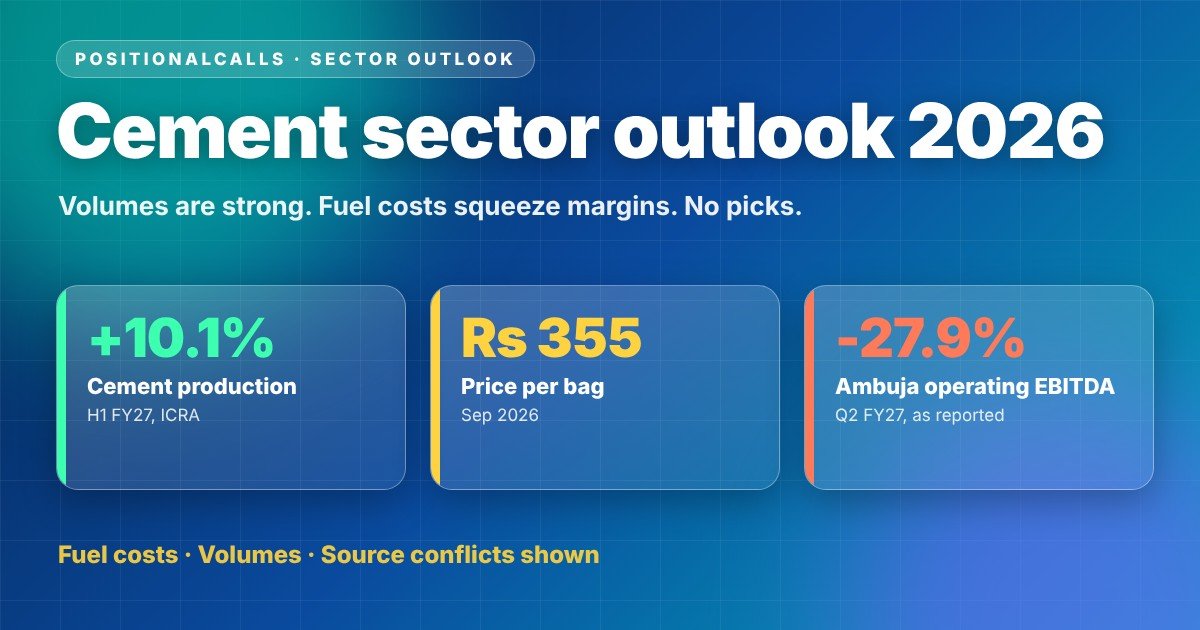
The cement sector outlook 2026 is strong volumes with squeezed profit per tonne. ICRA reports volumes up 10.1% in H1 FY27 and UltraTech grew domestic volume 13.8%, but fuel costs cut EBITDA per tonne at Ambuja and Shree Cement. Prices recovered about 2% in September, and lower oil prices may help in H2.
Key takeaways on the cement sector outlook 2026
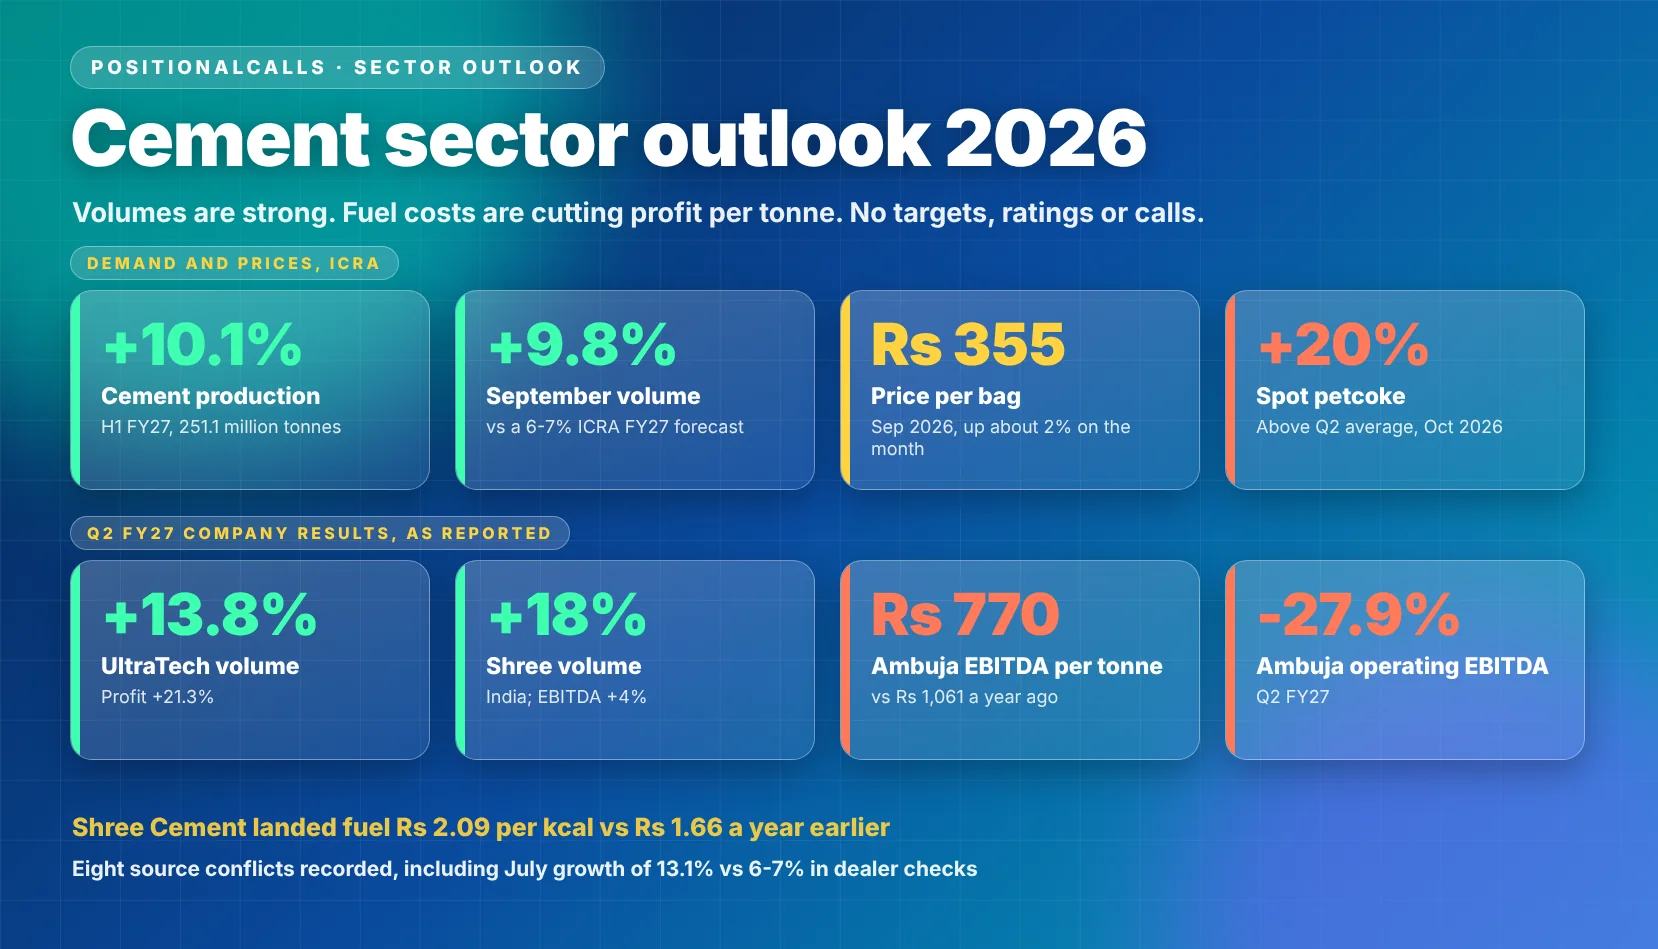
- Demand: ICRA reports production up 10.1% in H1 FY27, against its own full-year forecast of 6% to 7%.
- Prices: the average price reached Rs 355 per bag in September 2026, up about 2% on the month.
- Costs: spot petcoke and imported coal were about 20% and 16% above Q2 averages in October.
- Profit: Q2 FY27 profit rose at UltraTech while operating EBITDA fell 27.9% at Ambuja.
- Doubt: eight source conflicts are recorded, including industry volume growth.
In plain words: India is building and selling more cement, and prices have started to recover. But the fuel burned to make it costs much more than last year, so companies earn less on each tonne even when they sell more.
Data note: as of Saturday, 21 November 2026, 1:00 PM IST. Industry figures are from ICRA monthly updates and the Ministry of Commerce and Industry core-sector release, as relayed by the sources named. Company figures are from Q2 FY27 results for the quarter ended 30 September 2026, as relayed by the sources named. I did not open the exchange filings, and lines marked as my arithmetic are my own calculation.
Cement sector outlook 2026: where does the sector stand in November 2026?
The cement sector outlook 2026 shows demand that has run ahead of forecasts, with a fuel-cost problem that has cut profit per tonne. Cement is a heavy, low-margin product where plant utilisation, fuel and freight decide profit, so volume growth and profit growth can move in opposite directions. The table collects the latest dated figures this page uses.
| Measure | Latest figure | Period | Source named |
|---|---|---|---|
| Cement production | Up 10.1% to 251.1 million tonnes; September up 9.8% | H1 FY27 and September 2026 | ICRA, 28 October 2026 |
| Average cement price | Rs 355 per bag, up about 2% on the month; about Rs 350 in H1 FY27, down about 1% year on year | September 2026 and H1 FY27 | ICRA |
| ICRA full-year volume forecast | 6% to 7% growth on a higher base | FY2027 | ICRA |
| Core-sector output | Up 7.9%, a series high; cement up 10.1% over April to September | September 2026 | Policy Edge, ThePrint |
| UltraTech domestic grey volume | Up 13.8% to 35.94 million tonnes; utilisation 71% against 66% | Q2 FY27 | Free Press Journal, Lakshmishree |
| Ambuja operating EBITDA per tonne | Rs 770 against Rs 1,061 | Q2 FY27 | Investing.com, Indmoney |
Cite this table: Cement sector snapshot, PositionalCalls, Saturday, 21 November 2026, 1:00 PM IST, figures as reported by the sources named.
Two readings of this table are worth keeping apart. The first is demand: production is growing at about 10%, the core-sector index shows cement among the strongest segments, and the largest producers are growing faster than the industry. The second is cost: imported coal and petcoke cost more than a year ago, and prices rose too slowly to cover it. This page treats demand as supported by official and ICRA data and cost as the open question.
The volume data also need a caution. ICRA’s monthly figures show growth near 10%, channel checks cited by Construction World put July and August growth at 6% to 7%, and Shree Cement’s management estimated industry growth at 7% to 10%. The conflicts section sets these side by side, because a production count and a dealer survey measure different things in any cement sector outlook 2026 article.
What do the data show about demand in the cement sector outlook 2026?
Demand is growing near 10% in production terms, and the larger groups are growing faster than the industry. The table sets the monthly ICRA figures next to each other. ICRA’s source for production is the Office of the Economic Adviser’s core-industries index.
| Period | Production growth | Volume | Price per bag | Source named |
|---|---|---|---|---|
| June 2026 | 9.8% year on year | 44.8 million tonnes | Rs 345, down about 1% on the month | ICRA, 28 July 2026 |
| July 2026 | 13.1% year on year | 42.3 million tonnes | Rs 345 | ICRA, 27 August 2026 |
| September 2026 | 9.8% year on year | Not stated in the excerpt | Rs 355, up about 2% on the month | ICRA, 28 October 2026 |
| H1 FY27 | 10.1% year on year | 251.1 million tonnes | About Rs 350, down about 1% year on year | ICRA, 28 October 2026 |
Cite this table: Cement production and prices by period, PositionalCalls, Saturday, 21 November 2026, 1:00 PM IST, ICRA data as reported; August 2026 is not shown because it was not in the excerpts read.
The strength is not confined to cement. The core-sector index grew 7.9% in September 2026, a series high, and Policy Edge reported that cement grew 10.1% over April to September against 10.2% for electricity and 21.2% for iron ore. Infrastructure and housing demand underpins this, and the related pages on this site cover them: see infrastructure sector outlook 2026 and real estate sector outlook 2026.
Will volume growth hold in the cement sector outlook 2026?
ICRA expects growth to moderate to 6% to 7% in FY2027 on a higher base, especially in the second half of FY2026, after cement volumes grew 8.6% in FY2026. It also says volumes remain exposed to downside risks if GDP growth turns out softer than earlier estimates. Companies are more optimistic: The Pioneer reported that companies expected FY27 volume growth of 7% to 8%, and UltraTech targets double-digit volume growth, against an industry estimate of about 6.5% in its call summary.
Tax also played a part. The GST rate on cement fell from 28% to 18% on 22 September 2025, according to Business Standard’s report on an Elara Capital note. The cut falls inside the comparison period, so a six-month view is safer than a single month.
How do prices and fuel costs shape the cement sector outlook 2026?
Fuel costs rose faster than prices, and that gap explains most of the fall in profit per tonne. Cement kilns burn petcoke and imported coal, so global fuel prices pass through to margins within a quarter or two. The table sets the cost evidence side by side.
| Item | Reported figure | Period | Source named |
|---|---|---|---|
| Spot petcoke | About US$175 per tonne, about 20% above the Q2 average | October 2026 | Construction World, on Emkay Research |
| Spot imported coal | About US$150 per tonne, about 16% above the Q2 average | October 2026 | Construction World, on Emkay Research |
| Shree Cement landed fuel cost | Rs 2.09 per kilocalorie against Rs 1.66 a year earlier | Q2 FY27 | Investing.com call transcript |
| Ambuja cost per tonne | Rs 4,410; Rs 4,182 excluding a management-estimated geopolitical impact | Q2 FY27 | Indmoney, The Machinemaker |
| UltraTech cost guidance | A cost increase of Rs 130 to Rs 140 per tonne in Q2 on fuel and monsoon maintenance | Q2 FY27 | Sovrenn call summary |
Cite this table: Cement input costs, PositionalCalls, Saturday, 21 November 2026, 1:00 PM IST, as reported; the geopolitical impact is a management estimate, not an audited figure.
Prices have been slower. ICRA shows the average at Rs 350 per bag in H1 FY27, about 1% lower than a year earlier, and Rs 355 in September. Construction World reported that a Rs 20 per bag increase in the South in August did not hold, and that dealers planned a further Rs 25 to Rs 30 from 5 September with uncertain staying power. Emkay Research expected a Rs 10 to Rs 15 per bag rise from mid-October.
Could fuel costs ease in the cement sector outlook 2026?
Systematix said on 12 November 2026 that oil prices had fallen sharply in recent weeks and that petcoke and coal prices should follow with a delay, which would help profitability in the second half of FY27. That is a forecast, not a result. Spot fuel was far above Q2 averages in October, and a plant burns fuel bought weeks earlier, so the benefit would reach reported margins in Q3 or Q4 at the earliest.
For the policy backdrop, including funding costs for construction and housing, see RBI repo rate.
What did cement companies report for Q2 FY27 in the cement sector outlook 2026?
Four large makers reported volume changes from down 3% to up 18%, and EBITDA per tonne fell at the two that reported it. The table lists each result as reported, with the period and the source. Figures are for the quarter ended 30 September 2026.
| Company | Q2 FY27 volume | Q2 FY27 revenue and profit | Source named |
|---|---|---|---|
| UltraTech Cement | Domestic grey 35.94 million tonnes, up 13.8%; consolidated up 12.9% | Net sales Rs 23,024 crore, up 18.9%; profit attributable Rs 1,493.77 crore, up 21.3% | Aditya Birla Group release, Lakshmishree |
| Ambuja Cements | 16.5 million tonnes against 16.6, broadly flat | Operating EBITDA Rs 1,271 crore, down 27.9%; margin 13.8% against 19.2% | Indmoney, Investing.com |
| Shree Cement | India 9.31 million tonnes, up 18%; consolidated 10.52 million tonnes, up 14% | Revenue Rs 5,897 crore, up 24%; EBITDA Rs 1,016 crore, up 4% | Scanx, Investing.com |
| ACC | 9.72 million tonnes against 10 million, down about 3% | Revenue Rs 5,689 crore; trade share 78%, premium 47% of trade sales | Newkerala, Trendlyne |
Cite this table: Cement Q2 FY27 results, PositionalCalls, Saturday, 21 November 2026, 1:00 PM IST, as reported; this page does not rank the companies.
UltraTech is the exception on profit: operating profit before interest, depreciation and tax rose 17.3% to Rs 3,832 crore, and profit attributable to owners rose 21.3%. Against the first quarter, profit fell about 42.5% from Rs 2,599.28 crore, according to Nifty Trader, which is a reminder that Q2 is the seasonally weak monsoon quarter. At Shree Cement revenue grew 24% but EBITDA only 4%, which is the gap between volume growth and profit per tonne in one line.
What happened to profit per tonne in the cement sector outlook 2026?
| Company | EBITDA per tonne | Year earlier | Realisation or price reported |
|---|---|---|---|
| Ambuja Cements | Rs 770; Rs 998 excluding the management-estimated impact | Rs 1,061 | Net selling price Rs 255 per bag against Rs 258 |
| Shree Cement | Rs 966 | Rs 1,055 in most reports; Rs 1,111 in one transcript | India realisation Rs 4,870 per tonne against Rs 4,840 |
| UltraTech Cement | Not stated in the sources read | Not stated | Domestic grey realisation Rs 5,176 per tonne, up 2% |
| ACC | Not stated in the sources read | Not stated | Premium products 47% of trade sales |
Cite this table: EBITDA per tonne and realisation, PositionalCalls, Saturday, 21 November 2026, 1:00 PM IST, as reported; EBITDA per tonne is defined differently by each company.
Realisation barely moved at Ambuja and Shree Cement, while fuel cost rose, so profit per tonne fell. UltraTech’s realisation rose 2%, which helped. Ambuja put the geopolitical impact at Rs 228 per tonne, a management estimate that lifts its EBITDA per tonne to Rs 998, still below last year’s Rs 1,061.
PositionalCalls WhatsApp channel
Follow sector pages in one place
- New sector outlooks as they are posted
- Results summaries without tips
- A message when a page is updated
What about mid-sized makers in the cement sector outlook 2026?
I did not find Q2 FY27 results for mid-sized makers in the sources read, so the table shows the June 2026 quarter, which is Q1 FY27, as reported by The Pioneer on 16 August 2026. It is context, not Q2 evidence.
| Company | Q1 FY27 profit change | Q1 FY27 revenue | Q1 FY27 volume |
|---|---|---|---|
| Dalmia Bharat | Down 51.4% to Rs 192 crore, largely on exceptional items | Rs 3,890 crore, up 7% | 7.6 million tonnes, up 9% |
| JK Lakshmi Cement | Down 27.9% to Rs 108.07 crore | Rs 1,904.78 crore, up 9.4% | 3.59 million tonnes, up 8.17% |
| Birla Corporation | Down 3.2% to Rs 115.73 crore | Rs 2,646.45 crore, up 7.8% | Not reported |
| Nuvoco Vistas | Up 19.87% to Rs 159.63 crore | Rs 3,128.71 crore, up 8.9% | 5.3 million tonnes, up 5% |
Cite this table: Mid-sized cement makers, Q1 FY27, PositionalCalls, Saturday, 21 November 2026, 1:00 PM IST, as reported by The Pioneer; Q2 FY27 not checked.
Where do sources disagree on the cement sector outlook 2026?
Eight conflicts appear in the data, and each changes how strong a number looks. The table shows both versions and the one this page uses.
| Item | Version A | Version B | How this page handles it |
|---|---|---|---|
| Industry volume growth, July and August 2026 | 13.1% for July (ICRA production data) | 6% to 7% for July and August (channel checks, Construction World) | Shows both; production counts and dealer surveys differ |
| UltraTech Q2 profit | Rs 1,493.77 crore attributable to the parent (Lakshmishree) | Rs 1,501 crore total profit (Free Press Journal, InCred, Sovrenn) | Uses Rs 1,493.77 crore attributable |
| UltraTech Q2 revenue | Net sales Rs 23,024 crore (company release) | Revenue from operations Rs 23,295.1 crore (Multibagg, Lapaas Voice) | Uses net sales; the two are different measures |
| UltraTech operating profit | PBIDT Rs 3,832 crore, up 17.3% (company release) | Rs 3,721 crore, up 20% (Sovrenn) | Uses the company release figure |
| Shree Cement EBITDA per tonne, year earlier | Rs 1,055 (Investing.com, Multibagg) | Rs 1,111 in one transcript copy, which also gives year-earlier EBITDA as Rs 1,272 crore | Uses Rs 1,055 and Rs 974 crore |
| Shree Cement volume | India 9.31 million tonnes, consolidated 10.52 million tonnes (Investing.com) | 9.31 million tonnes called consolidated (Investywise) | Uses India 9.31 and consolidated 10.52 |
| ACC Q2 revenue | Rs 5,689 crore (Newkerala) | Rs 5,656 crore (Trendlyne) | Shows both; filing not opened |
| Ambuja EBITDA per tonne | Rs 770 reported | Rs 998 excluding a management-estimated geopolitical impact | Uses the reported figure and labels the estimate |
Cite this table: Source conflicts in cement data, PositionalCalls, Saturday, 21 November 2026, 1:00 PM IST, as recorded from the sources named.
Most of these are definition gaps: net sales against revenue from operations, parent against total profit, India against consolidated volume. The one that changes the reading is the volume split. The two counts cannot both describe the same demand, and I did not find a source that reconciles them. The cement sector outlook 2026 on this page therefore leans on both and trusts neither alone.
What are the risks to the cement sector outlook 2026?
Six risks could make the cement sector outlook 2026 wrong, and two are visible in reported numbers. Red marks risks that already show in results, amber marks measures to watch, and blue marks risks that depend on future events.
How do the six risks connect?
The risks feed each other. Expensive fuel squeezes profit per tonne, which pushes makers to raise prices, but new capacity and a monsoon-weak quarter make increases hard to hold. If demand slows on a higher base in the second half, lower utilisation raises cost per tonne again. That chain is why this page treats one quarter of volume growth as a signal to check, not a conclusion.
Bottom line
The cement sector outlook 2026 is strong on volume and uncertain on margin. Production is growing near 10%, prices have started to recover, and UltraTech’s profit grew, but fuel costs cut profit per tonne at Ambuja and Shree Cement, and the data on industry growth do not agree.
What should you watch next in the cement sector outlook 2026?
Watch ICRA’s October update, the core-sector release and Q3 FY27 results. The table gives each item and the figure to compare it against.
| Item to watch | Why it matters | Compare against |
|---|---|---|
| ICRA monthly update for October 2026, late November | Shows whether production growth stays near 10% | September: 9.8% year on year |
| Average cement price per bag, October and November | Tests whether the mid-October increase held | September: Rs 355 per bag |
| Petcoke and coal prices in Q3 results | Tests whether lower oil prices reach plants | October spot: about US$175 and US$150 per tonne |
| EBITDA per tonne at Ambuja and Shree Cement in Q3 | Tests margin recovery | Q2: Rs 770 and Rs 966 |
| Core-sector release for October 2026 | Shows cement output against the index | September: index up 7.9%; cement up 10.1% over April to September |
| Second-half volume growth against ICRA’s forecast | Tests the 6% to 7% full-year view | H1 FY27: 10.1% |
Cite this table: Cement watch list, PositionalCalls, Saturday, 21 November 2026, 1:00 PM IST, dates as reported; later dates may move.
Monthly production data arrive faster than company results, but they say nothing about profit. If your decision depends on margins, use the quarterly company results and the per-tonne figures, because they include fuel and realisation that the production count does not.
How should you read cement data in the cement sector outlook 2026?
Read volume first, then price, then cost per tonne, and never treat one quarter as a trend. The steps below work for any cement company or industry release.
- Check whether the figure is industry production, company sales volume or dealer survey growth, because they differ.
- Check whether profit is parent, total or EBITDA, and whether revenue is net sales or revenue from operations.
- Read EBITDA per tonne next to realisation, since volume growth can hide falling profit per tonne.
- Check whether an adjusted figure is a company estimate.
- Open the investor presentation when two sources give different figures.
What are the main cement measures?
| Measure | What it counts | Where it comes from | Common trap |
|---|---|---|---|
| Production volume | Tonnes of cement made in the country or by a company | ICRA, core-industries index | Differs from sales volume |
| Capacity utilisation | Output as a share of installed capacity | Company releases | Seasonal; Q2 is weak |
| Realisation | Revenue received per tonne sold | Company releases | Includes mix and freight |
| EBITDA per tonne | Operating profit before interest, tax and depreciation per tonne | Company results | Defined differently by each company |
| Net sales and revenue from operations | Sales after and before certain items | Company results | Not interchangeable |
Cite this table: Cement measures explained, PositionalCalls, Saturday, 21 November 2026, 1:00 PM IST, general definitions.
For a sector page, the useful question is whether volume growth is paying for its own fuel. In a year of rising inputs, check whether realisation rose as fast as cost per tonne. Check the date, since the sector picture moves, and this page carries its own Updated line.
What pages sit beside this cement page?
The infrastructure, real estate and metal outlooks give the demand and materials layer around cement.
- Sector hub: sector outlook India, the sector pages
- Demand drivers: infrastructure sector outlook 2026 and real estate sector outlook 2026
- Related materials: metal sector outlook 2026
- Costs and inflation: FMCG sector outlook 2026 and RBI repo rate
- Results: Q2 FY27 results scorecard and earnings calendar
This page is the sector view. It does not rank companies or give targets. Company results pages show the filings, so use them for that job.
Sources for this cement page
Every figure comes from the sources below, read on 21 November 2026. I did not open exchange filings, investor presentations or the full ICRA reports for each figure, so use the links to reach the primary source.
- ICRA: Cement volumes rose 9.8% year on year in September 2026, 28 October 2026
- ICRA: Cement volumes to grow by 6% to 7% in FY2027, 30 September 2026
- ICRA: Volumes rose 13.1% in July 2026, 27 August 2026
- ICRA: Volumes up 9.8% in June 2026, 28 July 2026
- The Policy Edge: Core industries grow 7.9% in September, 21 October 2026
- ThePrint: Core sector growth rises to 7.9% in September
- Business Today: Core sector growth accelerates to 7.9%, 21 October 2026
- Construction World: Cement prices likely to rise Rs 10 to Rs 15 per bag from mid-October
- Construction World: Cement demand strong as prices remain stable
- Global Cement: Cement makers in India expect lower fuel costs, Systematix, 12 November 2026
- Business Standard: Cement prices to remain weak despite demand, Elara Capital
- The Pioneer: Fuel, input costs squeeze cement companies’ margins, 16 August 2026
- Lokmat Times: Cement volumes to grow 6% to 7% in FY27, ICRA, 30 December 2025
- Aditya Birla Group: UltraTech Q2 FY27 press release
- Free Press Journal: UltraTech Cement reports 21.3% profit rise
- Lakshmishree: UltraTech Cement Q2 results
- Nifty Trader: UltraTech Cement Q2 FY27 results
- Multibagg: UltraTech Cement Q2 FY27 results
- InCred Money: UltraTech Cement Q2 FY27 results
- Sovrenn: UltraTech Cement Q2 FY27 results and call summary
- Lapaas Voice: UltraTech Cement Q2 profit rises 21%
- Indmoney: Ambuja Cements Q2 results analysis
- Investing.com: Ambuja Cements Q2 FY27 slides
- The Machinemaker: Ambuja Cements Q2 FY27 performance
- Investing.com: Shree Cement Q2 FY27 earnings call transcript
- Investing.com: Shree Cement Q2 FY27 earnings call transcript, second copy
- Multibagg: Shree Cement Q2 FY27
- Scanx: Shree Cement Q2 FY27 results
- Investywise: Shree Cement Q2 FY27
- Newkerala: ACC Q2 FY27 sales volume and revenue, 27 October 2026
- Trendlyne: Q2 FY27 result announced for ACC
Where a source is a news report on company data, the report is named, not the company. If any figure differs from the primary release, the primary release governs.
Disclaimer: PositionalCalls is not a SEBI-registered research analyst or investment adviser. This page is general information and gives no target, rating or buy or sell call. Figures may have changed since the date shown.
PositionalCalls WhatsApp channel
Keep sector updates together
- Quarterly result summaries
- Budget and policy changes
- Links to new sector pages
cement sector outlook 2026: frequently asked questions
What is the cement sector outlook 2026 for India?
Volumes are strong, but profit per tonne is under pressure. ICRA reports cement volumes up 10.1% in the first half of FY27, while UltraTech grew domestic volume 13.8% and Ambuja’s operating EBITDA fell 27.9% on fuel costs. Prices have started to recover. This page tests that view against dated data and makes no stock call.
How fast is cement demand growing in 2026?
ICRA reports production up 9.8% year on year in September 2026 and up 10.1% to 251.1 million tonnes in H1 FY27. ICRA still expects only 6% to 7% growth for the full year on a higher base. Channel checks put July and August growth at 6% to 7%, so the cement sector outlook 2026 has a visible data gap.
Why are cement margins falling in 2026?
Fuel costs rose faster than prices. Shree Cement’s landed fuel cost was Rs 2.09 per kilocalorie against Rs 1.66 a year earlier, and its EBITDA per tonne fell to Rs 966. Ambuja’s fell to Rs 770 from Rs 1,061. Spot petcoke and imported coal were about 20% and 16% above Q2 averages in October.
Are cement prices rising in 2026?
Slowly. ICRA reports the average price rose about 2% to Rs 355 per bag in September 2026, after prices fell about 1% year on year in H1 FY27. Emkay Research expected a Rs 10 to Rs 15 per bag increase from mid-October, but earlier increases did not hold in some regions. The cement sector outlook 2026 depends on whether this one holds.
Which cement companies reported Q2 FY27 results on this page?
Four: UltraTech Cement, Ambuja Cements, Shree Cement and ACC. UltraTech’s profit rose 21.3% on 13.8% domestic volume growth. Ambuja’s operating EBITDA fell 27.9%, Shree’s EBITDA rose 4% on 18% India volume growth, and ACC’s volume fell to 9.72 million tonnes. The page lists each result with its source and does not rank the companies.
Will lower oil prices help the cement sector outlook 2026?
Possibly, with a delay. Systematix said on 12 November 2026 that oil prices had fallen sharply in recent weeks and that petcoke and coal prices should follow, which would lift profitability in the second half of FY27. Spot fuel was far above Q2 averages in October, so the gain depends on how fast costs reach plants.
Why do sources disagree on cement numbers?
They mix net sales with revenue from operations, parent profit with total profit, and company figures with management estimates. UltraTech’s profit appears as Rs 1,501 crore and Rs 1,493.77 crore, and Shree Cement’s year-earlier EBITDA per tonne as Rs 1,055 and Rs 1,111. The cement sector outlook 2026 conflicts table lists each pair.
Does this cement sector outlook 2026 page recommend stocks?
No. PositionalCalls is not a SEBI-registered research analyst or investment adviser. This page reports company, ICRA and government figures with sources, labels its own arithmetic and records where sources disagree. It gives no target, rating or buy or sell call, and it leaves out brokerage picks. Open the filings before you decide anything.
What are the main risks in the cement sector outlook 2026?
Six risks: fuel costs staying high, price increases failing to hold, demand slowing on a higher base in H2, new capacity adding supply, rupee-driven import costs, and weak activity if construction slows. Ambuja put a management-estimated Rs 228 per tonne on the West Asia impact. Each risk is sourced in the risks section of this page.
How often is the cement sector outlook 2026 page updated?
After each monthly ICRA cement update, each core-sector release and each results season. ICRA’s September update came on 28 October 2026, and the core-sector release arrived on 21 October. Check the Updated line and the data note first, since every figure on this page carries the date of its source.

Shubham Chaudhary is the founder of PositionalCalls, an independent Indian stock market research website. He writes company fundamentals, quarterly results analysis, IPO analysis and sector research for NSE and BSE listed companies, with a focus on banking stocks, insurance and long-term value investing. Every article is built from primary sources such as RBI, SEBI, NSE and BSE filings and company annual reports, and states its risks plainly in simple language for retail investors.
Coverage areas Our research standards- Numbers checked against NSE, BSE and SEBI filings
- Risks and limits stated in every article
- No paid promotions or broker tie-ups
- Articles updated when new filings arrive