
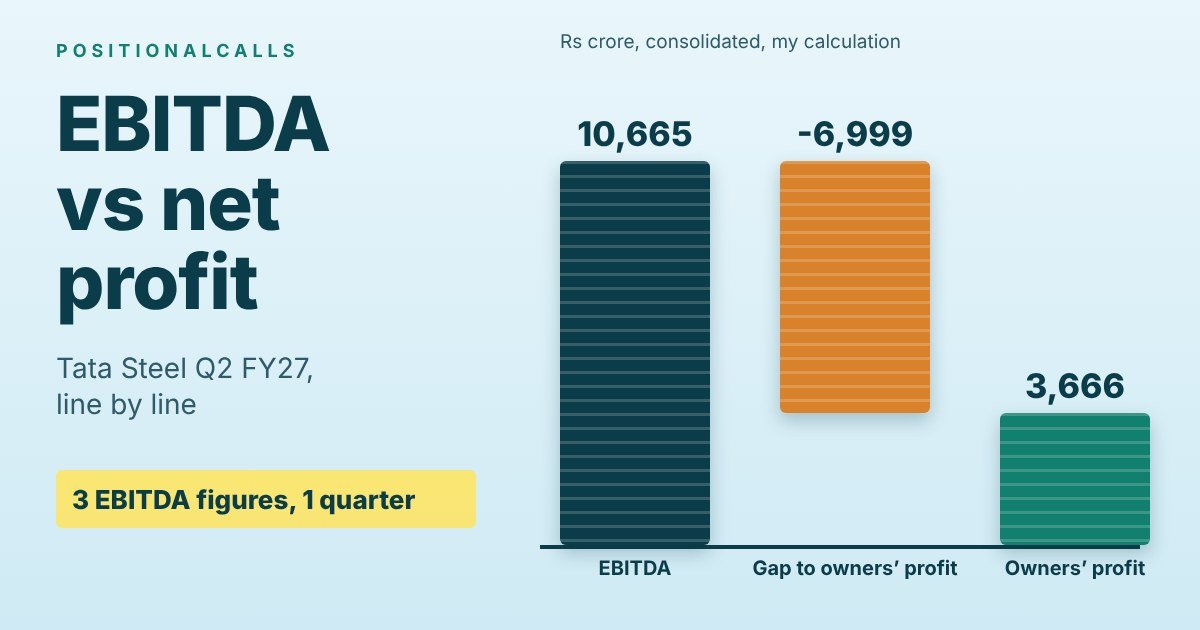
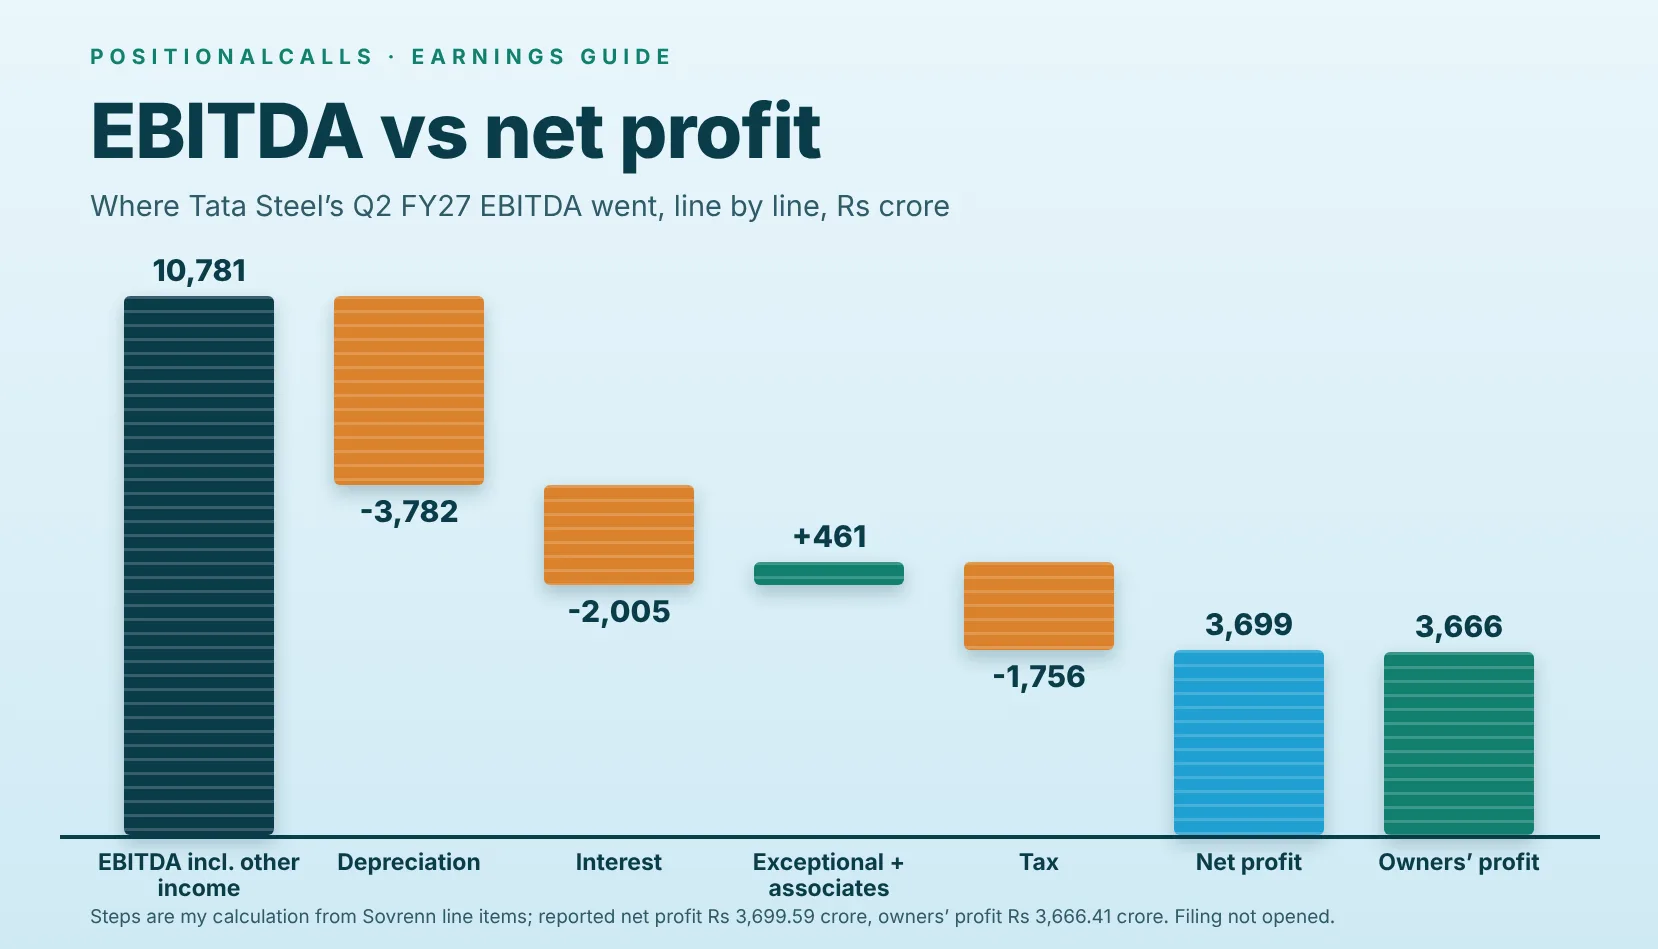
 EBITDA vs net profit: Tata Steel Q2 FY27, from EBITDA to owners’ profit.
Earnings · Learn
This guide to EBITDA vs net profit rebuilds Tata Steel’s Q2 FY27 filing from revenue to owners’ profit, shows where Rs 10,665 crore of EBITDA became Rs 3,666 crore, and tests the same gap on Jio Platforms and Ashok Leyland.
Quick answer
EBITDA vs net profit: EBITDA is operating profit before interest, tax, depreciation and amortisation, and net profit is what remains after all of them. Tata Steel’s Q2 FY27 EBITDA was Rs 10,665 crore, while its owners’ profit was Rs 3,666.41 crore, about 34% of EBITDA, my calculation.
Key takeaways on EBITDA vs net profit
- The gap is four costs: depreciation, interest and tax separate EBITDA from profit, and for Tata Steel depreciation alone was Rs 3,782 crore.
- Growth can diverge: Tata Steel’s EBITDA rose 17.1% but pre-exceptional profit before tax rose about 10%.
- Definitions differ: three EBITDA figures exist for one quarter, from Rs 10,533 crore to Rs 10,781 crore.
- Use owners’ profit per share: net profit includes minority shareholders’ share, Rs 33.18 crore here.
- One-offs matter: an exceptional gain of Rs 349 crore sat between EBITDA and profit in the quarter.
- Margins tell it fast: Tata Steel’s EBITDA margin was 16.3% and its net margin about 5.7%.
In plain words: EBITDA is what the business earned from running its operations before paying for its loans, its machines wearing out and its tax. Net profit is what is left after paying all of that. A company can look strong on EBITDA and thin on net profit if it owns many machines or owes a lot of money.
Data note: as of Sunday, 22 November 2026, 3:20 PM IST. Figures are for the quarter ended 30 September 2026 and come from the sources named in each line. The line items for Tata Steel come from Sovrenn’s consolidated table and the totals from news reports of the 7 November filing. I did not open the BSE or NSE filing, the auditor’s report or the company’s investor presentation, so check each figure there. This page is analysis only.
Latest update
- 22 November 2026: first version. Worked examples use the Q2 FY27 results of Tata Steel (7 November), Jio Platforms (30 October) and Ashok Leyland (14 November), as relayed by the sources named. The next update adds a Q3 FY27 case.
What is the difference between EBITDA vs net profit?
The difference between EBITDA vs net profit is four deductions: depreciation, amortisation, interest and tax. EBITDA stops before them and shows what operations earned, while net profit comes after them and shows what the company kept. Minority interest and exceptional items sit on the way down.
| Measure | Where it sits in the statement | What it leaves out | What it is good for |
|---|---|---|---|
| EBITDA | Revenue less operating costs, before depreciation, interest and tax | Depreciation, amortisation, interest, tax | Comparing operations across companies and quarters |
| Operating profit (EBIT) | EBITDA less depreciation and amortisation | Interest and tax | Seeing what the assets cost to use |
| Profit before tax | After interest, before tax | Tax | Comparing before tax rates differ |
| Net profit (PAT) | After tax, including minority share | Nothing, but it includes the minority share | The total earned by the whole group |
| Profit attributable to owners | Net profit less minority interest | The minority share | Earnings per share and valuation inputs |
Cite this table: The profit ladder from EBITDA to net profit, PositionalCalls, Sunday, 22 November 2026, 3:20 PM IST
Does EBITDA appear in the Indian income statement?
No. Per Petpooja’s summary of Schedule III of the Companies Act, 2013, the statement of profit and loss runs from revenue to profit before tax, with finance costs and depreciation as separate expense heads, and EBITDA has no legal definition in India. Companies still publish it in their results releases, so each company’s number depends on its own definition.
That is why a page on this topic has to start from a real filing. The next section rebuilds one.
EBITDA vs net profit on Tata Steel’s Q2 FY27 filing: the full ladder
Tata Steel’s Q2 FY27 filing takes Rs 65,436 crore of revenue down to Rs 3,699 crore of net profit in eleven steps, and the steps tie. The table uses the consolidated line items in Sovrenn’s results table for the quarter ended 30 September 2026, with the totals checked against news reports of the filing.
| Step | Line | Q2 FY27, Rs crore | Q2 FY26, Rs crore | Change |
|---|---|---|---|---|
| 1 | Revenue from operations | 65,436 | 58,689 | +11.5% |
| 2 | Operating profit (Sovrenn definition) | 10,533 | 8,897 | +18.4% |
| 3 | Add other income | 248 | 364 | -31.9% |
| 4 | EBITDA including other income (my calculation) | 10,781 | 9,261 | +16.4% |
| 5 | Less depreciation | 3,782 | 2,893 | +30.7% |
| 6 | Less interest | 2,005 | 1,775 | +13.0% |
| 7 | Profit before exceptional items (my calculation) | 4,994 | 4,593 | +8.7% |
| 8 | Exceptional items | +349 | -420 | swing of 769 |
| 9 | Share of associates and joint ventures | 112 | 51 | +120% |
| 10 | Profit before tax, including associates (my calculation) | 5,455 | 4,224 | +29.1% |
| 11 | Less tax | 1,756 | 1,039 | +69.0% |
| 12 | Net profit (my calculation, reported Rs 3,699.59 crore) | 3,699 | 3,185 | +16.1% |
Cite this table: Tata Steel consolidated Q2 FY27 ladder: line items per Sovrenn, sums are my calculation, Sunday, 22 November 2026, 3:20 PM IST
Does the ladder tie to the reported profit?
Yes. Rs 10,533 crore plus Rs 248 crore is Rs 10,781 crore. Less Rs 3,782 crore and Rs 2,005 crore leaves Rs 4,994 crore, and adding the Rs 349 crore exceptional gain and Rs 112 crore of associates gives Rs 5,455 crore, which matches the Rs 5,455.15 crore profit before tax that PSU Connect reported. Less Rs 1,756 crore of tax gives Rs 3,699 crore against Rs 3,699.59 crore reported. The year-ago column also ties within Rs 1 to 2 crore of rounding, and PSU Connect gives Rs 4,222.47 crore for the year-ago profit before tax against my Rs 4,224 crore.
This is the whole answer for one quarter: step 4 to step 12 is the journey, and each line takes a measurable bite. The Tata Steel Q2 results FY27 page covers the same quarter from the profit side, with the preview marks and the auditor’s flag.
Why Tata Steel has three EBITDA figures for one quarter
Three EBITDA figures exist for Tata Steel’s Q2 FY27, Rs 10,533 crore, Rs 10,665 crore and Rs 10,781 crore, and each is correct on its own definition. They differ by Rs 248 crore from lowest to highest, and I could not reconcile the company’s figure to the ladder without the filing.
| Figure | Rs crore | Source or method | What it includes |
|---|---|---|---|
| Operating profit | 10,533 | Sovrenn table | Excludes other income |
| EBITDA, company-reported | 10,665 | Company release via Investywise, Equitybulls, JM Financial | Definition not opened; margin 16.3% on Rs 65,436 crore |
| EBITDA including other income | 10,781 | My calculation: 10,533 plus 248 | Other income of Rs 248 crore added back |
| Gap, company-reported against ladder | -116 | My calculation: 10,665 less 10,781 | Not reconciled; filing not opened |
Cite this table: Tata Steel Q2 FY27 EBITDA definitions: sources named, differences my calculation, Sunday, 22 November 2026, 3:20 PM IST
Which EBITDA figure should I use?
Use the company-reported figure when you quote the company, and use the ladder figure when you want the steps to add up. State which one you used. On this page I use Rs 10,665 crore for the conversion ratio and Rs 10,781 crore for the step-by-step ladder, because that is the only way to make the arithmetic close.
The Rs 116 crore gap is small, about 1% of EBITDA. It is a reminder that two people comparing EBITDA vs net profit for the same company can start from different numbers without either being wrong. The Jio Platforms Q2 results page shows the same effect with Rs 978 crore of other income.
Where did the money go between EBITDA and net profit?
Of Tata Steel’s Rs 10,781 crore of EBITDA including other income, depreciation took about 35%, interest about 19% and tax about 16%, leaving about 34% as net profit. That is the EBITDA vs net profit gap for the quarter, in rupees and as a share.
| Item | Rs crore | Share of EBITDA incl. other income | Reading |
|---|---|---|---|
| EBITDA including other income | 10,781 | 100% | Starting point, my calculation |
| Depreciation | -3,782 | 35.1% | Machines and plants wearing out, non-cash |
| Interest | -2,005 | 18.6% | Cost of debt |
| Exceptional gain | +349 | +3.2% | One-off, not operations |
| Share of associates | +112 | +1.0% | Profit from companies Tata Steel does not control |
| Tax | -1,756 | 16.3% | About 32.9% of the Rs 5,343 crore pre-associate profit before tax |
| Net profit | 3,699 | 34.3% | Reported Rs 3,699.59 crore |
| Of which minority interest | -33 | 0.3% | Rs 33.18 crore, my calculation |
| Profit attributable to owners | 3,666 | 34.0% | Reported Rs 3,666.41 crore |
Cite this table: Tata Steel Q2 FY27 EBITDA to owners’ profit bridge: my calculation from Sovrenn and reported totals, Sunday, 22 November 2026, 3:20 PM IST
What does depreciation do to EBITDA vs net profit?
Depreciation is the largest step. A steelmaker owns plants, furnaces and mines, and the accounting cost of using them every quarter is Rs 3,782 crore. It is not a cash payment in that quarter, which is why EBITDA ignores it, but the equipment has to be replaced eventually, and net profit keeps the charge. This is the main reason asset-heavy companies show a wide gap between EBITDA and net profit.
What does interest do?
Interest of Rs 2,005 crore means the company pays about Rs 1 of interest for every Rs 5.3 of EBITDA, my calculation (10,665 divided by 2,005). A company with the same EBITDA and no debt would keep that Rs 2,005 crore. That is also why EBITDA vs net profit is a different question for a debt-free software company and a leveraged metals company.
Why EBITDA and net profit grew at different rates
Tata Steel’s EBITDA rose 17.1% year on year, but its profit before tax and exceptional items rose only about 10%, because depreciation grew 30.7% and interest 13.0%. JM Financial reported the 10.0% rise in profit before tax before exceptional items, to Rs 5,106 crore from Rs 4,643 crore.
| Line | Q2 FY27 | Q2 FY26 | Growth | Effect on the gap |
|---|---|---|---|---|
| EBITDA, company-reported | 10,665 | 9,106 | +17.1% | Starting line grew fast |
| Depreciation | 3,782 | 2,893 | +30.7% | Grew almost twice as fast |
| Interest | 2,005 | 1,775 | +13.0% | Grew slower than EBITDA |
| Profit before tax and exceptional items | 5,106 | 4,643 | +10.0% | Includes associates, per JM Financial |
| Profit before tax, with exceptional items | 5,455 | 4,222 | +29.2% | Boosted by the Rs 769 crore swing |
| Reported net profit | 3,699.59 | 3,183 | +16.2% | After a higher tax charge |
Cite this table: Tata Steel Q2 FY27 growth by line: sources named, growth my calculation, Sunday, 22 November 2026, 3:20 PM IST
Which growth rate is the cleaner EBITDA vs net profit comparison?
The 10.0% growth in profit before tax and exceptional items is the cleaner like-for-like read, because it removes the swing from a Rs 420 crore exceptional loss to a Rs 349 crore exceptional gain, which added Rs 769 crore (my calculation). The reported profit growth of 16.2% includes that swing, and the profit before tax growth of 29.2% includes it more heavily because tax rose 69.0% in the same period.
So the answer to how EBITDA and net profit behaved in this quarter is that EBITDA led, net profit followed more slowly, and the one-off flattered the reported figure. That reading comes from the ladder, not from a headline, and it is the one most pages skip. The wider method is in the guide to how to read quarterly results.
EBITDA vs net profit at Jio Platforms: Rs 21,879 crore to Rs 8,387 crore
Jio Platforms’ Q2 FY27 profit of Rs 8,387 crore was about 38% of its Rs 21,879 crore EBITDA, my calculation, and its EBITDA margin of 54.1% compares with a net margin of about 21%. Revenue from operations was Rs 40,475 crore, up 11.4%.
| Line | Rs crore | Source and basis |
|---|---|---|
| Revenue from operations | 40,475 | PSU Connect, Inc42; gross revenue Rs 47,485 crore is a different line |
| EBITDA, company-style summary | 21,879 | PSU Connect, Finology: 54.1% margin on operations revenue |
| Operating profit | 20,901 | Craytheon: 51.6% margin; Rs 20,901 crore plus Rs 978 crore other income equals Rs 21,879 crore |
| Net profit | 8,387 | Inc42, PSU Connect: up 13.7%; Rs 8,389 crore in JM Financial and Multibagg |
| Profit as a share of EBITDA | 38.3% | My calculation: 8,387 divided by 21,879 |
| Net margin on revenue from operations | 20.7% | My calculation: 8,387 divided by 40,475 |
Cite this table: Jio Platforms Q2 FY27, EBITDA and net profit: sources named, ratios my calculation, Sunday, 22 November 2026, 3:20 PM IST
Why does Jio’s EBITDA vs net profit gap differ from Tata Steel’s?
The gap is Rs 13,492 crore, my calculation, and it covers depreciation, interest, tax and any other items between the two lines. I did not find Jio’s depreciation, finance cost and tax lines in the sources I read, so I cannot build its ladder the way I did for Tata Steel, and I have not opened the filing. What the numbers do show is that a telecom business converts about 38 paise of each rupee of EBITDA into profit, while Tata Steel converts about 34 paise. The difference is small, but the margins are not: 54.1% against 16.3%.
That contrast is the useful lesson. EBITDA margin comparisons only work inside a sector, and the conversion ratio does not rescue a cross-sector comparison. The Jio Platforms Q2 results page sets out the profit, ARPU and EBITDA definition conflict in full.
PositionalCalls WhatsApp channel
Follow results explainers on WhatsApp
- Quarterly result guides with sources
- Dated tie-outs, no tips
- A message when a page is updated
EBITDA vs net profit at Ashok Leyland: margin fell while profit grew
Ashok Leyland’s standalone profit grew 12.7% to Rs 869.02 crore while revenue grew 39.4%, and its reported EBITDA margin fell to 10.1% from 12.1%. Growth in profit lagged growth in sales because costs took a larger share of revenue.
| Line | Q2 FY27 | Year ago | Basis |
|---|---|---|---|
| Standalone revenue, Rs crore | 13,364.28 | about 9,588 | +39.4%, per the sources named |
| Standalone profit after tax, Rs crore | 869.02 | 771.06 | +12.7% |
| Standalone net margin | 6.5% | 8.0% | My calculation: profit divided by revenue |
| EBITDA margin, as reported | 10.1% | 12.1% | Down 2.0 points; basis not stated in the sources I read |
| Consolidated profit after tax, Rs crore | 891.45 | 819.70 | +8.8% |
| Consolidated net margin | 5.2% | not computed | My calculation: 891.45 divided by 17,029.87 |
Cite this table: Ashok Leyland Q2 FY27, EBITDA and net profit: sources named, margins my calculation, Sunday, 22 November 2026, 3:20 PM IST
What does the margin gap tell you about EBITDA vs net profit?
The EBITDA margin dropped 2.0 points and the standalone net margin dropped about 1.5 points, my calculation, so most of the squeeze happened above the EBITDA line, in raw material and operating costs. For Tata Steel the squeeze below the line was larger, because depreciation grew faster than EBITDA. Knowing which side of the EBITDA line the pressure sits on is the point of reading the two together.
Two further cautions apply. First, the standalone and consolidated profits differ because the group includes the finance arm, and the auditors’ conclusion differs by basis, as the Ashok Leyland Q2 results page explains. Second, I did not find which basis the 10.1% margin refers to, so I treat the margin comparison as indicative.
Net profit vs profit attributable to owners: which one is EBITDA compared with?
EBITDA is a whole-group figure, so net profit before minority interest is the like-for-like comparison, and profit attributable to owners is the figure to use per share. Tata Steel’s Rs 33.18 crore minority share is small, but the same step can be large for a group with big subsidiaries.
| Line | Q2 FY27 Rs crore | Q2 FY26 Rs crore | Growth |
|---|---|---|---|
| Net profit (PAT), reported | 3,699.59 | 3,183 | +16.2% |
| Minority interest, my calculation | 33.18 | 81.34 | falls |
| Profit attributable to owners | 3,666.41 | 3,101.75 | +18.2% |
| EPS, Rs | 2.94 | 2.49 | +18.1% |
Cite this table: Tata Steel net profit and owners’ profit: reported by JM Financial, PSU Connect and Finology; minority line my calculation, Sunday, 22 November 2026, 3:20 PM IST
Why use profit attributable to owners for EBITDA vs net profit ratios?
If you divide owners’ profit by group EBITDA, you divide a number that belongs to one set of shareholders by a number that belongs to the whole group. That is why my 34% ratio for Tata Steel is a rough guide, not a precise conversion rate, and why the ladder above runs to the group’s net profit first. For per-share work, the owners’ profit is correct, because earnings per share are computed from it, as Belong’s explainer on minority interest notes.
Source conflicts: where the EBITDA and profit numbers disagreed
The sources disagreed on six points in the three examples, and each conflict is a definition or rounding difference, not an error by one side. The table records what each source said and how this page handles it.
| Item | Source A | Source B | Likely reason | How this page handles it |
|---|---|---|---|---|
| Tata Steel EBITDA | Rs 10,665 crore (company release via Investywise) | Rs 10,533 crore operating profit (Sovrenn) | Other income and company definition | Shows both and a third, Rs 10,781 crore |
| Tata Steel net profit | Rs 3,699.59 crore (PSU Connect) | Rs 3,700 crore (JM Financial, Sovrenn) | Rounding | Uses Rs 3,699.59 crore where exact |
| Tata Steel profit growth | +16.2% on net profit (JM Financial) | +18.2% on owners’ profit (Finology) | Total against owners’ profit | Shows both lines |
| Tata Steel year-ago pre-tax profit | Rs 4,222.47 crore (PSU Connect) | Rs 4,172 crore (Sovrenn) | Associates counted or not | Uses Rs 4,222 crore for with-associates growth |
| Jio EBITDA | Rs 21,879 crore (PSU Connect, Finology) | Rs 20,901 crore (Craytheon) | Other income of Rs 978 crore inside EBITDA | Shows both and the link |
| Jio profit | Rs 8,387 crore (Inc42, PSU Connect) | Rs 8,389 crore (JM Financial, Multibagg) | Rounding or a different line | Uses Rs 8,387 crore and flags the gap |
Cite this table: Source conflicts in EBITDA and net profit data, Q2 FY27, Sunday, 22 November 2026, 3:20 PM IST
Differences like these are why any page on this topic should show its inputs. A reader who sees only one source cannot tell whether a different number elsewhere is an error or a different definition.
Five tests to read EBITDA vs net profit on any results filing
Five ratios turn the EBITDA vs net profit gap into a checklist: depreciation, interest cover, tax rate, one-offs and minority share. The table runs them on Tata Steel’s Q2 FY27 numbers, and every ratio is my calculation.
| Test | Tata Steel Q2 FY27 | Question to ask |
|---|---|---|
| Depreciation as a share of EBITDA | 35.1% (3,782 of 10,781) | Is depreciation rising faster than EBITDA, as it did here at 30.7% against 16.4%? |
| Interest cover (EBITDA divided by interest) | 5.3 times (10,665 of 2,005) | Is the cover falling over quarters? |
| Tax rate on profit before associates | 32.9% (1,756 of 5,343) | Did tax rise faster than profit, here +69.0% against +28%? |
| Exceptional items as a share of profit before tax | 6.5% (349 of 5,343) | Does profit growth survive without the one-off? |
| Minority share of net profit | 0.9% (33.18 of 3,699.59) | Is a large subsidiary share taking profit away from owners? |
Cite this table: Five tests for EBITDA and net profit, Tata Steel Q2 FY27: my calculation, Sunday, 22 November 2026, 3:20 PM IST
Where do I find these lines in a filing?
- Open the results table on the BSE or NSE announcement and read the consolidated column for the quarter.
- Read down to depreciation and finance costs in the expenses block.
- Find exceptional items between profit before exceptional items and profit before tax.
- Read the tax and associates lines, then the split of profit between owners and non-controlling interests.
- Check the note or release for the company’s own EBITDA definition.
I did not open the exchange filing for Tata Steel, so this is where the lines usually sit, not what I saw there. The method for the whole filing is in the how to read quarterly results guide.
What are the most common mistakes when comparing EBITDA vs net profit?
Six mistakes cause most misreadings of EBITDA vs net profit, and each appears in the three examples above.
Bottom line
EBITDA vs net profit is a ladder, not a contest. Start with the company’s EBITDA, name the definition, walk down through depreciation, interest, one-offs and tax, and stop at owners’ profit for per-share work. The ladder tells you what the company reported and where the money went. It does not tell you what a share should do.
Using this ladder on Q3 FY27 results
Q3 FY27 results, for the quarter ending 31 December 2026, are due by 14 February 2027 under SEBI’s 45-day rule. When a company files, build the same ladder in the same order and compare it with this quarter.
I have not verified any company’s Q3 FY27 board-meeting date, so use the exchange announcements and the earnings calendar for dates. The Q2 numbers here give the base: Tata Steel’s depreciation of Rs 3,782 crore, interest of Rs 2,005 crore and owners’ profit of Rs 3,666.41 crore. For the stock-market vocabulary used on this page, see the stock market terms in India glossary.
EBITDA vs net profit in Hinglish: short summary
EBITDA vs net profit ka fark chaar kharchon ka hai: depreciation, interest, tax aur amortisation. Tata Steel ka Q2 FY27 EBITDA Rs 10,665 crore tha, jabki owners ka profit Rs 3,666.41 crore tha, yaani EBITDA ka lagbhag 34%, my calculation ke hisaab se.
Depreciation Rs 3,782 crore, interest Rs 2,005 crore aur tax Rs 1,756 crore tha. Ek hi quarter ke liye teen EBITDA figures mile: Rs 10,533 crore, Rs 10,665 crore aur Rs 10,781 crore, kyunki definition alag hai. Per-share kaam ke liye owners ka profit use karo.
Yeh page sirf analysis hai, koi stock call ya target nahi deta. Filing khud kholkar har number check karo.
Related pages: results that use these numbers
These pages cover the same results from other angles. Open one to see the full filing.
Sources for this guide to EBITDA and net profit
Every figure comes from the sources below, read on 22 November 2026. I did not open the BSE or NSE filings or the auditors’ reports themselves, so use the links and the exchange pages to reach the primary source. The Tata Steel line items come from one data provider’s table, so treat them as relayed.
- Sovrenn: Tata Steel Q2 FY27 consolidated results table
- JM Financial: Tata Steel Q2 PAT, 9 November 2026
- PSU Connect: Tata Steel Q2 profit and auditor observations
- Investywise: Tata Steel consolidated EBITDA Q2 FY27
- Equitybulls: Tata Steel EBITDA Rs 10,665 crore
- Finology Ticker: Tata Steel Q2 FY27 results analysis
- Multibagg: Tata Steel EBITDA and net debt Q2 FY27
- PSU Connect: Jio Platforms Q2 revenue and PAT
- Inc42: Jio Platforms Q2 profit
- JM Financial: Jio Platforms Q2 PAT, 31 October 2026
- Craytheon: Jio Platforms Q2 FY27 results
- Autocar Pro: Ashok Leyland Q2 consolidated results
- Multibagg: Ashok Leyland Q2 FY27 profit
- Compounding AI: Ashok Leyland Q2 FY27 results analysis
- Petpooja: EBITDA explained, Schedule III and Indian definition
- Anand Rathi: EBITDA explained, illustrative example
- Belong: minority interest and earnings per share
- Value Research: tax, minority interest and associates in the P&L
- IFRS Foundation: profit attributable to owners, illustrative example
- SEBI LODR Regulation 33: published text
PositionalCalls WhatsApp channel
Keep results guides together
- Q3 FY27 result pages as they post
- Method guides in plain English
- Links to new pages
EBITDA vs net profit: frequently asked questions
What is the difference between EBITDA vs net profit?
EBITDA is profit before interest, tax, depreciation and amortisation, so it shows what the operations earned before financing and accounting charges. Net profit is what is left after all of them. In Tata Steel’s Q2 FY27 filing, EBITDA was Rs 10,665 crore and consolidated net profit Rs 3,699.59 crore, with owners’ profit at Rs 3,666.41 crore.
Why is EBITDA higher than net profit?
EBITDA leaves out four costs that net profit pays: depreciation, interest, tax and amortisation. For Tata Steel in Q2 FY27, my calculation from Sovrenn’s table shows depreciation of Rs 3,782 crore, interest of Rs 2,005 crore and tax of Rs 1,756 crore, which together are far larger than the profit left. The more asset-heavy and indebted a company is, the wider the gap.
EBITDA vs net profit: which one should I use?
Use EBITDA to compare operating performance across companies or quarters, and net profit, specifically profit attributable to owners, for per-share work. Neither is enough alone. Tata Steel’s EBITDA grew 17.1% while its pre-exceptional profit before tax grew about 10%, per JM Financial, so the two measures told different stories in the same quarter.
Is EBITDA the same as operating profit?
Not always. Some data sites define operating profit as EBITDA without other income, while companies often include other income in EBITDA. Sovrenn shows Tata Steel’s operating profit at Rs 10,533 crore, and the company reported EBITDA of Rs 10,665 crore. Jio Platforms shows Rs 21,879 crore against Rs 20,901 crore, and the Rs 978 crore difference equals its other income.
How do I calculate EBITDA vs net profit from a results filing?
Start with profit before tax and exceptional items, add finance costs and depreciation, and subtract other income if you want operating EBITDA. Then move down: add or subtract exceptional items, deduct tax, add the share of associates and subtract minority interest. This page rebuilds Tata Steel’s Q2 FY27 chain that way and ties it to Rs 3,699 crore.
What is a good EBITDA to net profit ratio?
There is no single good ratio, because it depends on depreciation, debt and tax. Tata Steel’s owners’ profit was about 34% of its Rs 10,665 crore EBITDA in Q2 FY27, my calculation. Jio’s profit was about 38% of its Rs 21,879 crore EBITDA. Compare a company with its own earlier quarters and with similar peers, not with a fixed rule.
EBITDA vs net profit: does high EBITDA mean high profit?
No. A company can post strong EBITDA and weak profit if depreciation, interest or tax take most of it. Tata Steel’s EBITDA rose 17.1% on the year, but depreciation rose about 31% and interest about 13%, my calculation, so pre-exceptional profit before tax grew about 10%. Read the gap between the two lines before reading the headline.
What is the difference between net profit and profit attributable to owners?
Net profit, or profit after tax, includes the share that belongs to minority shareholders in subsidiaries. Profit attributable to owners is what remains for the parent company’s shareholders. Tata Steel reported Rs 3,699.59 crore of net profit and Rs 3,666.41 crore attributable to owners in Q2 FY27, a difference of Rs 33.18 crore, my calculation.
Why do two sites show different EBITDA for the same company?
Definitions differ. One source may include other income or adjust for exchange effects, and another may rebuild EBITDA from the profit and loss lines. For Tata Steel’s Q2 FY27, the company-reported figure is Rs 10,665 crore, Sovrenn’s operating profit is Rs 10,533 crore, and adding back other income gives Rs 10,781 crore, my calculation. Check which one a page uses.
Does comparing EBITDA vs net profit tell me whether to buy a stock?
No. It tells you what the company reported and how much of its operating profit reached its owners. It does not say what a share should do, and this page gives no target, rating or call. Use it to read the filing correctly, then check the exchange filing and the auditor’s report yourself.

Shubham Chaudhary is the founder of PositionalCalls, an independent Indian stock market research website. He writes company fundamentals, quarterly results analysis, IPO analysis and sector research for NSE and BSE listed companies, with a focus on banking stocks, insurance and long-term value investing. Every article is built from primary sources such as RBI, SEBI, NSE and BSE filings and company annual reports, and states its risks plainly in simple language for retail investors.
Coverage areas Our research standards- Numbers checked against NSE, BSE and SEBI filings
- Risks and limits stated in every article
- No paid promotions or broker tie-ups
- Articles updated when new filings arrive