

ITC FUTURES PRICE LOOKING WEK NOW TRADING AT 427-430
RESISTANCE 480
SUPPORT 390
VIEW FOR SHORT-TERM
ITC FUTURES PRICE: Introduction:
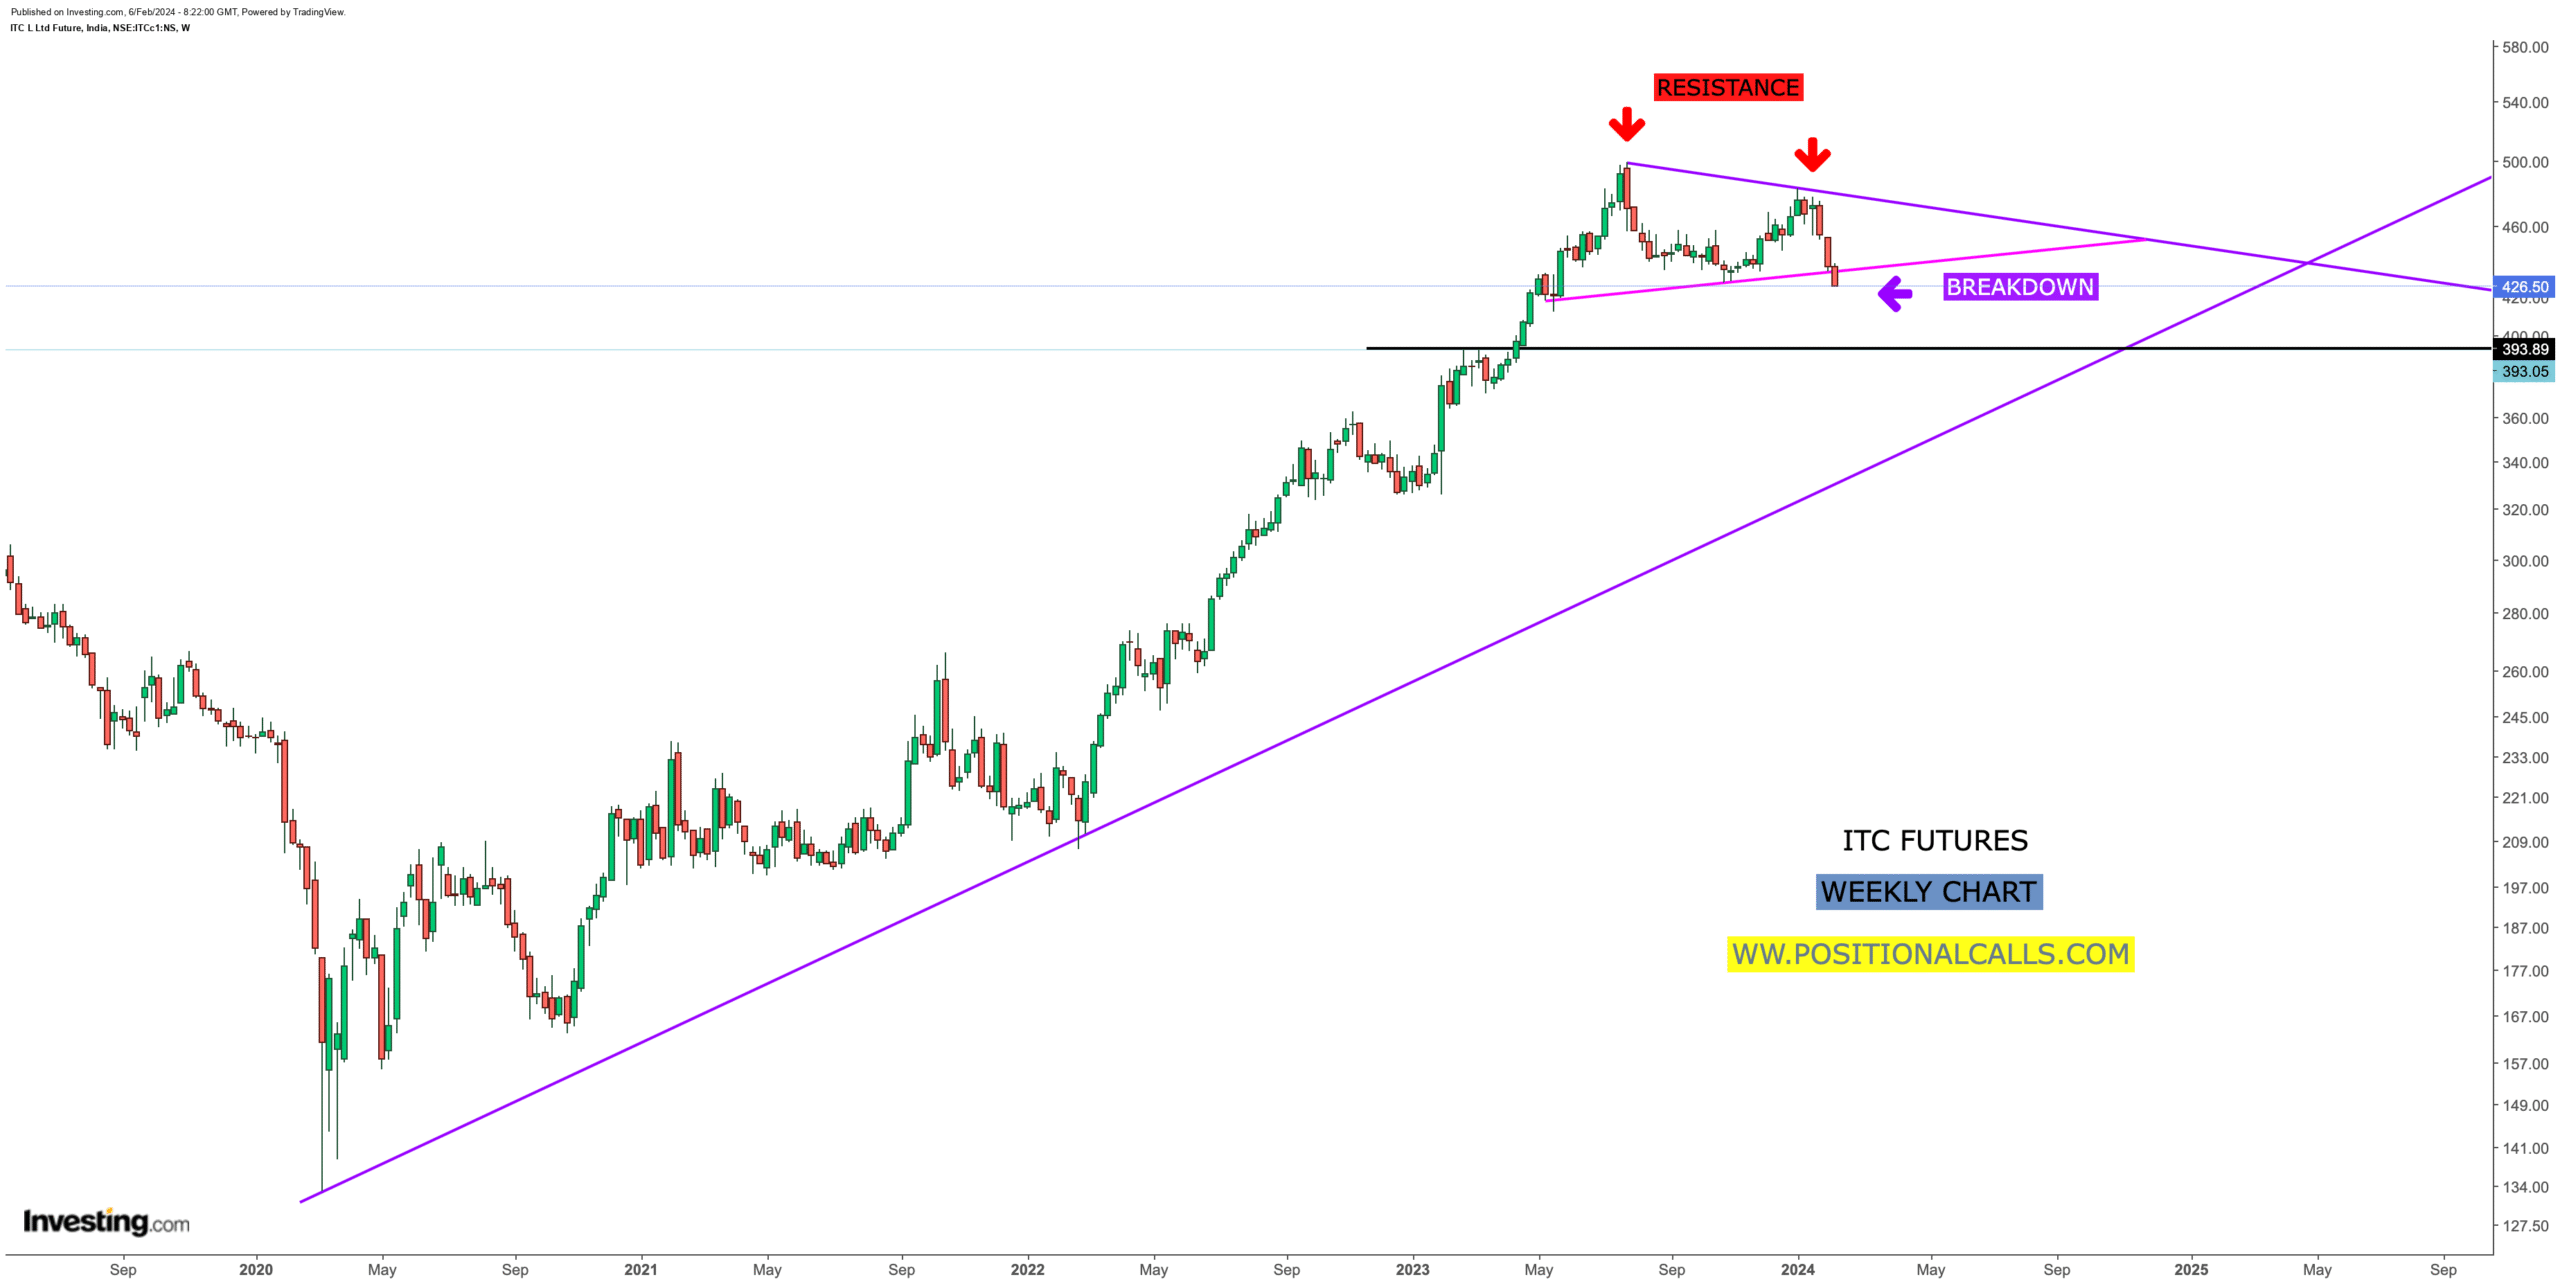
In the dynamic landscape of futures trading, staying ahead of market trends is crucial for investors seeking to maximise returns and minimise risks. ITC Futures has experienced weakness recently, with a breakdown observed in the daily chart. This blog delves into the intricacies of this market movement, analysing the current market price (CMP) at 427.20, identifying key resistance at 480, and highlighting critical support levels at 390. Come along as we investigate the elements that influence ITC Futures and offer insights for informed trading decisions.
ITC FUTURES PRICE: Understanding ITC Futures Weakness:
As investors, understanding the factors contributing to weakness in ITC Futures is paramount. Whether driven by macroeconomic shifts, industry-specific developments, or company-specific news, unravelling the underlying causes of this breakdown is essential for navigating market volatility effectively.
ITC FUTURES PRICE: Analyzing the Daily Chart Breakdown:
A breakdown in the daily chart signals a shift in market sentiment and can offer valuable insights into potential future movements. Investors can learn more about the prevailing market dynamics by conducting a detailed analysis of the chart patterns, technical indicators, and trading volumes.
Key Levels to Watch: CMP, Resistance, and Support:
Current Market Price (CMP) at 427.20:
The CMP is a crucial reference point for investors, offering insights into the prevailing market sentiment and price action. Analysing the CMP provides a real-time assessment of investor confidence and market direction.
Resistance at 480:
Resistance levels represent price points where selling pressure tends to outweigh buying pressure, potentially limiting upward price movements. Understanding and respecting resistance levels is essential for identifying potential barriers to price appreciation.
Support at 390:
Support levels act as price floors, where buying pressure typically outweighs selling pressure, providing a buffer against further price declines. Identifying and monitoring support levels is crucial for managing downside risks and identifying potential buying opportunities.
ITC FUTURES PRICE: Strategies for Trading ITC Futures:
In light of the breakdown observed in ITC Futures, investors may consider various trading strategies to capitalise on market movements while managing risks effectively. Whether employing trend-following techniques, utilising technical analysis tools, or incorporating risk management principles, having a well-defined trading strategy is essential for success in futures trading.
Read More: Delhivery Share Price: Buy Now or Wait? (Expert Analysis)
Conclusion:
In conclusion, the breakdown observed in ITC Futures, with the CMP at 427.20, resistance at 480, and support at 390, underscores the importance of diligent analysis and informed decision-making in futures trading. By understanding the underlying market dynamics, identifying critical support and resistance levels, and putting successful trading strategies into practice, investors can confidently navigate market volatility and position themselves for success in the ever-evolving world of futures trading.

Shubham tracks Indian equity markets with a focus on banking stocks, insurance companies, and long-term value investing. PositionalCalls was built to give independent investors the same quality of research that institutional desks produce — in plain language, with no brokerage bias and no paid promotions. All analysis is sourced from RBI, SEBI, NSE/BSE filings, and company annual reports.