
Earnings · Learn
This guide to how to read quarterly results walks through ten steps in the order a filing is built, and tests every step on the real Q2 FY27 numbers of Tata Steel, Ashok Leyland and Jio Platforms, including auditor flags, source conflicts and tie-outs, with no stock picks.
Quick answer
How to read quarterly results: check the basis first, then read down the statement. Confirm standalone or consolidated, read revenue, EBITDA and margin, strip out other income and exceptional items, use profit attributable to owners, compare year on year, and read the auditor’s report last.
Key takeaways on how to read quarterly results
- Basis first: Ashok Leyland’s revenue growth was 39% standalone and 35% consolidated, so a headline without a basis is not comparable.
- Profit line: Tata Steel’s Rs 3,700 crore is total profit after tax and Rs 3,666.41 crore belongs to owners, a gap that matters for earnings per share.
- Margins: Jio’s 54.1% EBITDA margin includes Rs 978 crore of other income, and its operating margin is 51.6%.
- One-offs: Tata Steel’s exceptional items moved from a Rs 420 crore loss to a Rs 349 crore gain in a year.
- Audit: Tata Steel carried a qualified opinion on an investment and Ashok Leyland a disclaimer on loan balances at its finance arm, and both need reading.
In plain words: A quarterly result is a short report card. Read it from the top line to the bottom line, check what is included in each number, and note anything unusual that the auditor or the company flags. A big profit number alone does not say how good the quarter was.
Data note: as of Saturday, 21 November 2026, 11:10 PM IST. Company figures are for the quarter ended 30 September 2026 and are relayed by the news and data sources named in each line. Rules come from published copies of SEBI’s listing regulations and the NSE compliance calendar. I did not open the BSE or NSE filings, the auditors’ reports or the company presentations, so check each number against the filing. Lines marked as my calculation are my own arithmetic. Analysis only: no buy or sell calls, targets or price zones.
Latest update
- 21 November 2026: first version, using the Q2 FY27 results of Tata Steel (7 November), Ashok Leyland (14 November) and Jio Platforms (30 October), as relayed by the sources named. The next update adds a Q3 FY27 case.
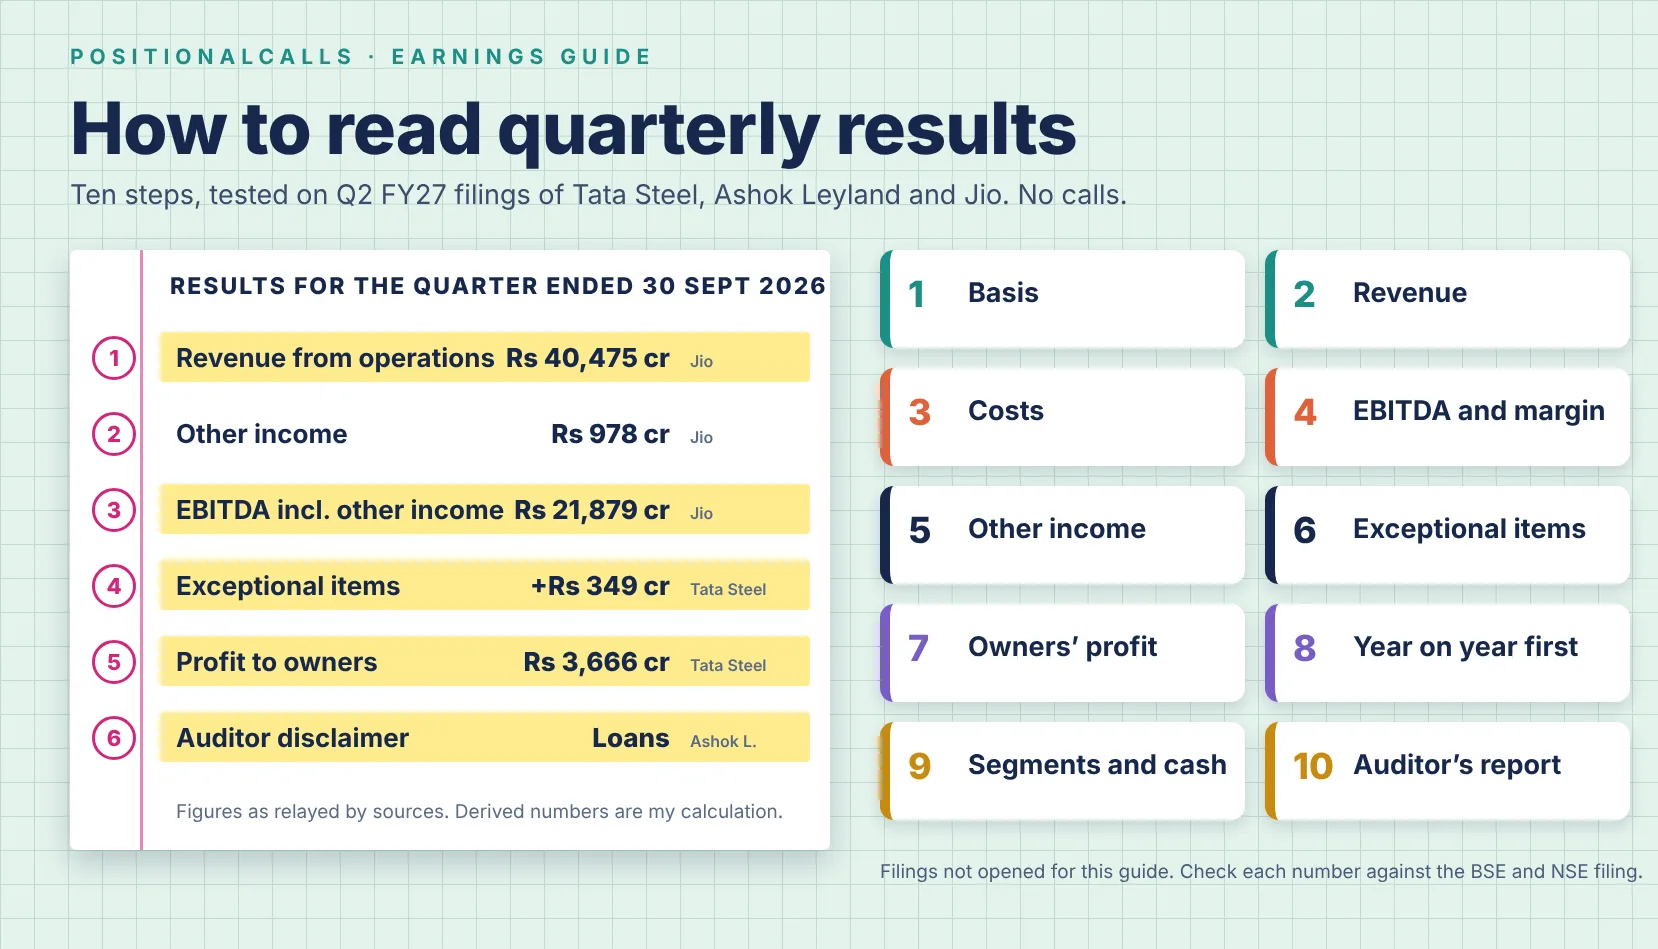
How to read quarterly results: the 10-step order in one table
How to read quarterly results is a matter of reading in the order the statement is built, top to bottom, and checking the basis of each number. The table gives the ten steps, what to read in each, and the mistake it prevents.
| Step | What to read | Mistake it prevents |
|---|---|---|
| 1. Basis | Standalone or consolidated, quarter ended, unaudited or audited | Comparing a group number with a parent-only number |
| 2. Revenue | Revenue from operations, not gross or total income | Counting other income as sales |
| 3. Costs | Raw material, employee and other costs as a share of revenue | Missing a margin squeeze hidden by growth |
| 4. EBITDA and margin | EBITDA, margin, and whether other income is inside it | Mixing two margin definitions |
| 5. Other income | Treasury income, dividends, gains outside the main business | Crediting the business for one-off income |
| 6. Exceptional items | Gains, losses, write-downs, restructuring | Calling a one-off gain a strong quarter |
| 7. Tax and profit | Profit before tax, tax rate, profit attributable to owners | Using total profit for per-share work |
| 8. Growth | Year on year first, quarter on quarter second | Mistaking seasonality for a trend |
| 9. Segments and cash flow | Segment profit, finance cost, cash from operations | Missing where the profit really comes from |
| 10. Auditor’s report | Qualified opinion, disclaimer, emphasis of matter, stated reason | Ignoring a flag printed in the filing |
Cite this table: How to read quarterly results: 10-step order, PositionalCalls, Saturday, 21 November 2026, 11:10 PM IST
Each step needs one question: on what basis, and what is inside this number?
When do listed Indian companies publish quarterly results?
Listed companies must file quarterly results within 45 days of the quarter end, and within 60 days for the last quarter of the financial year. The rule sits in Regulation 33 of SEBI’s listing regulations, and the NSE compliance calendar lists the dates as 14 August, 14 November, 14 February and 30 May.
What does Regulation 33 require?
Per the published text of Regulation 33, the listed entity files quarterly standalone results within forty-five days of each quarter end, and a company with subsidiaries also files consolidated results.
Dates matter because filings are not spread evenly across a season. Business Standard listed TCS and HCL Tech to report on 12 January 2026, and 5paisa counted over 50 companies reporting on 23 January, so a single day can carry dozens of filings. The full calendar is on the earnings calendar.
Where to find a company’s quarterly results filing
The primary source is the company’s filing on the BSE and NSE corporate announcement pages, and the company’s own investor page carries the same documents. A filing normally includes the statement of results, the auditor’s limited review report and notes. Many companies add a press release, an investor presentation and an earnings call.
Do news sources agree on the same number?
Press articles and data tools repeat the numbers within minutes, and they also disagree. On Jio Platforms’ Q2 FY27 profit, Inc42 and Free Press Journal reported Rs 8,387 crore while JM Financial and one Multibagg article reported Rs 8,389 crore. The two figures differ by Rs 2 crore, which is small, but it shows why you check the filing when a number is going to be used.
- Open the filing and note the heading: unaudited or audited, standalone or consolidated, quarter ended.
- Read the auditor’s report page before the numbers, because a flag changes how much weight the numbers carry.
This page did not open the exchange filings, so every figure below is attributed to the source that relayed it. The Tata Steel Q2 results page does the same.
How to read quarterly results: standalone or consolidated first?
Standalone results cover only the listed company, and consolidated results add its subsidiaries, so check which one a headline uses before reading anything else. Ashok Leyland’s Q2 FY27 shows the gap clearly: revenue grew about 39% on a standalone basis and 35% on a consolidated basis.
| Q2 FY27 item | Standalone | Consolidated | Source |
|---|---|---|---|
| Revenue | Rs 13,364.28 crore, +39.4% | Rs 17,029.87 crore, +35.4% | Compounding AI; Multibagg and Arthneeti |
| Net profit | Rs 869 crore, +12.7% | Rs 891.45 crore, +8.7% | Lapaas Voice and NewsBytes; Multibagg |
| Revenue difference | Rs 3,665.59 crore | My calculation | |
| Auditor’s review | Not stated in the sources | Conclusion disclaimed on loan balances at a finance subsidiary | Autocar Pro |
Cite this table: Ashok Leyland Q2 FY27, standalone against consolidated, PositionalCalls (my calculation for the difference), Saturday, 21 November 2026, 11:10 PM IST
The Rs 3,665.59 crore difference is my calculation of consolidated revenue minus standalone revenue. It is the net revenue from the group beyond the parent after intra-group items, and I have not seen a filing that splits it. It does show that a quarter’s headline can describe two different businesses.
The two profit lines also tell different stories. Standalone profit grew 12.7% to Rs 869 crore, while consolidated profit grew 8.7% to Rs 891.45 crore, because the group includes a finance subsidiary whose profit fell, as Autocar Pro reported. The company’s own pages are on the Ashok Leyland Q2 results page.
How to read quarterly results: revenue, costs and EBITDA margin
Read revenue from operations first, then the cost lines, then EBITDA and its margin. Revenue from operations is the money from the main business. Gross or total income adds other income and sometimes pass-through items, so it is a different number.
Revenue from operations or gross revenue?
Jio Platforms shows both. PSU Connect lists Q2 FY27 gross revenue of Rs 47,485 crore and revenue from operations of Rs 40,475 crore, up 11.3% and 11.4%. A reader who copies the wrong line gets a revenue figure about Rs 7,010 crore too high by my calculation, and a different growth rate. Use revenue from operations unless a page says why it uses another line.
Do margins confirm the growth?
Costs come next. If raw material or employee costs rise faster than revenue, margin falls even when profit grows in rupees. Ashok Leyland’s standalone revenue grew about 39%, but its EBITDA margin fell to 10.1% from 12.1%, per Lapaas Voice and Compounding AI, a fall of 2.0 percentage points by my calculation. Compounding AI put the change at 202 basis points, which agrees within rounding.
| Company, Q2 FY27 | EBITDA | Margin | Year-ago margin | Reading |
|---|---|---|---|---|
| Tata Steel (consolidated) | Rs 10,665 crore | 16.3% | 15.5% | Up on year; JM Financial reports +17.1% EBITDA |
| Jio Platforms | Rs 21,879 crore | 54.1% | 51.6% | Up on year; EBITDA +16.6% per PSU Connect |
| Ashok Leyland (standalone) | Not stated here | 10.1% | 12.1% | Down 2.0 points despite higher revenue |
Cite this table: Q2 FY27 EBITDA margins as reported by JM Financial, PSU Connect, Lapaas Voice and Compounding AI, PositionalCalls, Saturday, 21 November 2026, 11:10 PM IST
How to read quarterly results: other income and one-off items
Other income and exceptional items can lift or cut profit without telling you how the main business did. Other income is money from outside the core business, such as treasury income. Exceptional items are gains, losses or write-downs the company labels as unusual.
How large can an exceptional swing be?
Tata Steel’s Q2 FY27 shows how large the swing can be. JM Financial reported an exceptional gain of Rs 349 crore in the quarter, against an exceptional loss of Rs 420 crore a year earlier and an exceptional loss of Rs 345 crore in Q1 FY27. By my calculation that is a pre-tax swing of Rs 769 crore against last year and Rs 694 crore against Q1. Tax and minority effects are not shown in the sources, so the swing is not the same as the change in profit.
| Item | Reported figure | Where it sits | How to read it |
|---|---|---|---|
| Tata Steel exceptional items, Q2 FY27 | Gain of Rs 349 crore | Below operating profit, before tax | Note it; ask what the profit looks like without it |
| Tata Steel exceptional items, Q2 FY26 | Loss of Rs 420 crore | Same line, year-ago quarter | Makes year-on-year profit growth look larger |
| Jio Platforms other income, Q2 FY27 | About Rs 978 crore | Appears to sit inside reported EBITDA (my calculation, unconfirmed) | Explains the gap between 54.1% and 51.6% |
| Ashok Leyland finance subsidiary profit | Down about 28%, per Autocar Pro | Inside consolidated profit only | Visible in consolidated, not in standalone |
Cite this table: Other income and exceptional items in Q2 FY27 results, as reported by JM Financial, Craytheon and Autocar Pro, PositionalCalls, Saturday, 21 November 2026, 11:10 PM IST
Find the other income line and the exceptional line, add or subtract them, and see whether the story changes. A quarter whose profit growth disappears once one-offs are removed is a different quarter.
How to read quarterly results: which profit number to use?
Use profit attributable to owners of the company for per-share work, and total profit after tax when you want the size of the whole group. A consolidated statement starts with the profit of the group, and then splits it between the parent’s shareholders and minority shareholders in subsidiaries.
What is the gap between total profit and owners’ profit?
Tata Steel gives a clear case. PSU Connect reported consolidated net profit of Rs 3,699.59 crore, and JM Financial rounded it to Rs 3,700 crore, up 16.2% from Rs 3,183 crore. The Tata Steel Q2 results page uses Rs 3,666.41 crore as profit attributable to owners, up 18.2% from Rs 3,101.75 crore. By my calculation the gap is Rs 33.18 crore this year and Rs 81.25 crore last year, which is the minority share.
The distinction matters because earnings per share is built on owners’ profit. A beginner’s guide from Belong notes that using total consolidated profit instead of the owners’ share makes earnings per share come out too high. The same distinction explains why one article says profit rose 16% and another 18% for the same quarter: both can be right on their own basis.
How to read quarterly results: year on year or quarter on quarter?
Read year on year first, because it compares the same season, and use quarter on quarter second, because it shows momentum. Year on year compares Q2 FY27 with Q2 FY26, and quarter on quarter compares it with Q1 FY27.
Tata Steel’s Q2 FY27 EBITDA rose 17.1% on year and 13.8% on the quarter, per JM Financial. Net profit rose 16.2% on year but 55.1% on the quarter, from Rs 2,385 crore in Q1 to Rs 3,700 crore, by my calculation. The quarter-on-quarter profit jump is larger because Q1 was weak and exceptional items moved from a Rs 345 crore loss to a Rs 349 crore gain.
PositionalCalls WhatsApp channel
Follow results explainers on WhatsApp
- Quarterly result guides with sources
- Dated tie-outs, no tips
- A message when a page is updated
Why does seasonality change the comparison?
Seasonal businesses make the point sharper. The Wall Street School’s worked example of a paints company shows revenue down 5.4% and profit down about 31% from Q1, which looks poor, until the guide explains that July to September is usually a softer quarter for paints because of the monsoon, so the year-on-year change is the fairer test. The same logic applies to auto sales, fertilisers and consumer goods with festival peaks.
- Compare the same quarter of the last year first, and write down the growth.
- Use quarter on quarter only to see the direction, and ask whether the business is seasonal.
- Check whether one of the two periods contains a one-off, because it distorts the comparison.
Segments, finance cost and cash flow: the last three lines
The segment table shows where profit comes from, and the cash flow statement shows whether profit turned into cash. Many beginners stop at the profit line and miss both, though they often explain a surprise in the headline.
Tata Steel again gives an example. Devdiscourse reported a profit after tax of Rs 5,055 crore from the company’s Indian operations, while consolidated profit was Rs 3,700 crore. The difference is Rs 1,355 crore by my calculation. It is a prompt to read the segment table, because Finology’s analysis notes that the Netherlands business improved while the UK business remained loss-making. Finance cost, tax and minority interest also differ between the two figures, so the gap is not a diagnosis.
Cash flow works the other way: rising profit with flat or negative operating cash flow needs an explanation. The sources I used did not give cash flow lines for the three examples, so this page draws no cash flow conclusion for them. In a filing, check the half-year cash flow statement against the half-year profit.
How to read quarterly results: what an auditor’s flag means
Read the auditor’s report before the numbers, because a qualified opinion or a disclaimer tells you which figures carry a stated doubt. For quarterly results that are unaudited, the auditor issues a limited review report, and the regulator’s formats call it an independent auditor’s review report. Annual figures are audited.
What do a qualified opinion and a disclaimer mean?
Under general auditing standards, a qualified opinion states that the accounts are fair except for the effects of a named matter, and a disclaimer states that the auditor does not express an opinion because the evidence was not enough. A qualified opinion is narrower, and a disclaimer is a stronger flag, because it says the auditor could not conclude at all. The US PCAOB standard sets out both terms. Neither term alone says how large the number at stake is, so read the stated reason.
| Company, Q2 FY27 | What the auditor said | Amount named | What to check |
|---|---|---|---|
| Tata Steel (standalone) | Qualified opinion on the assessment of the investment in T Steel Holdings Pte Ltd | Carrying value Rs 59,078.13 crore at 30 September 2026 | The note on the impairment test and its assumptions |
| Tata Steel (consolidated) | Review highlighted impairment indicators for the Tata Steel Nederland unit | Plant and equipment Rs 33,272.58 crore; goodwill Rs 5,420.01 crore | Whether any impairment is booked in a later quarter |
| Ashok Leyland (consolidated) | Conclusion disclaimed because of unresolved discrepancies in loan balances at Hinduja Leyland Finance | Financial impact yet to be determined, per Autocar Pro | Management’s statement on the discrepancy and its timeline |
Cite this table: Auditor flags in Q2 FY27 results as relayed by PSU Connect and Autocar Pro, PositionalCalls, Saturday, 21 November 2026, 11:10 PM IST
Derived numbers: how each figure on this page was rebuilt
Every percentage and gap on this page was rebuilt from the reported figures before it was written. The table lists the arithmetic, so a reader can repeat it from the filing. All results are my calculation from the sources named in the sources list.
| Check | Arithmetic | Result |
|---|---|---|
| Ashok Leyland standalone revenue growth | 13,364.28 against 9,588 | +39.4% |
| Ashok Leyland consolidated minus standalone revenue | 17,029.87 minus 13,364.28 | Rs 3,665.59 crore |
| Ashok Leyland consolidated profit growth | 891.45 against 820 | +8.7% |
| Ashok Leyland standalone EBITDA margin change | 12.1% minus 10.1% | 2.0 points lower |
| Tata Steel total profit growth | 3,699.59 against 3,183 | +16.2% |
| Tata Steel owners’ profit growth | 3,666.41 against 3,101.75 | +18.2% |
| Tata Steel total minus owners’ profit | 3,699.59 minus 3,666.41 | Rs 33.18 crore |
| Tata Steel EBITDA margin | 10,665 divided by 65,436 | 16.3% |
| Tata Steel exceptional swing against last year | 349 plus 420 | Rs 769 crore |
| Tata Steel India profit minus consolidated profit | 5,055 minus 3,700 | Rs 1,355 crore |
| Jio operating profit plus other income | 20,901 plus 978 | Rs 21,879 crore |
| Jio EBITDA margin and operating margin | 21,879 and 20,901 divided by 40,475 | 54.1% and 51.6% |
Cite this table: Derived numbers for how to read quarterly results, my calculation, PositionalCalls, Saturday, 21 November 2026, 11:10 PM IST
The Jio line ties exactly: Rs 20,901 crore of operating profit plus Rs 978 crore of other income equals Rs 21,879 crore of EBITDA. I took the Rs 20,901 crore from Craytheon’s operating-profit line of Rs 209.01 billion. I have not opened Jio’s filing to confirm that its EBITDA includes other income, so treat that explanation as likely but unconfirmed.
Source conflicts: where the Q2 FY27 numbers disagreed
The sources disagreed on six points in the three examples, and each conflict teaches a step. The table records what each source said and how this page handles it.
| Item | Source A | Source B | Likely reason | How this page handles it |
|---|---|---|---|---|
| Jio Q2 profit | Rs 8,387 crore (Inc42, Free Press Journal) | Rs 8,389 crore (JM Financial, Multibagg) | Rounding or a different line | Uses Rs 8,387 crore and flags the Rs 2 crore gap |
| Jio revenue | Rs 47,485 crore gross (PSU Connect) | Rs 40,475 crore from operations (PSU Connect, Inc42) | Gross against operations | Uses revenue from operations |
| Jio margin | 54.1% EBITDA (PSU Connect, Finology) | 51.6% operating (Craytheon) | Other income inside EBITDA | Shows both and the Rs 978 crore link |
| Ashok Leyland growth | 39% revenue (Compounding AI, Arthneeti) | 35.4% revenue (Multibagg, Arthneeti) | Standalone against consolidated | Shows both bases in one table |
| Tata Steel profit growth | 16.2% on Rs 3,700 crore (JM Financial) | 18% on owners’ profit (Finology headline) | Total against owners’ profit | Shows both lines and the gap |
| Jio filing day | Thursday (Free Press Journal) | 30 October, a Friday (Sovrenn, Newkerala) | Not resolved | Uses 30 October, flagged |
Cite this table: Source conflicts in Q2 FY27 results, PositionalCalls (derived labels are my calculation), Saturday, 21 November 2026, 11:10 PM IST
How to read quarterly results in 10 minutes: a routine
A 10-minute routine for how to read quarterly results is to open the filing, write down the basis, and fill one table of six figures. The numbered list below is the order. Do it the same way for every company, so the figures can be compared.
- Header and basis (1 minute). Note unaudited or audited, standalone or consolidated, and the quarter.
- Auditor’s report (1 minute). Read the opinion or conclusion. Copy any named matter and its amount.
- Revenue and costs (2 minutes). Revenue from operations, growth, and the main cost lines as a share of revenue.
- EBITDA and margin (1 minute). Note whether other income is inside it.
- One-offs (2 minutes). Other income and exceptional items, and the profit with and without them.
- Profit and per share (2 minutes). Profit before tax, tax, profit attributable to owners, earnings per share.
- Growth (1 minute). Year on year first, quarter on quarter second.
Then read segments and the half-year cash flow, and write one sentence: what happened, on which basis, and what is unusual. The Tata Steel results date page and the Ashok Leyland results date page show what a preview looked like before the figures came in.
What are the most common mistakes when reading quarterly results?
Six mistakes cause most misreadings, and each appears in the three examples above.
Bottom line
How to read quarterly results is a method, not a verdict. Confirm the basis, rebuild the margin, remove one-offs, use owners’ profit, compare like with like and read the auditor’s flag. The method tells you what the company reported. It does not tell you what a share should do.
Using this method on Q3 FY27 results
Q3 FY27 results, for the quarter ending 31 December 2026, are due by 14 February 2027 under the 45-day rule. The NSE compliance calendar lists 14 February as the date, and last year’s season started in mid-January, when Business Standard listed TCS and HCL Tech for 12 January 2026.
I have not verified any company’s Q3 FY27 board-meeting date, so use the exchange announcements and the earnings calendar for dates. When a company files, apply the ten steps in the same order: basis, auditor’s report, revenue and costs, EBITDA, one-offs, owners’ profit, growth, segments.
How to read quarterly results in Hinglish: short summary
Quarterly result padhne ke liye sabse pehle basis dekho: standalone hai ya consolidated. Ashok Leyland ka revenue standalone mein 39% badha, jabki consolidated mein 35% badha, isliye dono ko mix mat karo.
Tata Steel ka total profit Rs 3,700 crore tha, lekin owners ka profit Rs 3,666.41 crore tha. Per-share kaam ke liye owners ka profit use hota hai. Jio ka EBITDA margin 54.1% hai, lekin operating margin 51.6% hai, kyunki Rs 978 crore other income EBITDA mein shamil hai, my calculation ke hisaab se.
Exceptional items aur auditor ka report zaroor padho. Yeh page sirf analysis hai, koi stock call ya target nahi deta.
Related pages: results that use this method
These pages apply the same reading order to full company results. Open one to see the ten steps on a complete filing.
Sources for this guide on how to read quarterly results
Every figure comes from the sources below, read on 21 November 2026. I did not open the BSE or NSE filings or the auditors’ reports themselves, so use the links and the exchange pages to reach the primary source. Where a source gives only a snippet, the figure is marked as relayed.
- NSE: compliance calendar, main board
- SEBI LODR Regulation 33: published text
- SEBI circular 29 March 2019: limited review procedure and formats
- PCAOB AS 3105: qualified opinions and disclaimers
- Belong: minority interest and earnings per share
- The Wall Street School: analysing a quarterly result
- Business Standard: Q3 FY26 results coverage, 12 January 2026
- 5paisa: Q3 results live, 23 January 2026
- JM Financial: Tata Steel Q2 PAT, 9 November 2026
- PSU Connect: Tata Steel Q2 profit and auditor observations
- Devdiscourse: Tata Steel India profit Q2 FY27
- Finology Ticker: Tata Steel Q2 FY27 results analysis
- Autocar Pro: Ashok Leyland Q2 consolidated results
- Multibagg: Ashok Leyland Q2 FY27 profit
- Compounding AI: Ashok Leyland Q2 FY27 results analysis
- Arthneeti: Ashok Leyland Q2 FY27 earnings
- PSU Connect: Jio Platforms Q2 revenue and PAT
- Inc42: Jio Platforms Q2 profit
- JM Financial: Jio Platforms Q2 PAT, 31 October 2026
- Craytheon: Jio Platforms Q2 FY27 results
PositionalCalls WhatsApp channel
Keep results guides together
- Q3 FY27 result pages as they post
- Method guides in plain English
- Links to new pages
how to read quarterly results: frequently asked questions
How to read quarterly results in India step by step?
Read in this order: filing date and auditor’s report, revenue from operations, costs, EBITDA and margin, other income and exceptional items, tax, profit attributable to owners, earnings per share, segments, then cash flow. Compare each figure with the same quarter last year first, and note whether it is standalone or consolidated.
What is the difference between standalone and consolidated quarterly results?
Standalone results cover only the listed company. Consolidated results add its subsidiaries, so they show the whole group. Ashok Leyland’s Q2 FY27 revenue was about Rs 13,364 crore standalone and Rs 17,030 crore consolidated, so the growth rates differ too. Check the basis before comparing.
How to read quarterly results: which profit number should I use?
Use profit attributable to owners of the company for per-share work, because total profit after tax includes the share of minority shareholders in subsidiaries. Tata Steel’s Q2 FY27 profit after tax was about Rs 3,700 crore, while profit to owners was Rs 3,666.41 crore, a gap of about Rs 33 crore by my calculation.
How to read quarterly results: EBITDA or operating profit?
EBITDA is earnings before interest, tax, depreciation and amortisation, and it may include other income, while operating profit often excludes it. Jio Platforms’ Q2 FY27 EBITDA was Rs 21,879 crore, and my calculation shows Rs 20,901 crore of operating profit plus Rs 978 crore of other income equals that figure, which explains the two margins.
How to read quarterly results: why do YoY and QoQ growth differ?
YoY compares a quarter with the same quarter last year, which removes seasonality, while QoQ compares it with the previous quarter and shows momentum. Tata Steel’s Q2 FY27 EBITDA rose 17.1% on year and 13.8% on the quarter. Use YoY first and treat QoQ cautiously for seasonal businesses.
What does an auditor’s qualified opinion or disclaimer mean in quarterly results?
A qualified opinion or conclusion means the auditor accepts the results except for a specific matter, while a disclaimer means the auditor could not form a conclusion on the matter. Tata Steel’s standalone report carried a qualified opinion on an investment, and Ashok Leyland’s consolidated review carried a disclaimer on loan balances at its finance arm. Read the stated reason.
When do listed Indian companies have to publish quarterly results?
Under SEBI’s listing regulations, quarterly results are due within 45 days of the quarter end, and within 60 days for the last quarter of the financial year. NSE’s compliance calendar shows 14 August, 14 November, 14 February and 30 May. For Q3 FY27, the quarter ending 31 December 2026, the due date falls on 14 February 2027.
How do exceptional items and other income change how I read quarterly profit?
They can lift or cut profit without reflecting the main business. Tata Steel reported an exceptional gain of Rs 349 crore against a loss of Rs 420 crore a year earlier, a swing of Rs 769 crore before tax by my calculation. Note such items before calling a quarter strong.
Where can I find the primary quarterly results filing for a company?
The primary source is the company’s result filing on the BSE and NSE corporate announcement pages, which also carries the auditor’s limited review report, and the company’s own investor page. Press articles and aggregator pages repeat the numbers and sometimes disagree. When two sources differ, open the filing.
Does reading quarterly results tell me whether to buy a stock?
No. Reading quarterly results tells you what the company reported, on which basis and with which one-offs, and it does not tell you what a share should do. This page gives no target, rating or buy or sell call. It is a method for reading filings, with dated examples and my calculations labelled.

Shubham Chaudhary is the founder of PositionalCalls, an independent Indian stock market research website. He writes company fundamentals, quarterly results analysis, IPO analysis and sector research for NSE and BSE listed companies, with a focus on banking stocks, insurance and long-term value investing. Every article is built from primary sources such as RBI, SEBI, NSE and BSE filings and company annual reports, and states its risks plainly in simple language for retail investors.
Coverage areas Our research standards- Numbers checked against NSE, BSE and SEBI filings
- Risks and limits stated in every article
- No paid promotions or broker tie-ups
- Articles updated when new filings arrive