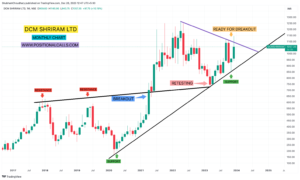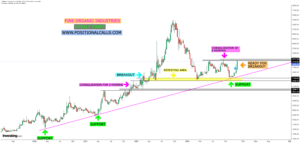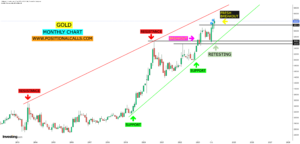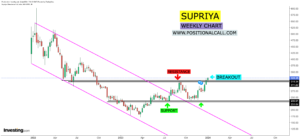
Chart Patterns – In the high-octane trading world, where profits roar and losses sting, mastering price action is the key to navigating the market’s unpredictable terrain. And what better tools for this than chart patterns, the battle scars etched by the clashing forces of bulls and bears?
This blog isn’t just your average price action tutorial. We’re diving deep into the ten most potent chart patterns, dissecting their anatomy and deciphering their whispers.
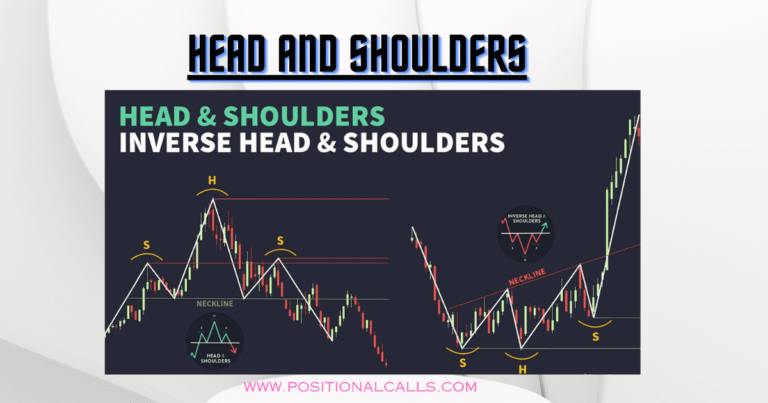
1. Head and Shoulders: The King of Trend Reversals
Are you tired of chasing pump-and-dumps? Learn to spot the Head and Shoulders, a powerful chart pattern that predicts trend reversals like a psychic with a crystal ball. ✨
Here’s the lowdown:
- It looks like Three peaks – a tall “head” flanked by shorter “shoulders.” Think mountain range, not family portrait. ️
- This means the upward trend is losing steam, and bears are gearing up to maul the price. 🩸
- How to profit: Sell at the neckline (bottom line), then watch the bears feast!
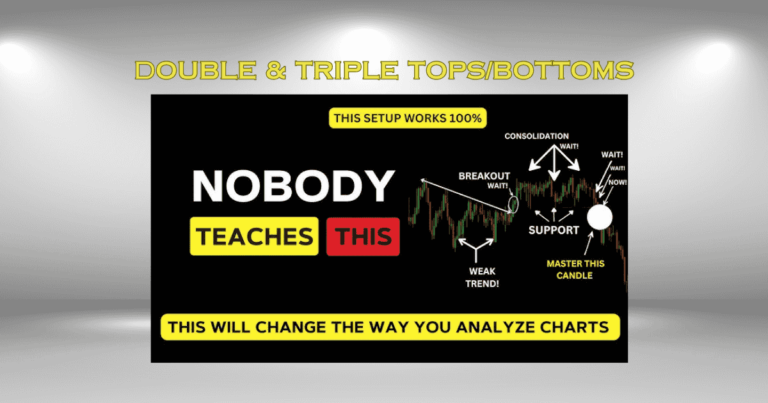
2. Double & Triple Tops/Bottoms: Bullish & Bearish Chart Pattern Beacons
Are you tired of trading in the dark? Ignite your profits with double and triple tops/bottoms and chart patterns that scream trend reversals louder than a rock concert!
Double Tops:
Bearish Signal! Price peaks twice near resistance, buyers lose steam, and a downward plunge is imminent! Short the suckers, watch your portfolio skyrocket!
Triple Tops:
MEGA Bearish! Price tests resistance thrice; exhaustion is confirmed! Waterfall incoming! Cash in on the market’s meltdown!
Double Bottoms:
Bullish Bliss! Price dips twice near support, buyers step in, rally erupts! Go long, ride the upward wave to profit paradise!
Triple Bottoms:
MEGA Bullish! Price tests support thrice; bulls dominate! Moon Mission activated! Fuel your portfolio with this bullish beast!
But wait, there’s more!
- High-Profit Potential:
These patterns signal vital trend changes, ripe for explosive trades! - Visual Cues:
Easy to spot on charts, even for trading newbies! - Confirmation is Key:
Combine with other indicators for trade-winning accuracy! - Don’t be left in the dust!
Master these chart patterns and dominate the markets!
3. Flags & Pennants: Explosive Breakouts Waiting to Happen!
Seeking dynamic market movements? I’m sharing flags & Pennants here for your answer. These chart patterns signal potential breakouts and your gateway to explosive price action. However, like all trading strategies, they come with risks, such as false breakouts. Traders, gear up for a thrilling journey of technical analysis tailored for high-growth portfolios!
Flags:
Picture them as the calm before the storm in a raging trend. Prices take a breather, forming a rectangle, and then, like a rocket, they take off in the direction of the previous trend, amplifying the volatility!
- Pennants:
Visualise a symmetrical triangle, tightening its grip as prices fluctuate. This accumulated tension bursts on the breakout, catapulting prices towards uncharted territories!
4. Triangles: The Squeeze Play of Chart Patterns
The thrilling clash of bulls and bears! Triangles in technical analysis aren’t just geometric shapes; they’re electrifying battlegrounds where price action gets squeezed, hinting at explosive breakouts or deceptive reversals.
Here’s the lowdown:
- Consolidation Zone:
Prices coil tighter like a spring, reflecting indecision between buyers and sellers. ️♀️ - Three Sides, Three Paths:
Ascending, Descending, or Symmetrical triangles each signal potential trend continuations or dramatic reversals.
Grasping these can give you a significant edge in your trading decisions. - Breakout’s the Boom:
The squeeze ends with a price surge piercing the triangle’s upper or lower boundary. This is the pivotal moment you’ve been waiting for your trading cue! - Volume Surge Confirms:
Look for a spike in trading volume alongside the breakout for stronger conviction.
5. Channels: Chart Patterns – Crack the Price Code in Seconds
Would you be ready to turn your trades around? Chart patterns like Channels could be your ticket to predicting price movements with Jedi-like precision. Here’s how they could boost your profits in no time:
What are Channels? Picture two parallel lines guiding price action like a rollercoaster. These lines (trendlines) serve as support & resistance zones, providing straightforward entry & exit points.
Types of Channels:
- Bullish Channel:
Prices ascend within the channel, suggesting a continued uptrend. Imagine it as rocket fuel for your portfolio! - Bearish Channel:
Prices descend downward within the channel, signalling a potential downtrend. Time to brace for impact! - Horizontal Channel:
Prices bounce like a yo-yo between the lines, indicating rangebound action. Perfect for scalping profits!
Trading Channels:
- Buy near support:
Prices testing the lower trendline often bounce back, offering juicy entry points. - Sell near resistance:
Prices nearing the upper trendline might be due for a correction; it’s time to cash out! - Breakouts:
A significant trend shift could be brewing when prices explode outside the channel. Buckle up!
6. Cup and Handle: The Holy Grail of Bullish Breakouts
Are you tired of flat charts? Craving explosive gains? Look no further than the Cup and Handle, the chart pattern that turbocharges trends and separates winners from losers.
Here’s the drill:
- U-shaped “Cup” forms, prices climb, then consolidate in a tight range. Think of it as a stock-taking pause before the next leg up.
- The right side dips, forming a Handle’ – not a crash, just a healthy pullback to shake out weak hands, which refers to investors who lack conviction and sell at the first sign of trouble.
- BOOM! Breakout above the Handle’s top signals the continuation of the uptrend! It’s time to unleash your inner bull.
Why it matters:
- Highly reliable bullish indicator backed by years of trading data.
- Predicts explosive price surges – think home runs, not singles.
- They are used by top traders like William O’Neil to crush the market.
7. Saucer: The U-Turn Your Portfolio Wants
Ready to reverse the downtrends? The Saucer pattern, a bullish reversal phenomenon, is primed to propel your portfolio to unprecedented heights!
Picture this: Prices dive, crafting a smooth’ U’ shape like a sleek saucer cradling your future profits. Buyers congregate, nudging prices subtly upwards, priming for a breakout akin to a slingshot. And then, kaboom! Prices rocket through the rim, sending sellers into a frenzy and your bank balance skyrocketing.
Here’s the lowdown:
- U-turn signal:
Saucers scream “trend reversal!” after downtrends, whispering sweet nothings of bullish skies. - Gradual climb:
There are no jagged cliffs here. Prices gently rise, hinting at sustained momentum, not a pump-and-dump. - Confirmation breakout:
Watch for prices shattering the “rim” (resistance level) with high volume – that’s your cue to join the party!
8. Diamond Chart Pattern: Glimmer of Reversal in a Rocky Trend
** Flashing Red or Green? Spot the Diamond! **
Is the market choppy? Trends fading? Fear not, savvy trader! The Diamond Chart Pattern could be your shining beacon, hinting at a juicy reversal just around the corner.
What is the Diamond Chart Pattern? It’s a unique formation on a price chart that resembles a diamond. It’s formed by two converging trendlines- one connecting the highs and the other connecting the lows. These trendlines form a tightening triangle, indicating a tug-of-war between buyers and sellers.
Bullish or Bearish? Buckle Up!
- Diamond Top:
Is it gleaming at the peak of an uptrend? Brace for a downward plunge! Sell those hot stocks, partner. - Diamond Bottom:
Is it shimmering in a downtrend’s abyss? Upward surge incoming! Buy the dip, savvy investor.
But wait, there’s more!
- Breakout’s the key:
Price busts through the trendlines? That’s your confirmation signal – time to pounce! - Why does volume matter in the Diamond Chart Pattern? A significant breakout with high trading volume can indicate a strong move, so buckle up for a wild ride! However, if the volume is low during the breakout, it could be a false alarm, so tread cautiously.
Diamond in the rough? Sure, it could be more foolproof. But for traders with sharp eyes and a thirst for high-octane reversals, the Diamond Chart Pattern can be a gemstone in their technical analysis arsenal.
9. Butterfly Pattern: A Harmonic Flurry of Profits in the Trading Jungle
Imagine a chart dancing like a butterfly, its wings flashing with reversal signals. That’s the essence of the Butterfly pattern, a chart formation that’s music to technical analysts’ ears.
Description:
- Harmonic haven:
The Butterfly, a rare gem in the harmonic pattern family, is known for its pinpoint accuracy in predicting trend reversals. This high-octane roadmap to profiting from market swings is something you come across only sometimes. - Fibonacci fiesta:
This beauty flits around specific Fibonacci ratios, like 0.786, 1.27, and 1.618, weaving a web of potential entry and exit points. It’s like having Fibonacci himself whispering trade secrets in your ear. - Trend terminator:
Spot this fluttering friend at the end of an uptrend or downtrend, and brace yourself for a potential price reversal. It’s like a neon sign screaming, “Trend party’s over; reversal incoming!”
10. Three Drives: The Harmonic Reversal Pattern Your Portfolio Craves
Are you tired of false breakouts and endless trends? Buckle up, traders, because the Three Drives Pattern is here to supercharge your chart analysis and unearth hidden reversal opportunities like a Jedi with a Fibonacci ruler.
What is it? The Three Drives Pattern is characterised by three powerful, consecutive price swings, like a bull rampaging in a china shop. Each “drive” retraces precisely to Fibonacci levels, forming a harmonious symphony of price action. To identify this pattern, look for three consecutive price swings that retrace to Fibonacci levels. The first and second drives should be approximately equal in time and price, while the third should be shorter and less extensive.
Bullish Three Drives:
Price bottoms out with three epic dives, then rockets like a SpaceX launch on the fourth.
Bearish Three Drives:
The market peaks like a mountaintop, followed by three chilling descents, signalling a potential avalanche of downward momentum.
Why it matters: This rare beauty is a powerhouse reversal indicator, whispering secrets of trend exhaustion and imminent turnarounds. Trade confidently, knowing you’re riding the wave, not fighting the tide.
Beyond the Patterns: Chart patterns are just tools, not crystal balls. Always combine them with other technical indicators, fundamental analysis, and sound risk management for informed trading decisions.
In Conclusion:
With these ten chart patterns in your arsenal, you’re ready to dominate the trading landscape. Remember, practice makes perfect, so backtest these patterns, analyse real-time charts, and refine your trading strategies.
The market is a battlefield, but you can become the ultimate price action warrior with the proper knowledge and tools. Unleash your trading prowess, conquer the charts, and claim your victory!
Note: This blog provides a high-level overview of 10 chart patterns. Further research is recommended for deeper analysis and specific trading strategies.
Read More: INDIAN TERRAIN Share Price Buy Recommendation: Top Analysts Weigh In (2024 Outlook)
Disclaimer:
This information is intended purely as education and should not be construed as financial advice. A competent financial advisor should be consulted before making any investing decisions.
- I hope this blog meets your expectations. Feel free to ask if you have any further questions!

