Contents
Conquer the Market with Technical Analysis Mastery: Demystifying the Head and Shoulders Chart Pattern
In the high-octane world of trading, where fortunes are forged and lost in nanoseconds, having a razor-sharp arsenal of technical analysis tools is your ticket to victory. Among these instruments of financial mastery, few shine as brightly as the head and shoulders chart pattern. This iconic formation, resembling a mythical titan frozen in time, can reveal turning points in the market with uncanny precision.
But what exactly is this head and shoulders beast, and how can you harness its power to dominate your trades? Buckle up, traders, because we’re diving deep into the anatomy of this chart behemoth, dissecting its intricacies, and equipping you with the knowledge to exploit its predictive prowess.
Head and Shoulders: Anatomy of the Alpha: Decoding the Head
and Shoulders Formation
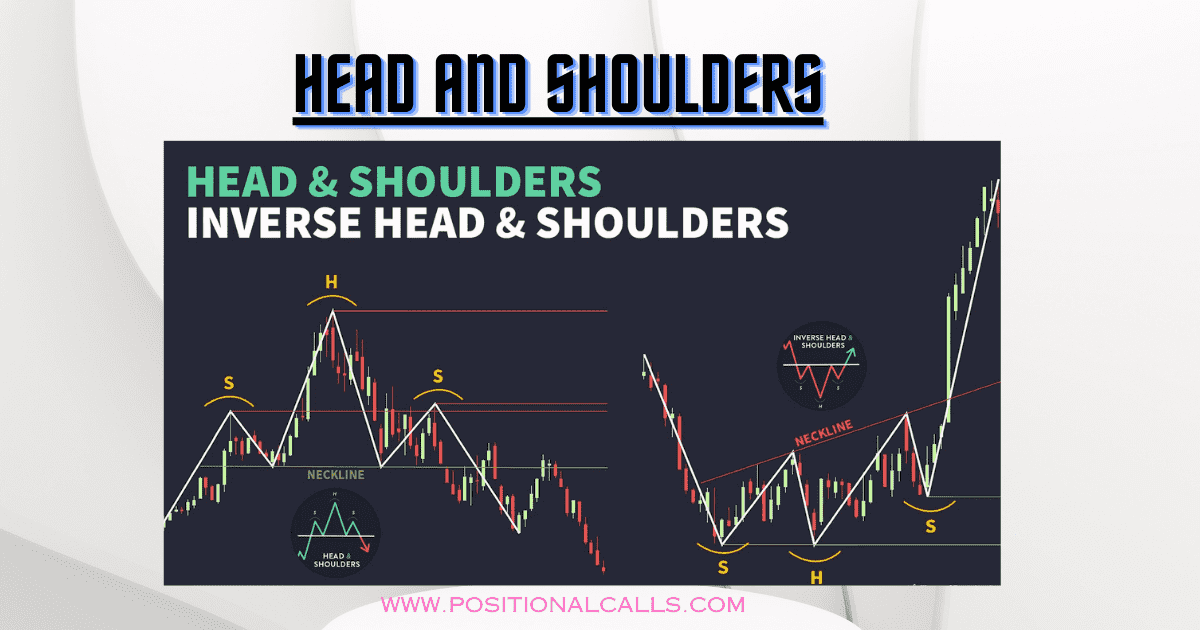
Imagine a chart resembling a serene mountain range. Peaks reach for the sky, valleys cradle secrets, and the overall trend dictates the market’s prevailing sentiment. Now, envision a specific formation amidst this landscape:
- Left Shoulder:
The first peak, a bullish ascent followed by a retreat, forms the left shoulder. - Head:
Soaring higher than its predecessor, the central peak, the head, marks the pattern’s climax. - Right Shoulder:
Another dip and a subsequent rise, mimicking the left shoulder, form the right shoulder. - Neckline: The pattern’s crucial support level is a horizontal line connecting the lowest troughs beneath the left and right shoulders.
Head and Shoulders: The Psychology Behind the Pattern: Why Head and Shoulders Matter
The head and shoulders formation speaks volumes about market psychology. The initial left shoulder signifies bullish enthusiasm, pushing prices higher. However, doubt creeps in, leading to a pullback. The head represents renewed optimism but diminished conviction, resulting in a lower peak. Finally, the right shoulder confirms the fading bullish momentum as prices struggle to reach the head’s height. The neckline breach, signifying a break in support, is pivotal, signalling a potential trend reversal.
Head and Shoulders: High-Octane Trading Strategies: Exploiting the Head and Shoulders for Maximum Profit
Now, let’s put theory into practice. How can you leverage the head and shoulders p
attern to make informed trading decisions?
1. Confirmation is King:
Don’t jump the gun! Please wait for a decisive neckline break with increased trading volume, confirming the bearish reversal.
2. Target Your Descent:
Calculate the price target by simply calculating the length of the neckline, measured vertically from the head
. Take this away—value from the neckline break point to estimate your potential downside profit zone.
3. Risk Management Reigns Supreme:
Always set stop-loss orders above the neckline to mitigate potential losses if the pattern fails.
4. Embrace the Inverse:
Remember, the head and shoulders pattern isn’t just a bearish beast. Its inverted counterpart, with three valleys instead of peaks, signals a potential bullish reversal in a downtrend. Apply the same principles but target upside profit zones.
Head and Shoulders: Beyond the Basics: Advanced
Head and Shoulders Tactics for Savvy Traders
Mastering the basics is just the beginning. Seasoned traders leverage advanced techniques to refine their head and shoulders strategies:
- Multiple Timeframes: Analyse the pattern across different timeframes, from short-term charts for quick trades to long-term charts for broader market trends.
- Volume Confirmation:
Look for increased volume on the neckline break and decreased volume during the formation, strengthening the pattern’s validity. - Moving Averages: Overlay moving averages to identify trend confirmation and potential support/resistance levels.
Read More: Chart Patterns Mastery: 10 Essential Patterns Every Trader Needs to Know
Head and Shoulders: A Timeless Titan in the Trading Arena
The head and shoulders chart pattern is a cornerstone of technical analysis. Its simplicity, visual appeal, and predictive power have earned it a place of honour in the arsenals of countless successful traders.
By understanding its anatomy, psychology, and trading strategies, you, too, can harness its power to navigate the market’s treacherous waters and secure your financial future.
Remember, knowledge is power, and the head and shoulders chart pattern in the trading arena is your key to unlocking a world of profitable possibilities. So, go forth, conquer the market, and claim your rightful place among the trading titans!


Shubham tracks Indian equity markets with a focus on banking stocks, insurance companies, and long-term value investing. PositionalCalls was built to give independent investors the same quality of research that institutional desks produce — in plain language, with no brokerage bias and no paid promotions. All analysis is sourced from RBI, SEBI, NSE/BSE filings, and company annual reports.
Excellent write-up