
Tech Mahindra Share Price Target 2026 |
Tech Mahindra Share Price Target 2026: Market Structure, Q3 Results & Risk Analysis:
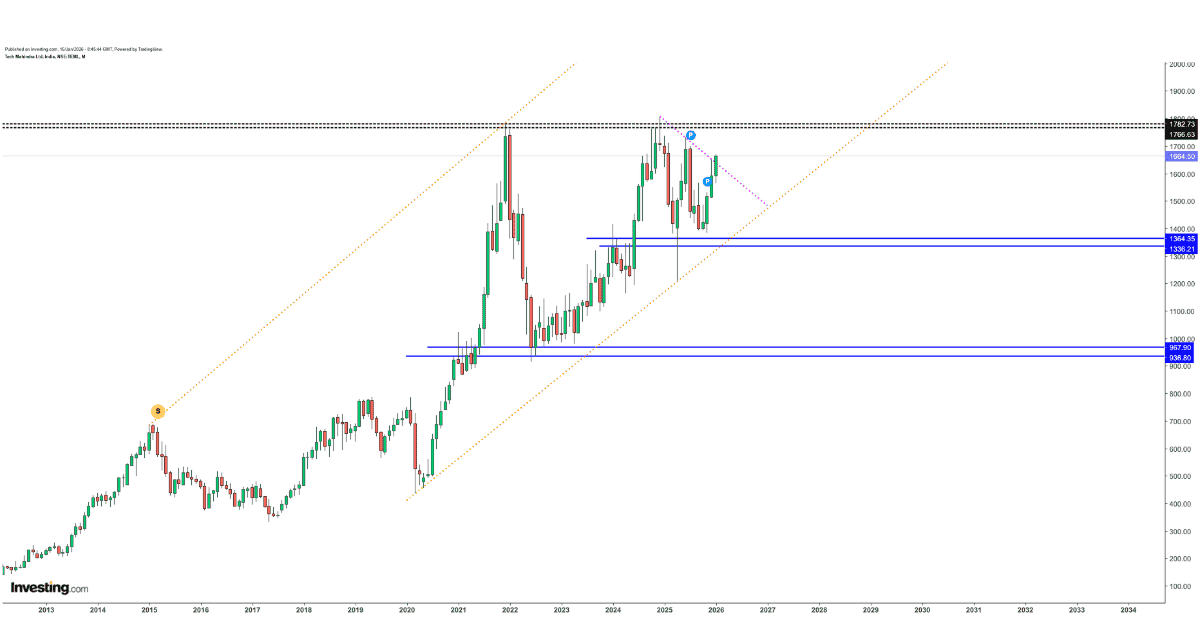
Tech Mahindra is currently undergoing a visible operational and market-structure transition. The company’s focus on GenAI, 5G, digital transformation, and margin recovery has altered how institutional participants are positioning around the stock. This page documents observed price behavior, financial disclosures, and structural risk zones — not investment advice.
📊 Price Structure Snapshot (Observed)
- Current Market Reference:
₹1,640 - Demand Zone (Observed Support):
₹1,480 – ₹1,520 - Supply Zone (Observed Resistance):
₹1,720 – ₹1,750 - Upper Price Expansion Zone:
₹1,850 – ₹2,100 (only if momentum sustains) - Structure Review Horizon:
Medium-term
🧠 Market Observation Note
Price action currently reflects range-to-trend transition behavior. Continuation depends on sustained acceptance above prior supply zones and broader sector participation. All levels mentioned are observational references, not actionable recommendations.
📊 Financial Snapshot (Latest Disclosed Data)
| Metric | Value | Observation |
| Current Market Reference | ₹1,640 | Price stabilisation phase |
| Revenue (FY25) | ₹53,290 Cr | Moderate YoY growth |
| Net Profit (FY25) | ₹4,250 Cr | Margin recovery visible |
| Q3 Net Profit | ₹1,425 Cr | Sequential improvement |
| EBIT Margin | 12.7% | Multi-quarter high |
| EPS (TTM) | ₹43.8 | Improving trajectory |
| ROE | 18.6% | Healthy capital efficiency |
| ROCE | 21.2% | Operational strength |
| Debt-to-Equity | 0.12 | Low leverage |
| Dividend Yield | 2.8% | Shareholder return support |
| Free Cash Flow | ₹3,100 Cr | Stable generation |
📉 Structural Risk Reference Zones
- Primary Demand Zone:
₹1,480 – ₹1,520 - Lower Risk Threshold:
Below ₹1,460 (daily close) - Observation Horizon:
Medium-term
📉 Technical Structure Commentary
The stock has moved above a prior congestion zone near ₹1,600 with above-average volume participation. Holding above the 50-DMA (~₹1,560) preserves the current structure. A sustained acceptance above ₹1,720 would be required to validate higher price discovery zones.
Volume expansion (~2.8x 20-day average) suggests increased institutional activity, subject to follow-through.
📊Tech Mahindra Share Price Target 2026: Key Technical Indicators (Observed)
| Indicator | Status | Interpretation |
| RSI (14) | 61 | Positive momentum, not stretched |
| MACD | Positive crossover | Trend support |
| 50 DMA | ₹1,560 | Intermediate structure support |
| 200 DMA | ₹1,420 | Long-term base |
⚔️ Peer Comparison (IT Sector)
| Metric | Tech Mahindra | Infosys | Wipro |
| Market Cap | ₹1.60 Lakh Cr | ₹7.8 Lakh Cr | ₹2.8 Lakh Cr |
| P/E Ratio | 34.7x | 23.6x | 20.5x |
| Revenue Growth | 6.5% | 4.2% | 2.1% |
| Profit Growth | 27% | 10.8% | 1.2% |
| Dividend Yield | 2.8% | 2.1% | 1.6% |
⚠️Tech Mahindra Share Price Target 2026: Risk & Structure Stress Audit
| Risk Factor | Potential Impact |
| Global IT spending slowdown | High |
| Margin execution risk | Medium–High |
| Currency volatility | Medium |
| Client concentration | Medium |
| AI-driven pricing pressure | Medium |
📊 Scenario Framework (Non-Predictive)
| Scenario | Price Reference | Context |
| Downside Stress | ₹1,440 | Structure failure |
| Base Structure | ₹1,700 – ₹1,750 | Range continuation |
| Expansion Scenario | ₹1,850 – ₹2,100 | Only if momentum sustains |
Institutional Context & Information Scope
This analysis is intended to document publicly observable price behaviour, disclosed financial performance, and sector-level context for Tech Mahindra during the 2026 period. All references on this page are based on historical price structure, technical indicators, and publicly available corporate disclosures. Any price zones or scenarios discussed are conditional observations, not forward-looking assurances. This page should be read as a reference framework to understand how earnings performance, market structure, and risk factors interact over time, rather than as an investment recommendation or solicitation.
⚖️ Regulatory & Content Disclaimer
This page is for educational and informational purposes only. It does not constitute investment advice, recommendation, or solicitation. All price levels and scenarios are observational references based on publicly available data. Readers should consult registered financial professionals before making decisions.
Source: www.positionalcalls.com
READ MORE: Tata Motors Q3 Results Analysis: Measured Institutional View on What Changed