

Double & Triple Tops/Bottoms: Bullish & Bearish Chart Patterns
In the world of trading and technical analysis, understanding chart patterns is essential for making informed decisions. Among the most significant patterns are double tops, triple tops, and triple bottoms. These patterns serve as indicators of potential trend reversals, providing traders with valuable insights into market dynamics. This blog will explore these patterns in detail, discussing their formations, implications, and effective trading strategies.
Contents
- 1
- 2 Double & Triple Tops/Bottoms: What Are Double Tops and Bottoms?
- 3
- 4 Double & Triple Tops/Bottoms: What Are Triple Tops and Bottoms?
- 5 Double & Triple Tops/Bottoms: Formation of Double and Triple Patterns
- 6 Characteristics of Double Tops and Bottoms
- 7 Characteristics of Triple Tops and Bottoms
- 8
- 9 Double & Triple Tops/Bottoms: Trading strategies for double and triple patterns
- 10 Trading Double Tops
- 11 Trading double bottoms.
- 12 Trading Triple Tops
- 13 Trading Triple Bottoms
- 14 Importance of Volume in Confirming Patterns
- 15 Combining patterns with other indicators
- 16 Read More: Indobell Insulation IPO: Key Insights for Smart Investors in 2025
- 17 Conclusion
- 18 Final Thoughts
Double & Triple Tops/Bottoms: What Are Double Tops and Bottoms?
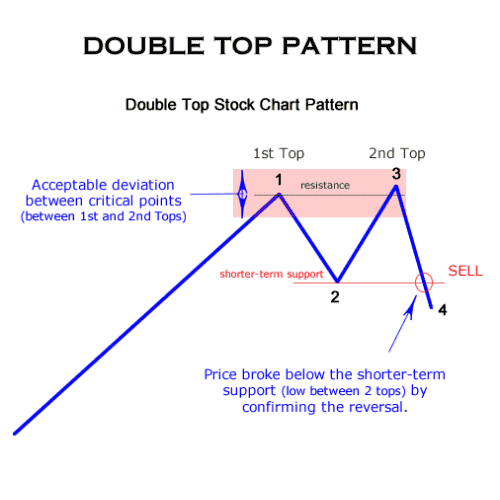
Double Top Pattern:
A double top is a bearish reversal pattern that occurs after an uptrend. It forms when the price reaches a high point twice, separated by a trough. This pattern indicates that the asset has failed to break above the previous high, suggesting a potential trend reversal to the downside. The confirmation of this pattern occurs when the price drops below the trough (neckline) following the second peak.
Double Top Pattern
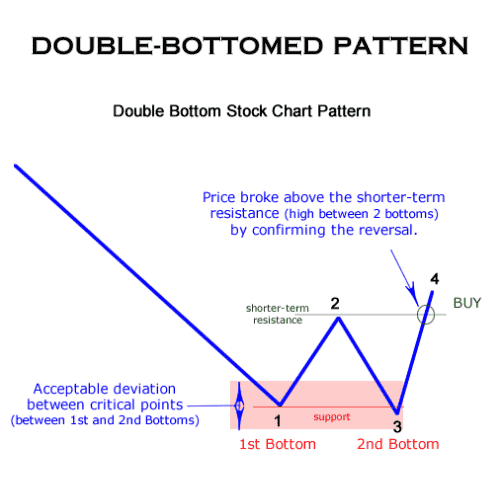
Double Bottom Pattern:
Conversely, a double bottom is a bullish reversal pattern that appears after a downtrend. It consists of two troughs at approximately the same price level, with a peak in between. When the price breaks above the peak (neckline) after the second trough, this pattern suggests that the asset might be ready for an upward movement.
Double-bottomed pattern
Double & Triple Tops/Bottoms: What Are Triple Tops and Bottoms?
Triple Top Pattern:
A triple top is similar to a double top but involves three peaks at roughly the same price level. This pattern signifies strong resistance where buyers have failed to push prices higher on three separate occasions. The confirmation of the bearish reversal occurs when the price drops below the neckline, the lowest point of the trough that formed after the last peak.
Triple Top Pattern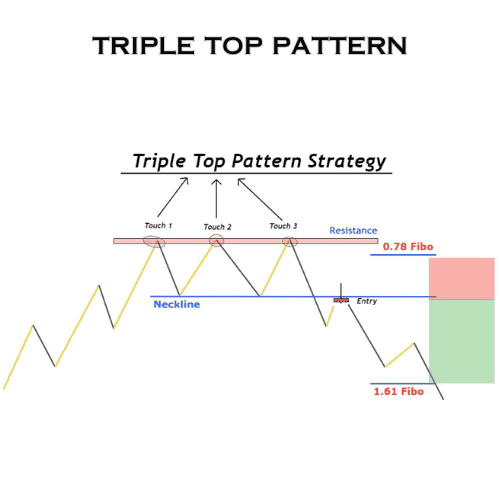
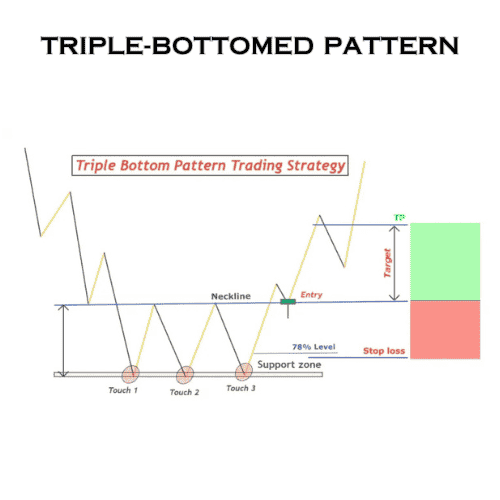
Triple Bottom Pattern:
In contrast, a triple bottom consists of three troughs at similar price levels, indicating strong support. This pattern suggests that buyers are increasingly entering the market after each dip. Prices confirm a bullish trend reversal when they rise above the peak that formed between the last two troughs.
Triple-bottomed pattern
Double & Triple Tops/Bottoms: Formation of Double and Triple Patterns
Characteristics of Double Tops and Bottoms
- Double Top:
- Two peaks at similar price levels.
- A trough between peaks indicates temporary selling pressure.
- Confirmation occurs below the neckline.
- Double Bottom:
- Two troughs at similar price levels.
- A peak between troughs indicates temporary buying pressure.
- Confirmation occurs above the neckline.
Characteristics of Triple Tops and Bottoms
- Triple Top:
- Three peaks at similar price levels.
- Two troughs between peaks indicate selling pressure.
- Confirmation occurs below the neckline.
- Triple Bottom:
- Three troughs at similar price levels.
- Two peaks between troughs indicate buying pressure.
- Confirmation occurs above the neckline.
Double & Triple Tops/Bottoms: Trading strategies for double and triple patterns
Trading Double Tops
- Entry Point:
Traders typically enter short positions once the price breaks below the neckline after forming a double top. - Stop-Loss Placement:
If the trend continues upward, you can place a stop-loss order just above the highest peak to limit potential losses. - Profit Target:
Measure the distance from the peaks to the neckline and project this distance downwards from the neckline to set profit targets.
Trading double bottoms.
- Entry point:
After a double-bottom formation, prices break above the neckline, initiating long positions. - Stop-Loss Placement:
To guard against unforeseen downward movements, place a stop-loss order below the lowest trough. - Profit Target:
Similar to double tops, measure from the neckline to the trough and project this distance upwards for profit targets.
Trading Triple Tops
- Entry Point:
Enter short positions upon confirmation of a breakout below the neckline after forming three peaks. - Stop-loss placement:
Set stop-loss orders above the highest peak to safeguard against false breakouts. - Profit Target:
Use measurements from the peaks to the neckline when setting profit targets.
Trading Triple Bottoms
- Entry Point:
Initiate long positions once prices surpass the neckline after three troughs form. - Stop-loss placement:
Place stop-loss orders below the lowest threshold for risk management. - Profit Target:
Measure from neckline to trough and project this distance upwards for profit targets.
Importance of Volume in Confirming Patterns
Volume plays an essential role in validating these chart patterns. A significant increase in volume during breakout points can confirm that traders are actively participating in driving prices in a new direction. For instance:
- In a double-top scenario, if volume spikes as prices drop below the neckline, it indicates strong selling interest.
- In contrast, for a double bottom, increased volume upon breaking above the neckline suggests robust buying momentum.
Combining patterns with other indicators
To enhance trading accuracy, traders often combine these patterns with other technical indicators such as:
- Relative Strength Index (RSI):
To identify overbought or oversold conditions. - Moving Averages:
To determine overall trend direction and potential support/resistance levels. - Fibonacci Retracement Levels:
To identify potential reversal areas based on historical price movements.
Read More: Indobell Insulation IPO: Key Insights for Smart Investors in 2025
Conclusion
Double and triple tops/bottoms are powerful chart patterns that signal potential reversals in market trends. Understanding their formations, trading strategies, and confirmation mechanisms can significantly enhance trading performance. However, it’s crucial to remember that no pattern is foolproof; thus, employing sound risk management practices and combining multiple indicators can lead to more informed trading decisions. By mastering these patterns, traders can position themselves advantageously in both bullish and bearish markets, capitalizing on potential price movements while managing risks effectively.
Final Thoughts
Incorporating these insights into your trading strategy can help you navigate market volatility more effectively and increase your chances of success in your trading endeavors. Always remember to stay updated with market conditions and adjust your strategies accordingly for optimal results.

Shubham tracks Indian equity markets with a focus on banking stocks, insurance companies, and long-term value investing. PositionalCalls was built to give independent investors the same quality of research that institutional desks produce — in plain language, with no brokerage bias and no paid promotions. All analysis is sourced from RBI, SEBI, NSE/BSE filings, and company annual reports.